Build Interactive Dashboards in Python
Build interactive dashboards in Python. Choose frameworks, connect data, deploy from notebooks, & apply best practices for performance & security.
https://www.youtube.com/watch?v=uhxiXOTKzfs
published
Outrank AI
dashboards in python, python dashboarding, streamlit vs dash, python data visualization, self-serve analytics
850754f5-e498-4513-93fd-e1c70079d68b

You can usually tell when a data team has become a human API. The signs are boring and expensive. A Slack thread asks for “one more chart.” Finance wants a filter added before the board meeting. Product wants the same metric, but sliced by signup cohort instead of plan type. Someone copies a notebook, changes two lines, exports another PNG, and calls it temporary. Then the temporary workflow becomes the reporting system.
That's the point where dashboards in python stop being a side project and start becoming infrastructure.
Teams rarely struggle because they can't draw a graph. They struggle because the graph lives in the wrong place, depends on the wrong person, and breaks the moment someone asks for a different cut of the data. The true job is turning analysis into something other people can use safely, repeatedly, and without asking for help every morning. If you've ever looked at a budget reporting setup and wished your analytics worked more like a centralized dashboard for managing restricted funds, you already understand the appeal of one place where logic, access, and visibility are standardized.
That shift also changes what a dashboard is. It isn't just a chart surface. It's a product with users, permissions, latency constraints, failure modes, and support costs. Teams that miss that end up shipping polished demos that nobody outside the data team can use. Teams that get it right move from reactive ticket-taking to self-serve analytics. If you need a quick baseline on the broader concept, Querio has a useful primer on what a dashboard is.
Table of Contents
Introduction Beyond One-Off Scripts
A notebook is a great place to discover something. It's a terrible place to answer the same question for six different stakeholders every week.
That's the trap many teams fall into. A data analyst builds a useful chart in Jupyter. Someone asks to see it by region. Someone else asks for a date picker. Then an executive wants a link they can open without running Python locally. At that point, you're no longer doing analysis. You're building a product, just without the discipline that product work requires.
The useful shift is to stop asking, “How do I make this graph interactive?” and start asking, “How do I stop my team from being the bottleneck?” Dashboards in python matter because they let the people closest to the data turn repeatable logic into a working interface. The best outcome isn't a prettier report. It's a system where product, finance, operations, and leadership can answer common questions without opening a ticket.
The real problem is workflow design
Most one-off reporting pain comes from three habits:
Analysis and delivery are mixed together. The notebook that explores the data is also the thing serving business users.
Metric logic is hidden. Filters, joins, and exceptions live in code only one person understands.
Access is an afterthought. A dashboard gets shared before anyone decides who should see what.
That combination creates fragility. When the original author is busy, every new request waits. When the data model changes, nobody knows which dashboard is wrong. When a non-technical user wants to adjust a filter, they can't.
Dashboards become self-serve only when the team designs for reuse, not when it adds more charts.
What production-ready actually means
A production-ready dashboard doesn't need to be huge. It does need to do a few things consistently. It should connect to governed data, expose a small set of clear interactions, and behave predictably for users who don't know pandas from Plotly.
For organizations, the typical journey looks like this:
Start with a messy notebook. The logic works, but only for the author.
Extract the reusable data layer. Queries, transformations, and metric definitions get cleaned up.
Add interaction carefully. Filters should answer known business questions, not expose every column in the warehouse.
Harden the app. Caching, auth, monitoring, and deployment stop being optional.
Reduce the dependence on the data team. Non-technical users can explore within safe guardrails.
That last point gets ignored in most tutorials. Plenty of guides can teach you how to wire a dropdown to a chart. Fewer deal with the harder question: how do you make the result usable by someone who doesn't want to read code?
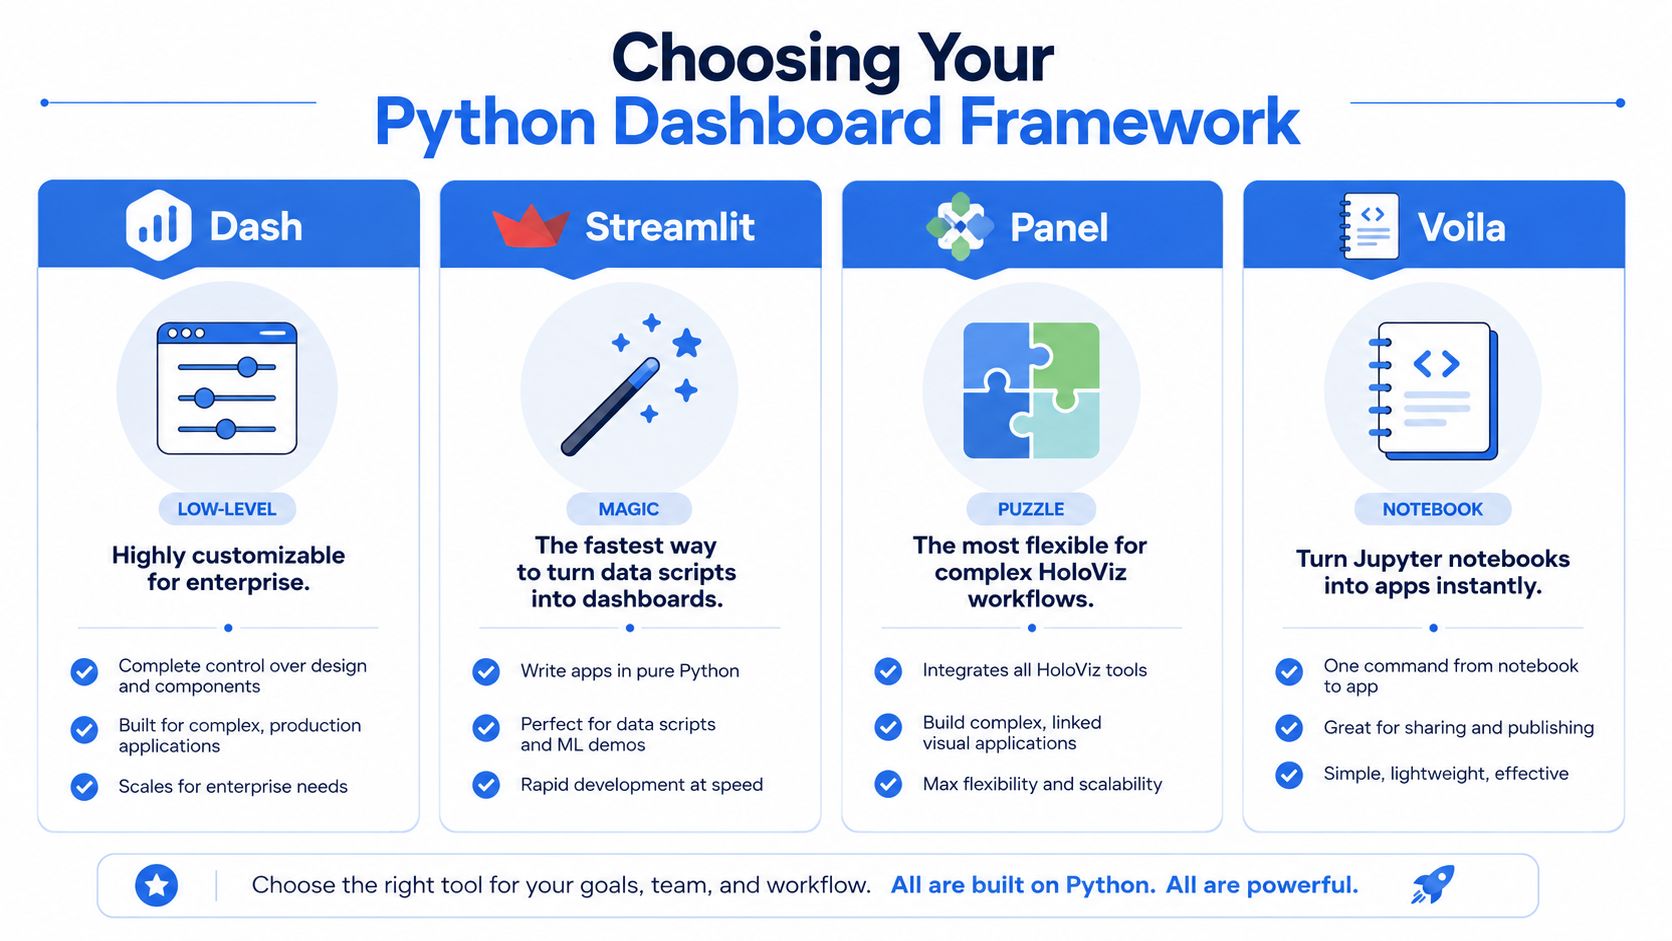
Choosing Your Python Dashboard Framework
Framework choice matters less than many comparison posts suggest, but it still shapes the maintenance burden you'll live with for the next year. Pick the wrong one, and simple demos feel great until the app needs multi-page navigation, role-aware access, shared filters, or reuse across teams.
Dash deserves special attention because it has become the reference point for dashboards in python. Dash was officially released by Plotly in July 2017, and as of 2023, it powers over 50% of Python-based dashboard projects on GitHub, according to Plotly's Dash tutorial documentation. That same tutorial uses the Gapminder dataset to show the framework's core idea: callbacks connect an input like radio buttons to an output like a graph, so the app updates without a page reload.
Python Dashboard Framework Comparison
Framework | Best For | Learning Curve | Customization | Core Concept |
|---|---|---|---|---|
Dash | Production apps with complex interactions | Medium to high | High | Callback-driven web app in Python |
Streamlit | Fast internal tools and simple prototypes | Low | Moderate | Script reruns from top to bottom on interaction |
Panel | Technical apps tied to HoloViz workflows | Medium | High | Reactive components around Python objects |
Voila | Turning notebooks into shareable apps | Low to medium | Moderate | Render Jupyter notebooks as apps |
A front-end team will usually ask a related question early: how tightly does this need to integrate with the rest of the product stack? If that's on the table, it helps to understand the boundary between Python-first tools and UI-heavy web frameworks. This comparison of dashboard development in React is useful because it clarifies where custom app engineering starts to outweigh notebook-style delivery.
Dash works when the app is a product
Dash is the framework I'd reach for when the dashboard has to behave like a proper application. It gives you explicit control over layout, callback logic, state flow, and deployment. That control has a cost. You write more structure up front, and you need to think more carefully about how components interact.
The upside is durability. If you need multiple charts tied to shared filters, custom pages, controlled user flows, or production hosting behind enterprise auth, Dash holds up well. It also maps well to the mental model data engineers already use. Inputs come in, transformation logic runs, outputs update.
Streamlit is excellent until the app gets fussy
Streamlit wins on speed. It's often the shortest path from a dataframe to a useful internal tool. That's why teams love it for prototypes, experiments, and ad hoc reporting interfaces.
The trade-off is architectural. Streamlit apps feel simple because the framework hides a lot of the machinery, but once you need fine-grained interaction patterns or more complex UI behavior, that simplicity can turn into friction. For lightweight internal tools, that may be acceptable. For an app multiple departments depend on, it often isn't.
Panel fits technical teams with specific visualization habits
Panel doesn't get the same mindshare, but it's a strong option when the team already works in the HoloViz ecosystem or wants flexibility across notebook, server, and app contexts. It can be a strong fit for scientific and technical workloads where the visualization stack is already opinionated.
Its personality is different from Streamlit's. It assumes the builder is comfortable composing components more deliberately. If the team likes that style, Panel can be productive. If the team wants immediate simplicity, it can feel heavier than expected.
Voila is the shortest path from notebook to app
Voila is appealing for one reason: it turns a notebook into something people can use without exposing the notebook interface. That makes it useful for demos, research artifacts, and lightweight internal publishing.
Decision rule: if the notebook is the product, Voila is attractive. If the notebook is only the starting point, you'll usually outgrow it.
The catch is long-term maintainability. Notebooks are great for thinking. They're not always great for enforcing clean separation between data logic, interaction logic, and user-facing behavior. Teams often discover that what felt like a shortcut was just deferred cleanup.
Connecting to Your Data Warehouse
A dashboard with a weak data layer becomes unreliable fast. Most failures don't come from Plotly or the web framework. They come from credentials pasted into scripts, dashboard queries doing too much work, and app code talking directly to raw warehouse tables with no guardrails.
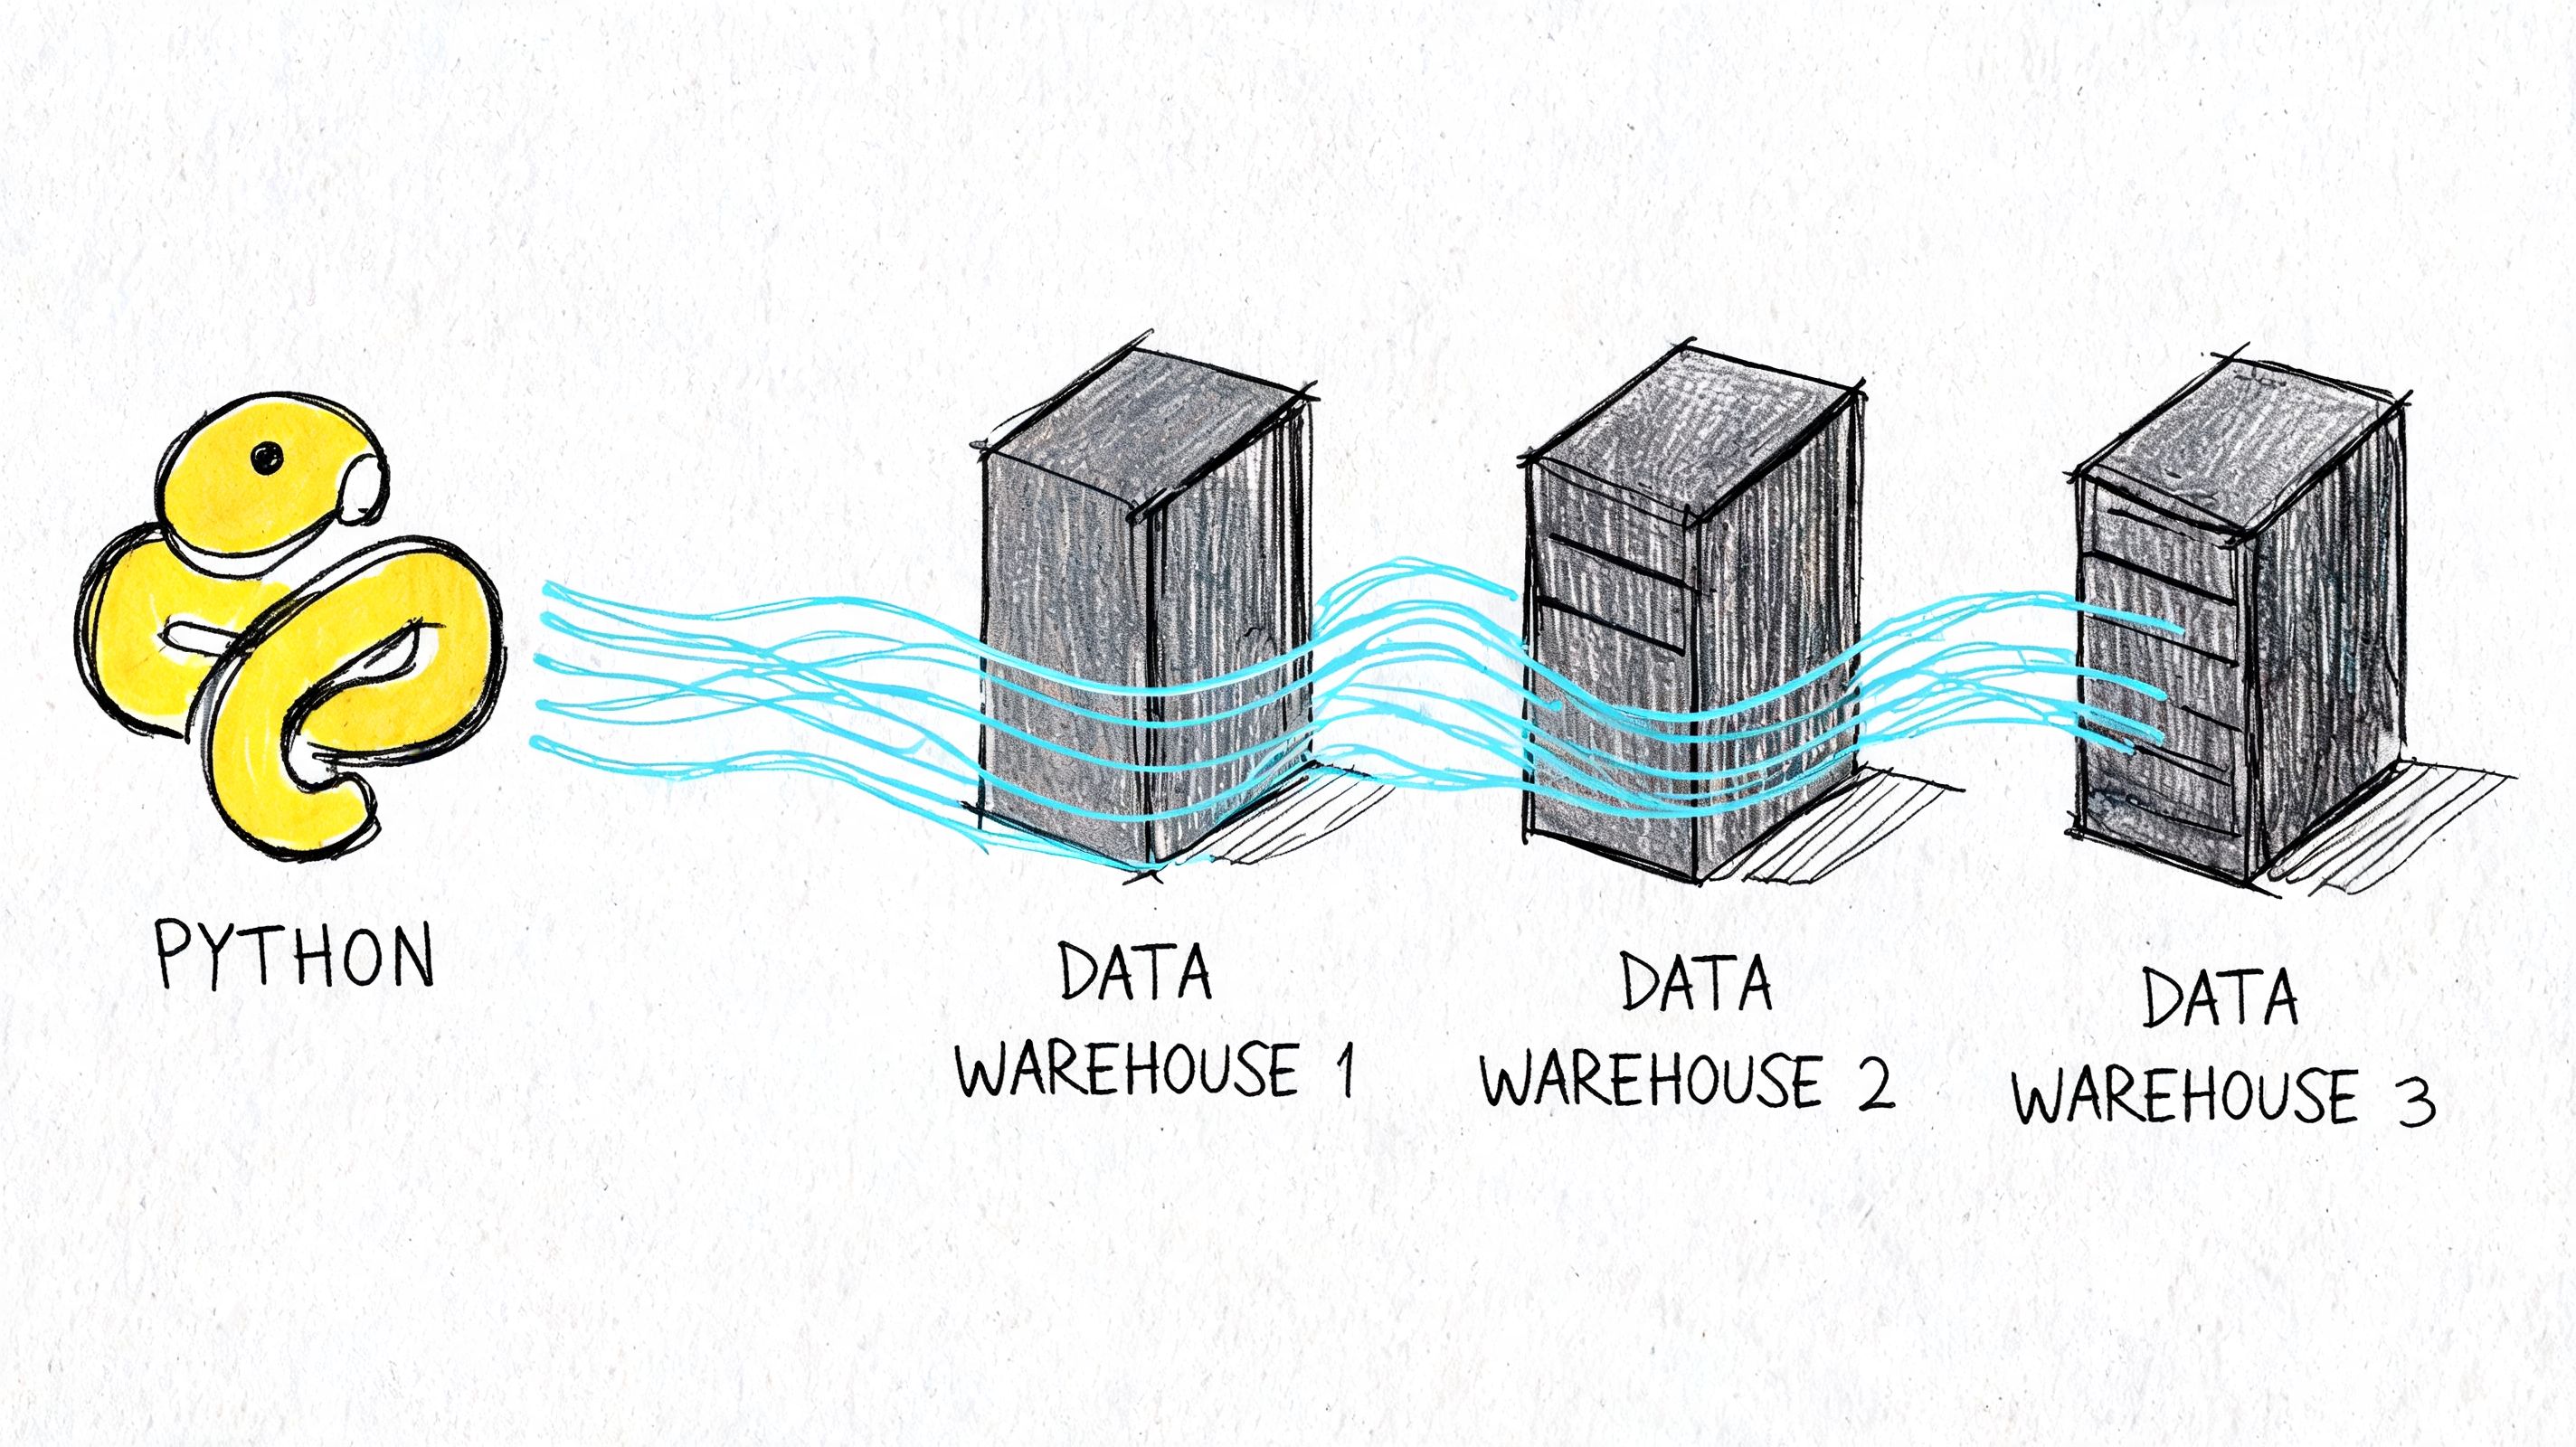
If you're building dashboards in python against Snowflake, BigQuery, Redshift, or Postgres, the boring setup matters most. Teams that don't already have shared warehouse vocabulary should align on that first. This overview of what a data warehouse is is a decent reference to hand to stakeholders who use the term loosely but haven't worked through the operational implications.
Build a data access layer, not a pile of queries
The common anti-pattern is putting pd.read_sql() everywhere in the app. It works for a demo, then becomes impossible to manage.
A better pattern is:
Keep credentials out of code. Use environment variables or a secret manager.
Use a connection layer. SQLAlchemy is still a sensible default because it centralizes connection handling.
Query curated models. Don't let every chart invent its own joins and business logic.
Return dashboard-ready shapes. The app layer should ask for “daily active users by date,” not reconstruct that metric from event tables.
That separation is what makes the dashboard maintainable. It also makes it testable. You can validate the SQL and transformations independently from the chart code.
Real-time data needs an API mindset
Once the dashboard moves from historical reporting to operational monitoring, direct warehouse hits often stop being enough. For streaming or near-real-time use cases, a service layer usually performs better than trying to force every refresh through expensive live queries.
Tinybird's real-time dashboard workflow with Dash is a good example of that pattern. It defines SQL transformations in .pipe files, publishes them as REST APIs, and lets the Dash app call those endpoints through the Verdin Tinybird SDK. For high-velocity data, that setup achieves sub-second query latencies, and 95% of deployments achieve less than 500ms end-to-end latency, according to Tinybird's benchmark on that page.
Treat the dashboard as a consumer of trusted data products. It should not be the place where raw events become business logic for the first time.
Notebook-native setups reduce glue code
The traditional path is clear enough: write SQLAlchemy connections, manage secrets, structure modules, and wire the app to a warehouse. That's still valid. It's also a lot of plumbing for teams that mainly want to turn warehouse data into self-serve tools quickly.
A notebook-native approach can simplify that handoff because the analysis environment and dashboard environment are closer together. Instead of exporting logic from one place and rebuilding it somewhere else, teams can iterate where the data already lives and then harden only the pieces that need production controls. That's often the difference between a dashboard that ships and one that stays in a prototype folder.
Building Interactive Visualizations in Notebooks
Interactivity isn't about adding widgets because dashboards are supposed to have widgets. It's about letting a user ask a sensible follow-up question without needing a new chart from the data team.
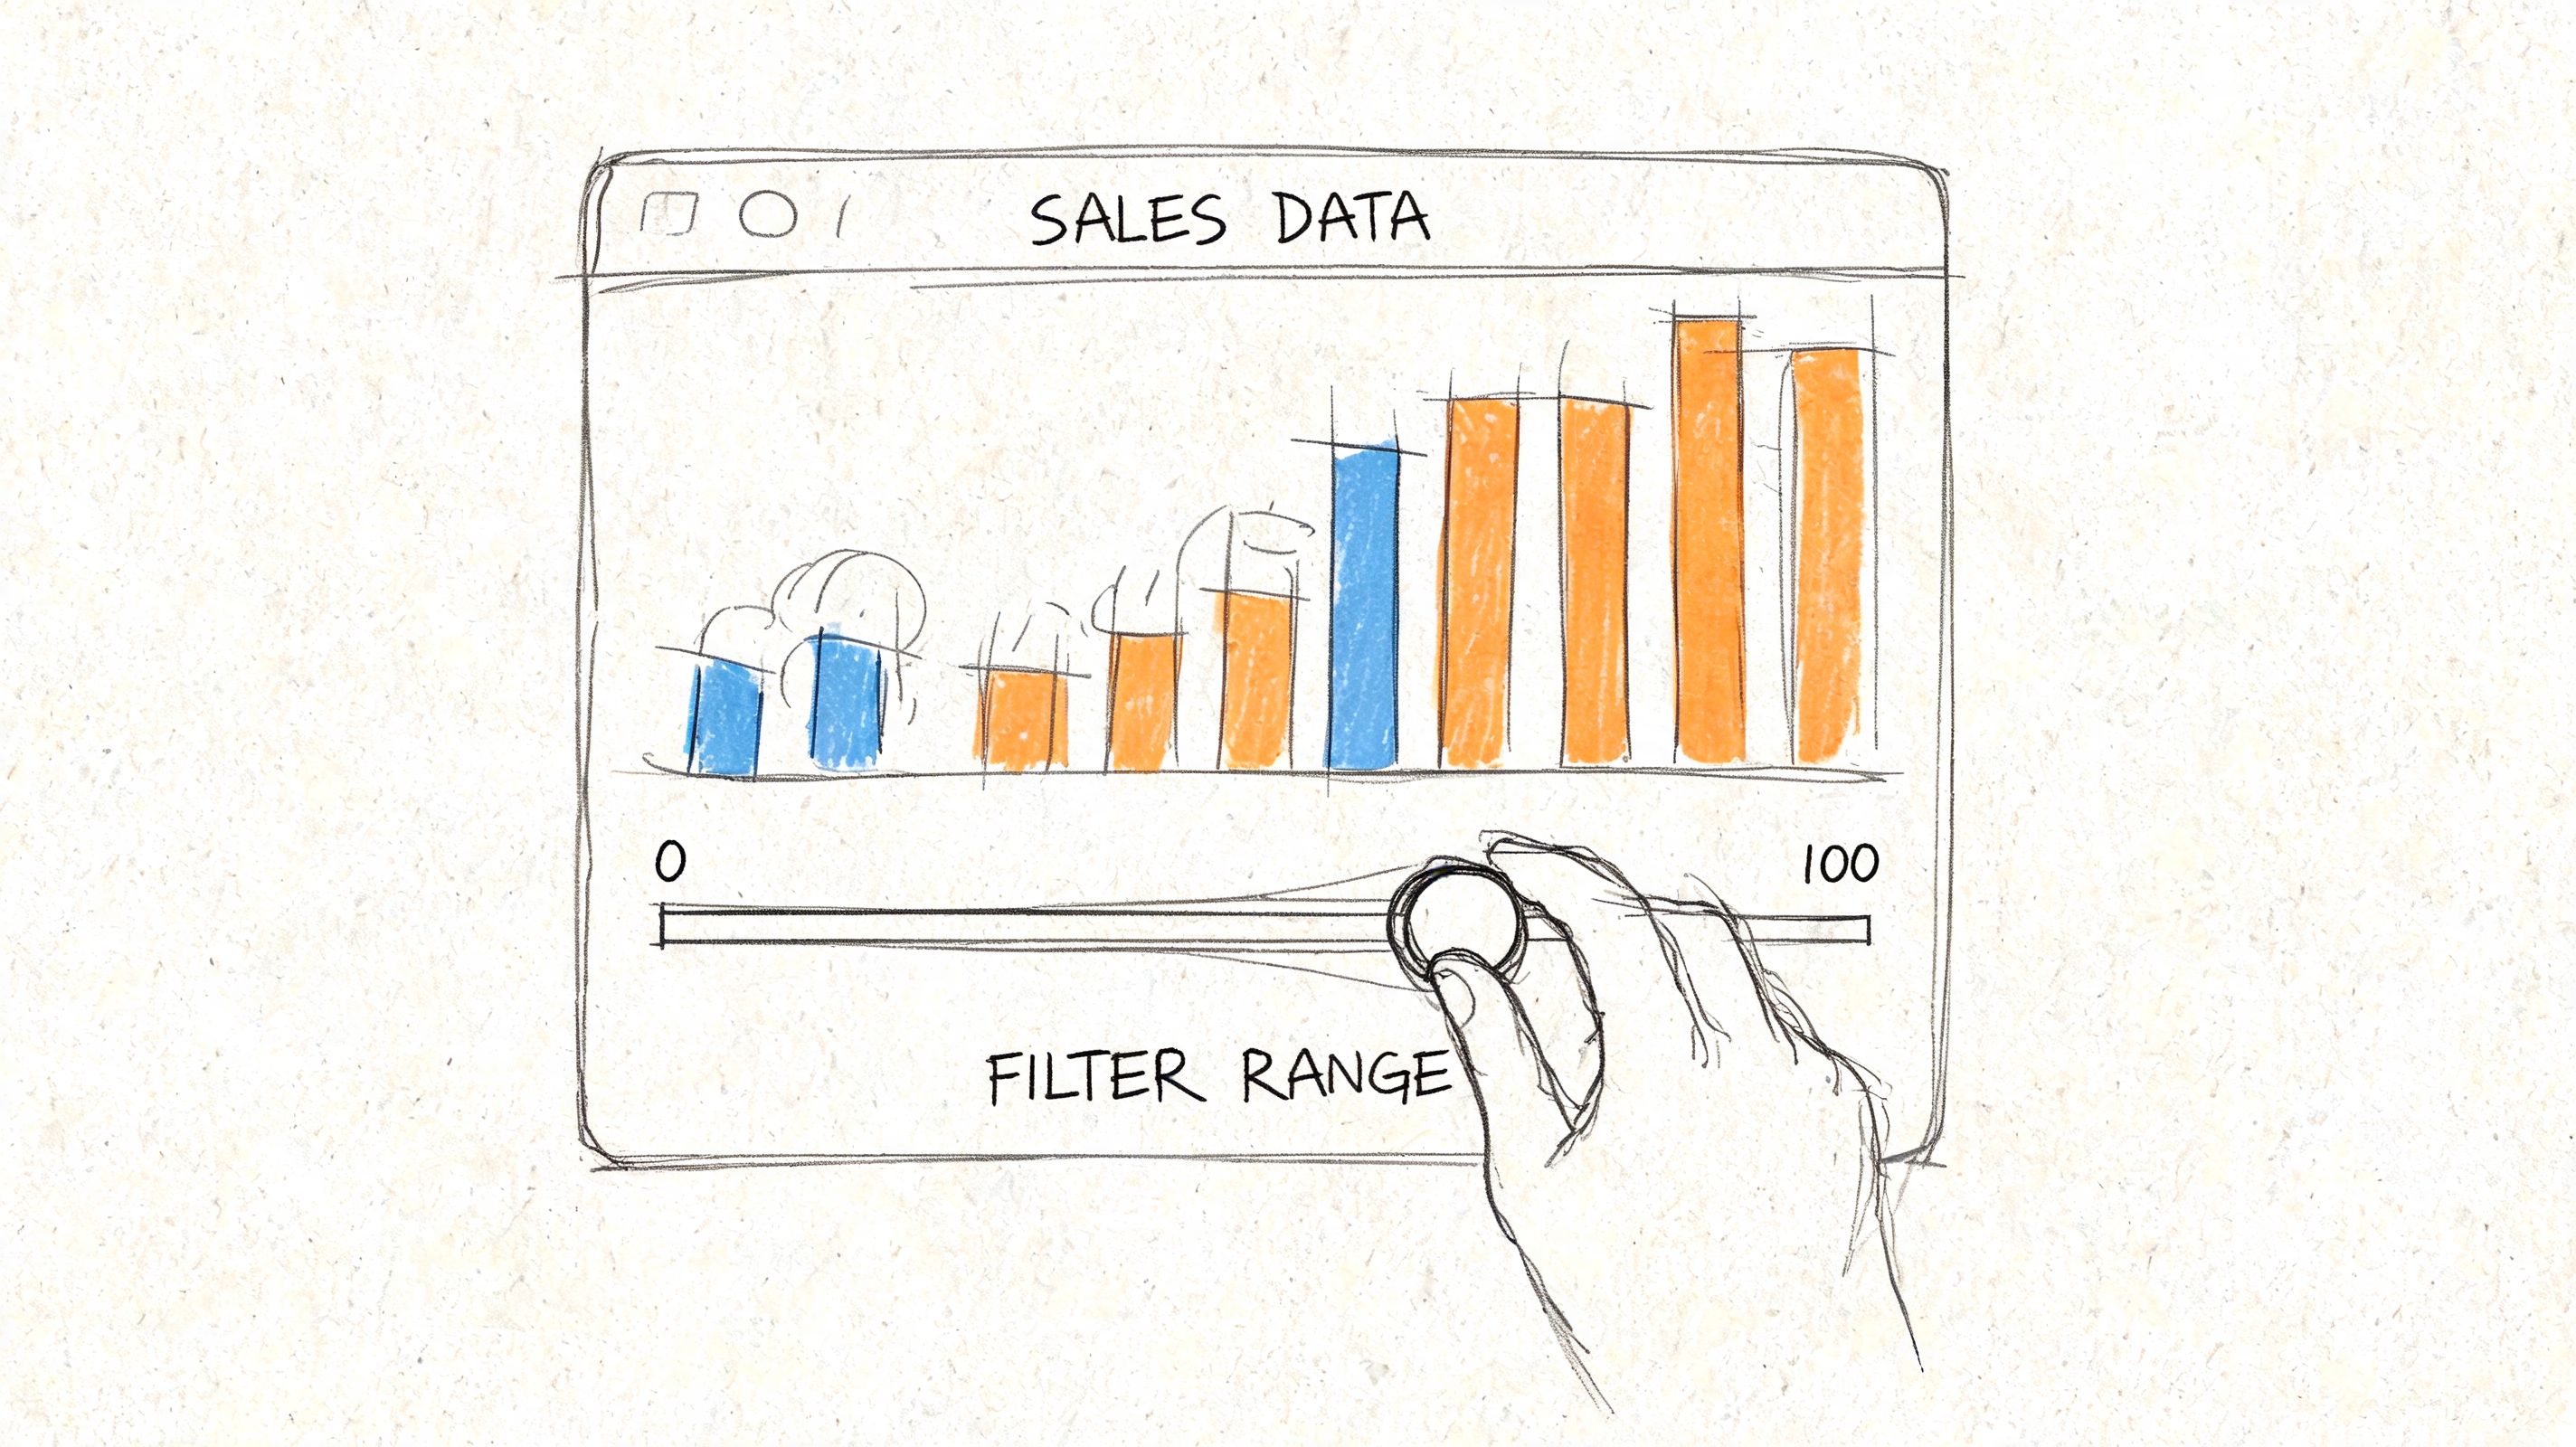
The cleanest way to learn this is with one small example. Say you have a sales dataset with date, region, revenue, and orders. The first dashboard interaction shouldn't expose twenty controls. It should answer one obvious question: “Show me revenue over time for a selected region.”
Start with one control and one chart
In Dash, that usually means a dropdown and a graph. The dropdown sets a selected region. A callback listens for that input, filters the dataframe, and returns an updated figure.
That callback pattern is the key concept. A user changes an input component. Python runs a function. The app updates an output component. Once that model clicks, most dashboard behavior becomes manageable.
A good first pass looks like this in practice:
One dropdown for region
One time-series chart for revenue
One default state so the app loads meaningfully before any interaction
One metric per chart so the interface stays readable
This is why Dash's original tutorial landed so well with practitioners. Its Gapminder example keeps the interaction narrow and easy to reason about. You can see the input, the filtering logic, and the output without a lot of framework noise.
Prototyping inside notebooks is faster than guessing in app code
Notebook-first development is underrated here. Teams often jump straight into app scaffolding and end up debugging layout before they've even decided what the user needs.
In a notebook, you can test the dataset, validate the filtering logic, inspect edge cases, and see whether the chart answers the business question at all. Only then should you formalize the interaction. That's especially useful when the dashboard audience includes non-technical users. You can walk through a working prototype with them before investing in a bigger app shell.
If you want examples of this workflow, these interactive notebook templates are a useful reference for how teams move from exploratory analysis to reusable interfaces.
Use simple components to create meaningful exploration
The strongest proof of this approach isn't a flashy app. It's a restrained one. The Programming Historian built an interactive dashboard from Chronicling America API data covering 1836 to 1963, using Dash components to visualize newspaper languages. It filters pie charts by decade sliders, and the hover tooltips reveal exact percentages drawn from a 2.7M+ page dataset, as shown in their interactive dashboard lesson. That example matters because it shows how far simple controls can go when the data question is clear.
Here's where many first builds go wrong:
Too many filters at launch. Users don't know which combination matters.
Callbacks that own business logic. The callback should orchestrate updates, not become the only place metric definitions live.
Visuals that change shape unpredictably. Keep axes, labels, and semantics stable unless there's a strong reason not to.
A dashboard becomes easier to use when every control answers a specific user question.
Later in the build, it helps to watch a complete interaction pattern being assembled end to end. This walkthrough does that well:
Think in interaction contracts
One way to keep notebook prototypes from turning chaotic is to define an interaction contract for each control.
A date range picker should only change the time window. A region dropdown should only change geography. A metric selector can swap the measure being plotted, but it shouldn't implicitly rewrite dimension logic too. When controls have stable roles, non-technical users learn the interface quickly, and engineers can test behavior without guessing at side effects.
That discipline also makes refactoring easier. When you eventually move notebook code into a larger app, the interaction model is already clear. You're packaging a known behavior, not reverse-engineering an experiment.
Best Practices for Performance and Access Control
A dashboard that works for one person on localhost can still fail badly in front of a real audience. The two most common reasons are predictable. It's slow, or it exposes data more broadly than intended.
Good teams treat performance and access control as design requirements, not polish added at the end.
Making it fast
Most slow dashboards have the same root cause. Every filter change re-runs expensive work that didn't need to happen again.
The more reliable pattern is to centralize the data layer, cache repeated results, and make UI callbacks as thin as possible. In an advanced Dash deployment example, caching Snowflake queries in Redis reduced load times by 70%, and global filters implemented with pattern-matching callbacks cut redundant queries by 85%, according to this Dash performance walkthrough.
That same source calls out a common operational bug: unpaginated tables can leak memory. The practical fix is simple. Use dash-table with page_size and virtualization instead of trying to dump a large result set into the browser at once.
Practical rule: cache data, not just figures. If the query result is stable for a short window, let multiple components reuse it.
A performance checklist I'd use early looks like this:
Move expensive transformations upstream. Pre-aggregate in SQL when possible.
Use global filters carefully. One shared state object is better than five independent callbacks hitting the warehouse.
Paginate tables. Browsers are bad places to render giant grids.
Reserve live refresh for metrics that need it. Not every chart should poll for updates.
If you build reporting for marketing or paid acquisition teams, reviewing examples of best marketplace advertising dashboards can help calibrate what users expect from interactive filtering and at-a-glance KPI layout. The useful lesson isn't the visual style. It's how constrained the interfaces usually are.
Making it secure
Security starts with a blunt question: who should see this data?
A surprising number of internal dashboards skip that decision until after the app is already shared. Then the team tries to bolt on access control later, usually under deadline pressure. That's backwards. The auth model should shape the app design from the start.
For lightweight internal tools, basic authentication may be enough. For anything used across departments, SSO is usually the right answer because it maps access to existing identity systems and keeps user management out of the dashboard codebase. Row-level controls matter too. Even with valid login, users may not be allowed to see the same customer, territory, or financial data.
A simple sequence works well:
Question | Why it matters |
|---|---|
Who can log in? | Determines auth method and deployment model |
What data can each user see? | Drives row-level filtering and tenancy rules |
What actions can users take? | Separates viewers from editors or power users |
Authentication tells you who the user is. Authorization decides what they can access. Teams confuse those constantly.
The self-serve problem shows up here too. If non-technical users need editable dashboards, you need stronger guardrails, not fewer. Safe defaults, curated filters, and clear ownership matter more than fancy interaction patterns.
Deploying and Productionizing Your Dashboard
Deployment is where many promising dashboard projects stall. The analysis works. The demo works. The first internal review even goes well. Then the team realizes that nobody agreed on hosting, auth, CI/CD, monitoring, or who owns the app after launch.
That gap is bigger than most tutorials admit. According to this production deployment discussion, 60% of Python dashboards fail in production due to unaddressed auth, CI/CD, and monitoring gaps. The same discussion notes that Streamlit's single-threaded nature can cause high memory usage with 100+ concurrent users, and that Dash can hit callback bottlenecks without more advanced configurations such as Redis clustering.
Pick the deployment model you're willing to maintain
Heroku-style platform services are still useful when the goal is to get an app online quickly with minimal infrastructure work. Cloud infrastructure like AWS gives more control, but it also shifts more operational responsibility onto the team. Managed app platforms reduce boilerplate, but they can limit architectural choices later.
The right answer depends less on ideology and more on ownership. If the data team is going to run this long term, choose the path that matches its operational bandwidth. A dashboard no one can reliably maintain isn't production-ready just because it's online.
The notebook-to-app transition is the awkward part
This is the handoff that burns time. A useful notebook isn't automatically a deployable application. Teams often rewrite logic from .ipynb into .py, separate out helpers, recreate charts in a framework layout, and then discover that the production version behaves differently from the prototype.
That's one reason notebook-native systems are getting more attention. If analysis artifacts can move closer to production without a full translation step, the path to self-serve gets shorter. Instead of treating the notebook as disposable, the team treats it as a first-class build surface and adds controls around it.
This is where tools differ in philosophy. Some force you to graduate from exploration into app engineering quickly. Others try to preserve the notebook workflow while adding permissions, sharing, and deployment semantics.
Self-serve only works when ownership is explicit
The last production question is organizational, not technical. Who owns metric definitions? Who approves access? Who monitors failures? Who updates the app when the warehouse schema changes?
If the answer to all of those is “the one data engineer who built it,” the dashboard isn't self-serve. It's just a nicer ticket queue.
One option in this space is Querio, which uses a file-system approach with Python notebooks on top of the data warehouse so teams can query, analyze, and build internal analytics experiences without splitting work across as many disconnected tools. That model is useful when the main problem isn't drawing charts. It's reducing the distance between warehouse logic, notebook exploration, and a usable interface for the rest of the company.
If your team is stuck between ad hoc notebooks and heavyweight BI tooling, Querio is worth a look. It's built for teams that want self-serve analytics on top of the data warehouse, with Python notebooks and AI-assisted code generation that both technical and non-technical users can work from without turning the data team into a permanent request queue.

