Business Intelligence
Scheduled Reports That People Actually Read: A Playbook
Make recurring reports actionable: one reader, one decision, 3–5 headline metrics, timed delivery, data checks, and action tracking.

I start every scheduled report with one reader, one decision, and one person responsible for acting. Then I choose the metrics, delivery time, and next step around that decision - not around what fits on a dashboard.
Here’s the approach I use:
- Keep it short: Put three to five headline metrics in the summary, with changes, thresholds, and actions. Link to charts and analysis for details.
- Time it for action: Match email, chat, or review packs to the reader’s needs. Send after data checks pass and before the decision is due.
- Make it safe to use: Set metric definitions, check access, show when the data was last updated, and keep SQL/Python available for review in Querio.
- Measure decisions, not just clicks: Track completed actions separately from readership. After two or three cycles, revise, combine, or retire reports that serve no clear purpose.
My rule: send a decision aid, not a dashboard dump. A report earns its place when it helps you decide what to do - or confirms that no action is needed.
::: @figure 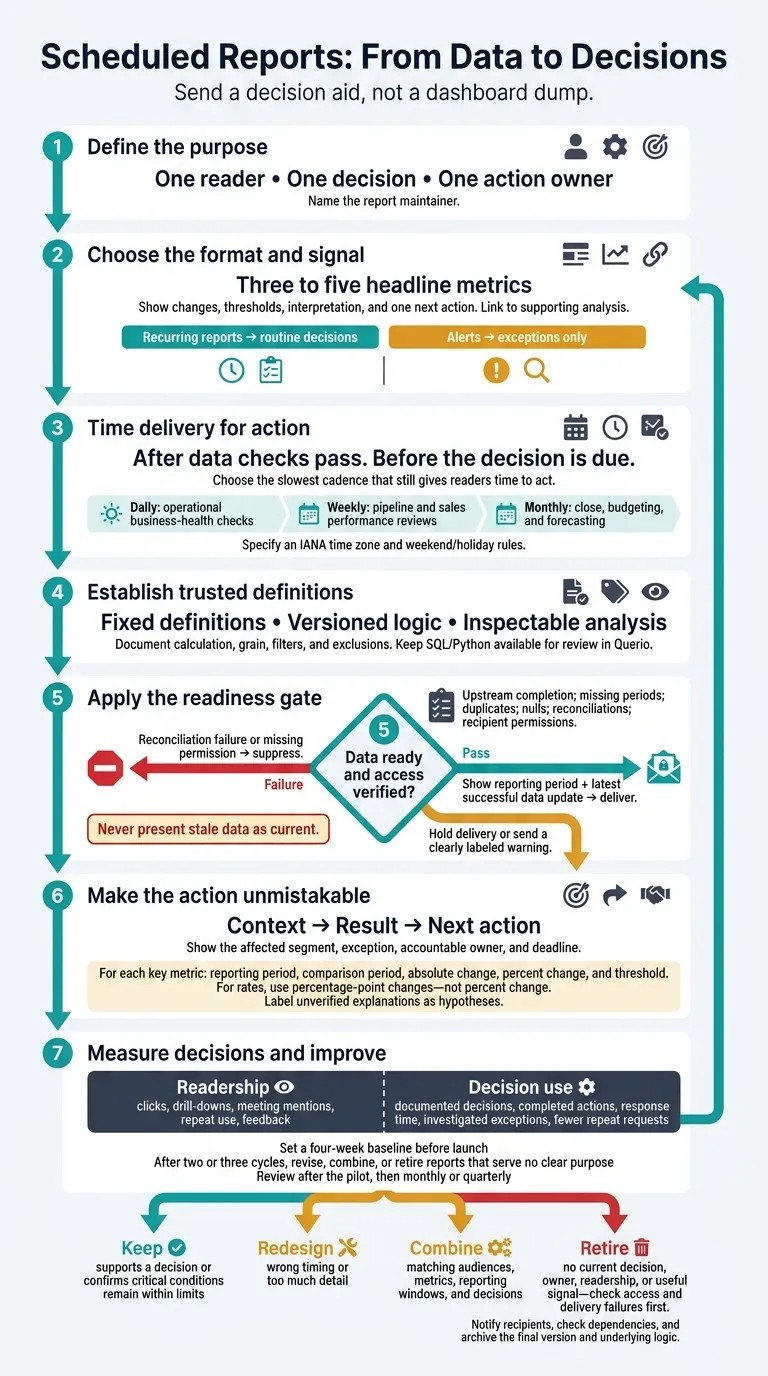 {Scheduled Reports: From Data to Decisions}
:::
{Scheduled Reports: From Data to Decisions}
:::
Choose the Right Format and Schedule
Compare Report Formats
Schedule recurring reports to support decisions. Send alerts only for exceptions. Keep summaries short, with a link to a dashboard or notebook for further investigation.[2]
| Format | Primary reader and decision | Recommended content | Main limitation |
|---|---|---|---|
| Email summary | Executives or managers checking routine status | Three to five headline metrics, changes, interpretation, and one next action | Can get repetitive or buried in inboxes |
| Slack or Microsoft Teams alert | On-call operator or accountable owner responding to an urgent exception | Metric, breached threshold, affected segment, timestamp, owner, and investigation link | Creates noise when thresholds are too sensitive or ownership is unclear |
| Dashboard snapshot | Meeting participants who need a quick visual status check | Key charts, period comparison, status indicators, and live dashboard link | May not explain why metrics changed or what to do next |
| Notebook-based report | Analysts or reviewers validating a result | Reproducible SQL or code, assumptions, methodology, charts, and findings | Too technical for routine executive decisions |
| Exception report | Managers or teams fixing outliers | Failed records, threshold breaches, aging items, or outliers, with priority and owner | May leave out context or miss issues outside the rules |
| Monthly review pack | Finance and leadership teams making resource or forecast decisions | Revenue, costs, margin, forecast variance, trends, risks, decisions requested, and actions | Too slow for urgent operational problems |
Use email or chat to support the decision, a linked report for deeper analysis, and a PDF for fixed review packs. Put calculations and supporting charts behind the link, and check access before sending.
Then schedule delivery around the meeting or decision the report supports.
Time Delivery Around Meetings and Data Updates
Choose the slowest cadence that still gives readers time to act. Daily summaries suit operational business-health checks. Weekly reports support pipeline and sales performance reviews, while monthly packs support close, budgeting, and forecasting.
Wait until upstream jobs finish before sending. If the data isn't ready, send a clear “data not ready” notice - not partial results.
For a Monday 9:00 a.m. sales review, target
8:00 a.m. America/New_York, provided the CRM sync and required metric models have finished. Readers who need more preparation may need Friday delivery instead.
Use an IANA time zone, such as America/New_York, to keep delivery on local time through daylight saving changes.[1] Set explicit rules for weekends and holidays. If the decision meeting moves, move delivery with it rather than automatically sending on Friday. For month-end reports, follow the finance close calendar.
With the format and cadence set, focus next on making changes and next steps hard to miss.
Highlight Changes and Next Actions
Use this order: context, result, and next action. Once the audience, cadence, and format are set, this part of the report turns findings into action.
Lead with the metric most likely to change a decision. Then show the affected segment, the exception, and the response. For each key metric, include the reporting period, comparison period, absolute change, percent change, and threshold. For rates, use percentage-point changes - not percent change.
Keep the structure the same for daily, weekly, and monthly reports. Only the metrics and thresholds change, so readers can stay focused on what to do next.
Put thresholds and anomalies upfront. Use a line chart to show trends and a short exception table ranked by impact. Treat drivers as evidence: state what the data shows, and label explanations that haven’t been verified as hypotheses.
Example: Daily Business-Health Summary
Hypothetical summary: Bookings fell from $125,000 to $100,000, down $25,000, or 20%, versus the comparison period. Identify the affected segment and assign the investigation to revenue operations by a clear deadline. Next action: Validate booking records and segment changes; escalate only if the validated result breaches the agreed threshold.
Example: Weekly Sales Performance Report
Report pattern for sales leadership: Identify whether bookings versus target and forecast variance warrant revising the forecast or redirecting sales effort, then show pipeline coverage, stage movement, and win rate. Use one qualification rule throughout the report. Separate observed stage delays from unverified explanations. Rank flagged deals or segments by their impact on the target, name the accountable owner, and link each exception to supporting records and analysis. Decision: Inspect stalled deals, revise the forecast, or redirect sales effort.
Example: Monthly Finance Review
Report pattern for finance leadership: Lead with the decision requested: revise the forecast or approve a spending adjustment. Support it with actuals versus budget, margin, retention, and forecast changes, using dollar variances for amounts and percentage points for rates. Decision at the review meeting: Attach each material exception to an owner and the forecast or spending change requiring approval.
Set Definitions and Check Report Quality
Once you’ve set the report’s audience and schedule, pin down its definitions and data checks. Treat every recurring report as a production data product: fixed definitions, access rules, and a visible data-update timestamp. A schedule can’t fix unreliable data or unclear metric logic.
Use Consistent Metric Definitions
Tie each KPI to one trusted warehouse model and its dbt logic. Version the calculation, grain, filters, and exclusions. Require code and documentation updates in the same pull request. When a definition changes, tell readers what changed and whether historical comparisons have been recalculated.
Querio’s governed context layer stores definitions, joins, and trusted queries in SQL, Markdown, and Python files synced with GitHub alongside your dbt project. Humans approve reusable context.
With definitions set, check that the data is ready to send.
Check Data Readiness, Access, and Failures
Before delivery, check upstream completion, missing periods, duplicates, nulls, reconciliations, and recipient permissions. Display both the reporting period and the latest successful data update - not just the send time. Incomplete or inaccurate results can steer readers toward the wrong decision.
Set failure rules before launch. Suppress reports when reconciliation fails or recipients lack permission. For incomplete or late data, either send a clearly labeled warning or hold delivery. Never present stale data as current.
Preflight checks must cover access to the delivered content, not just linked analysis. Name an owner to resolve failures and approve any corrected delivery.
Once delivery rules are set, make sure readers can inspect the underlying analysis.
Keep Analysis Inspectable in Querio
Querio can schedule saved analyses or prompted investigations for Slack or email using live, encrypted, read-only warehouse connections - no CSV exports. Analysts can inspect and edit its SQL/Python to trace filters, joins, and calculations in notebooks. Connected charts update when the logic changes.
Governed self-serve lets nontechnical readers answer follow-up questions without sending every request to the data team.
Treat unverified explanations as hypotheses.
Measure Usefulness and Retire Unused Reports
Once a report is live, measure whether it changes decisions, not just whether it gets delivered. Reduce, merge, or retire it if it doesn't support action after two or three cycles.
Track Readership and Actions Separately
Track clicks, drill-downs, mentions in decision meetings, repeat use, and feedback separately from actions taken. Treat email opens as a rough guide only. Privacy features can preload tracking pixels before someone opens the message.[3][4] Low clicks might mean the email answered the question - or that readers couldn't access the report.
Separate “people saw it” from “people used it to make the intended decision.” Measure documented decisions, completed actions, response time, investigated exceptions, and fewer repeat requests for the same analysis.
Set a four-week baseline before launch, then compare equivalent periods. Keep a decision log with the date, issue, owner, action, and status. Judge success against the intended decision, not a generic engagement benchmark.
Review, Combine, or Retire Reports
If few people read the report and no actions follow, change it or end it.
Review reports after the pilot, then monthly or quarterly. Check whether each one still supports its named decision. Redesign reports that support a decision but arrive at the wrong time or include too much detail. Combine duplicates when their audiences, metrics, reporting windows, and decisions match.
Retire reports that lack a current decision, owner, readership, or useful signal - but check for access and delivery failures first. Keep stable reports that confirm critical conditions remain within limits. Before retiring a report, notify recipients and check any processes that depend on it. Save the final version and underlying logic for audits.[5][6]
Scheduling Checklist
Before sharing the report with more people, run through this checklist.
- [ ] Purpose: Decision, reader, action owner, maintainer.
- [ ] Metrics: Governed definitions, sources, filters, owners, comparison periods.
- [ ] Signal: Thresholds, changes, next actions, owners, due dates.
- [ ] Timing: Reporting window, time zone, local delivery time.
- [ ] Readiness: Refresh checks, data-as-of time, permissions for reports and drill-downs.
- [ ] Traceability: Inspectable logic and report context in Querio.
- [ ] Failures: Late, incomplete, or unavailable data; response and notification owner.
- [ ] Pilot: Recorded feedback; separate readership and action tracking.
- [ ] Review: Specific date to reassess usefulness and continued need.
Schedule a decision aid, not a dashboard dump.
FAQs
::: faq
How do I set thresholds that avoid alert fatigue?
Tie thresholds to business-critical outcomes. Configure alerts only when they call for a specific, predefined response, and retire notifications that don’t lead to a clear action.
Route alerts to the teams or roles that need them, and set their frequency based on how soon recipients can act. Use a centralized semantic layer to keep metric definitions and threshold calculations consistent across the organization. :::
::: faq
How can I tell whether a report improved a decision?
Ask users what they did after a meaningful change in the data - whether they adjusted a budget or investigated a drop in retention. Check that the report supports a specific business decision, has an owner who’s accountable, and helps improve outcomes instead of just describing past performance.
If no one can point to an action it prompted, consider retiring or redesigning the report. Look for signs that it helps people make decisions sooner or reduces rework. :::
::: faq
How should I handle metric changes in historical comparisons?
Keep metric definitions consistent with a governed semantic layer, rather than editing each report separately. Update the canonical logic in dbt or your semantic model so downstream dashboards and scheduled reports automatically use the new calculation.
Record the change in your metric catalog, tell stakeholders when it takes effect, and use versioning so historical data remains available for review. These steps help maintain trust and prevent business units from using conflicting definitions. :::