Business Intelligence
How Do You Migrate Apache Superset Dashboards and Datasets Into dbt?
What a Superset export carries into dbt MetricFlow, what it leaves behind in the charts, and what to fix in Superset before you export.
 Javier BonillaCo-founder & CTO
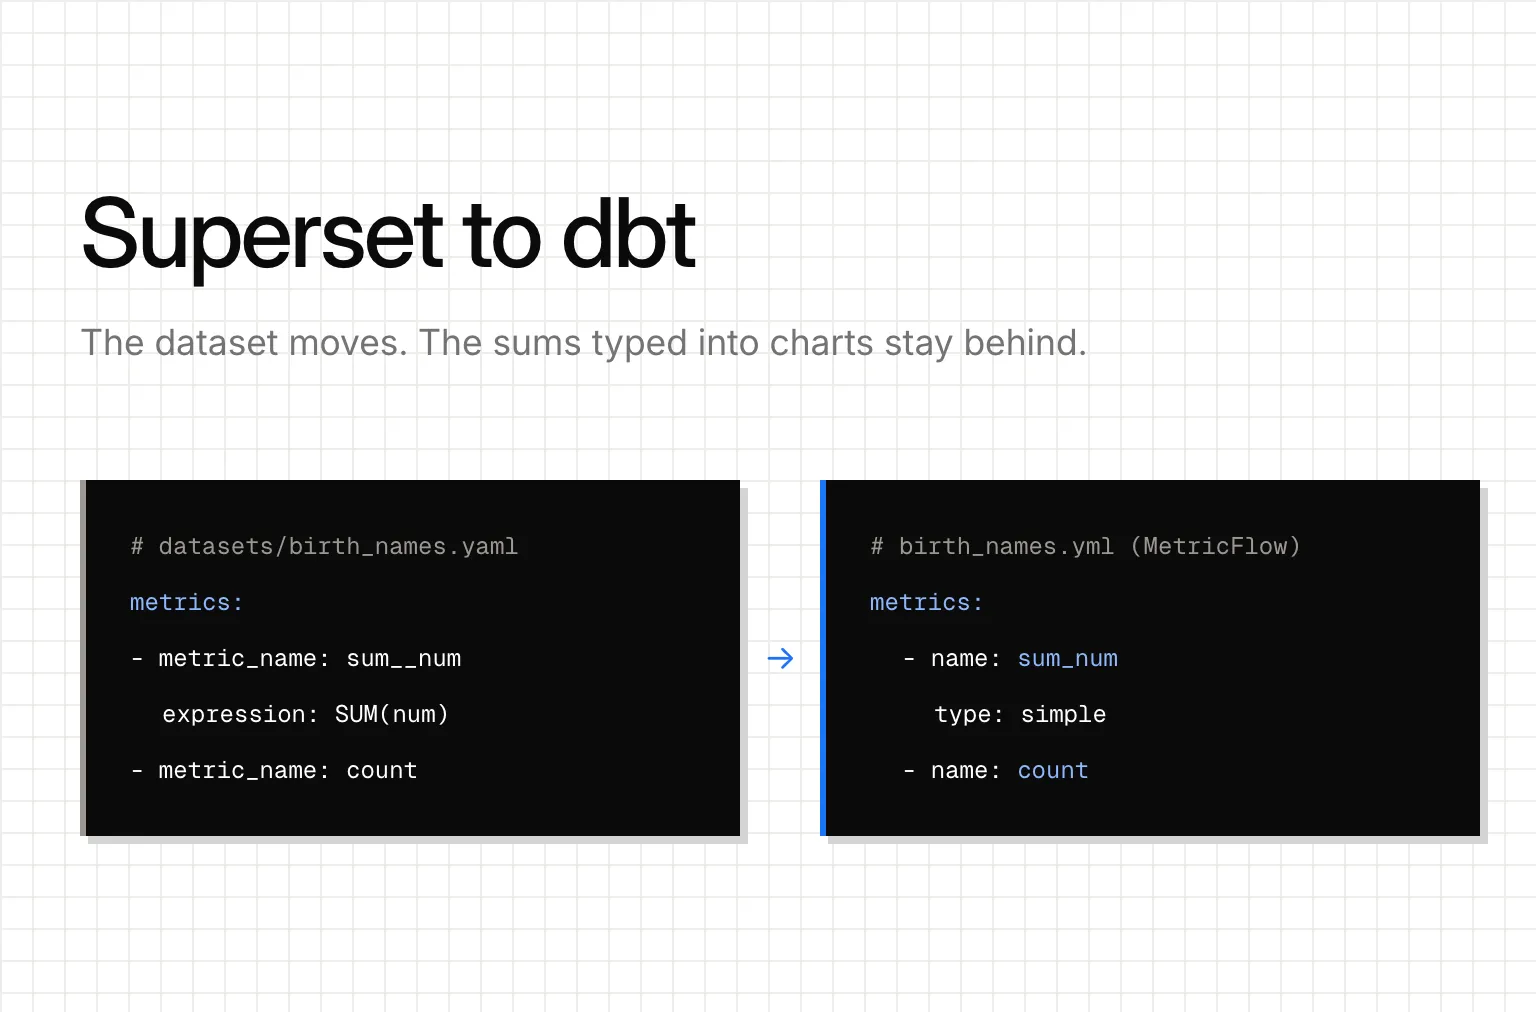
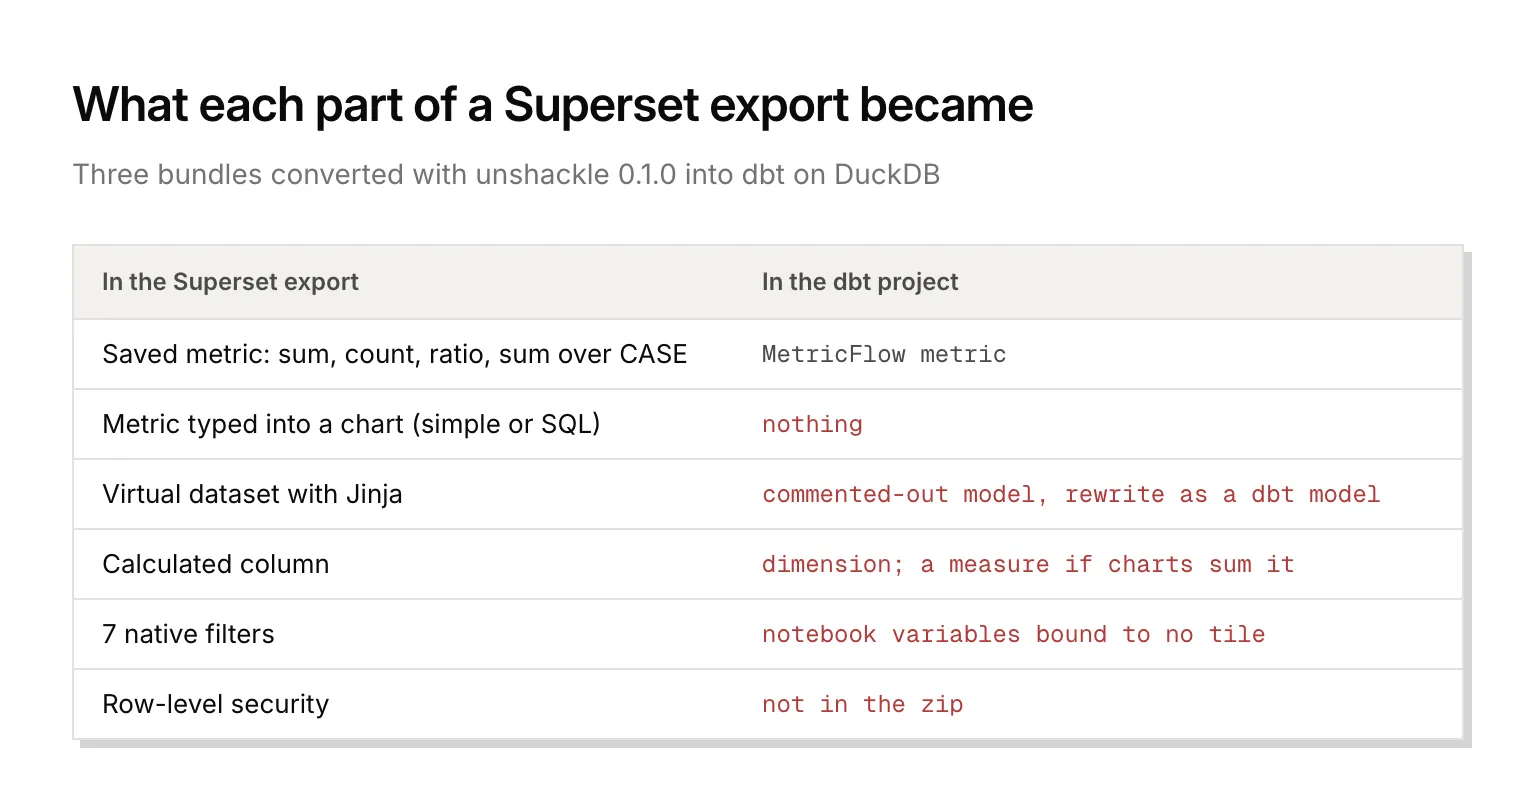
A Superset export moves your datasets and their saved metrics into dbt. It doesn't move the metrics people typed into individual charts, the Jinja in virtual datasets, dashboard filters or row-level security. Those stay behind in Superset, so clean them up there first: save each chart's metrics to its dataset, write down filters and security rules, then export.
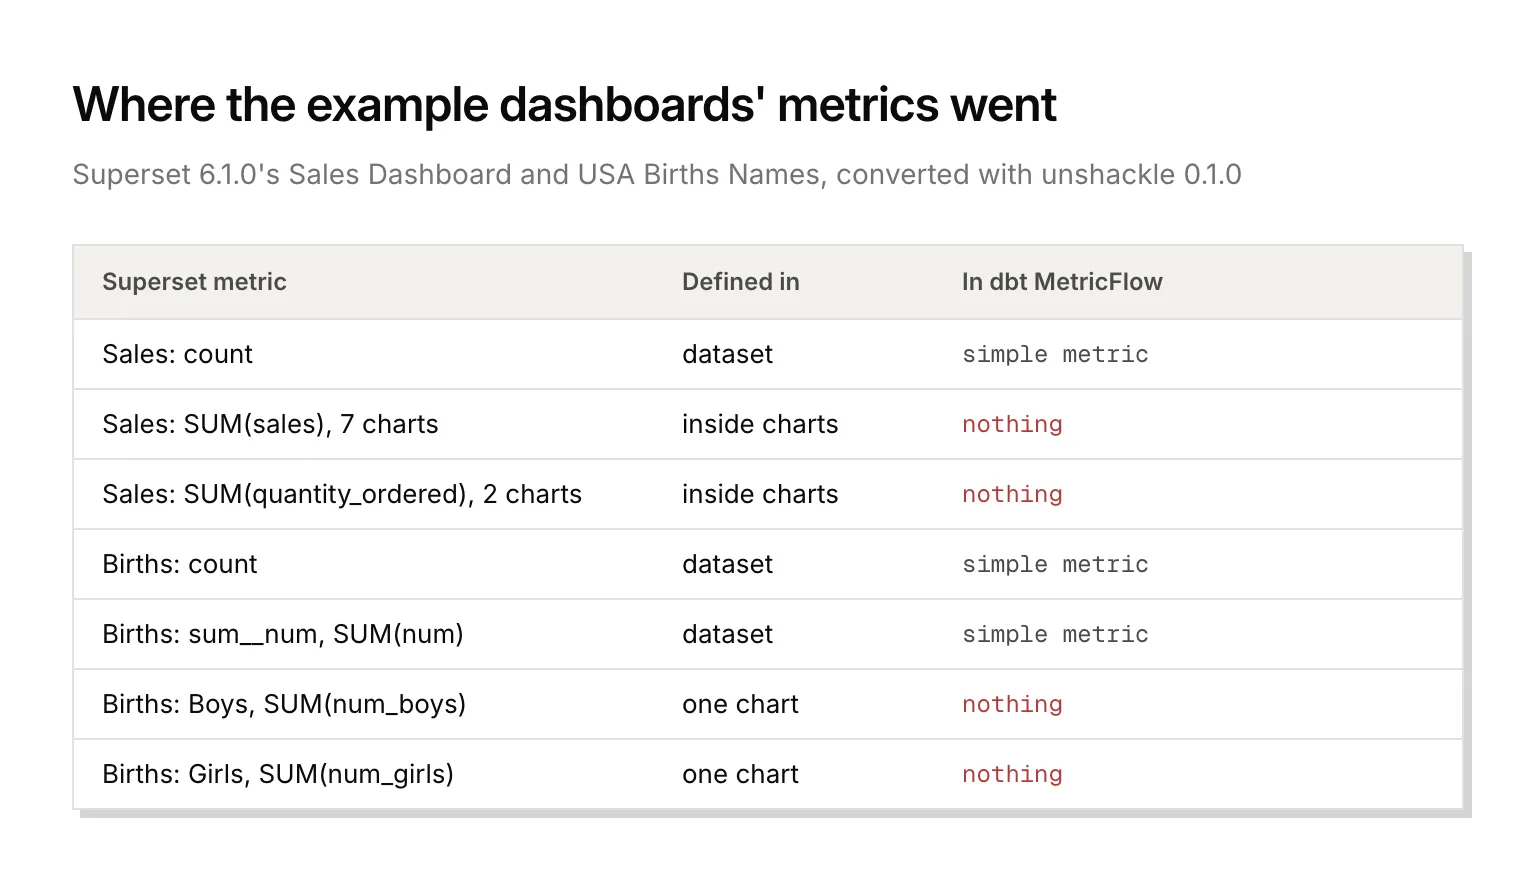
We converted Superset's own Sales Dashboard and got one dbt metric: a row count. Every sales total on that dashboard is typed into a chart, and the count is the only metric its dataset has.
What does a Superset export zip contain?
A Superset export is a zip of YAML files: one for the database connection, one per dataset, one per chart and one per dashboard, plus a metadata.yaml. You get it from the Export action on the dashboards, charts or datasets list, or from Superset's REST API (/api/v1/dashboard/export/ and its siblings). The dataset files hold the columns, the calculated columns and the saved metrics. The chart files hold each chart's settings, including any metric defined right there in the chart.
The database file carries the connection's encrypted credentials, such as service account keys, so treat the zip as a secret and keep it out of a public repo.
unshackle, the free, open-source CLI we built for moving BI tools into Git, documents what never makes it into the zip: the SQL each chart runs, how dashboard filters bind to charts, roles and row-level security, and usage. It rates its Superset support "Saved exports", meaning it's tested on exports over a fictional dataset. Our test was the same kind. We built the zips from the dashboard YAML that Superset 6.1.0 ships for its example dashboards, not from a running Superset, then converted them with unshackle 0.1.0 into a dbt project on DuckDB.
Why does the Sales Dashboard come out with one metric?
Because its totals live in the charts, and the converter reads the dataset. Superset has two places to define a metric. A saved metric lives on the dataset, like SUM(num) named sum__num. An ad hoc metric lives inside one chart: you pick a column and an aggregate, or type SQL, and it's stored in that chart's settings only. Superset's docs call the dataset layer "a thin semantic layer", and its own examples show how thin:
- Sales Dashboard: the dataset has one saved metric,
count. Seven charts sumsalesand two sumquantity_ordered, each defined inside the chart. - USA Births Names: the dataset has two saved metrics,
countandsum__num. The Boys and Girls totals (SUM(num_boys)andSUM(num_girls)) exist only inside the Genders by State chart, and three more charts redefineSUM(num)as "Births", the same number assum__numunder another name.
unshackle turned all three saved metrics into MetricFlow simple metrics, and mf validate-configs passed with no errors. None of the metrics typed into charts became a metric. They show up only as column names in the notebook that replaces the dashboard. Each dashboard left 36 TODO items, all about the notebook's tiles. Not one says a metric is missing.
Metrics written as custom SQL fail silently. We added a chart with a SQL metric, "Net revenue", to a dataset of our own. It came out as no metric and no TODO item. Its expression survives only in unshackle's intermediate JSON. unshackle marks what it reads and can't translate, and it doesn't read chart metrics into the semantic layer, so nothing flags them.
How do you get chart metrics into the export?
Find the chart metrics first. Unzip the export and search the chart files:
grep -rnE "aggregate: [A-Z]|expressionType: SQL" charts/Each aggregate: line is a metric defined inside a chart, a column and an aggregate. expressionType: SQL marks typed SQL. Then, for each one that matters:
- Save it to the dataset as a saved metric, with the name your team uses.
- Switch the charts that use it to the saved metric. Saving it doesn't change those charts.
- Watch for duplicates, like "Births" and
sum__num: keep one.
Then export again, and check that the new zip's dataset file lists each metric before you convert. We didn't run that second export in our test.
We'd do this in Superset rather than write the metrics in dbt afterwards. In Superset you can open the chart and see what the number is for, and your dashboards keep working on one definition while the migration runs. The other route works too. We wrote Boys and Girls by hand in dbt, two measures and two simple metrics, 16 lines of YAML, and mf query matched our hand count for every year and state. That's fine for two metrics and slow for two hundred.
Should a calculated column become a dimension or a measure?
Look at what the charts do with it. The Births dataset has a calculated column, num_california: CASE WHEN state = 'CA' THEN num ELSE 0 END. unshackle made it a categorical dimension. Group a metric by it and you get one group per value, 0 for every row outside California plus one group per California row, which nobody wants.
If charts sum it, it's a measure in MetricFlow:
measures:
  - name: num_california
    agg: sum
    expr: CASE WHEN state = 'CA' THEN num ELSE 0 END
Add a simple metric on that measure, and keep the column as a dimension only if people filter or group by it.
What happens to a virtual dataset that uses Jinja?
The whole semantic model comes out commented out. We wrote a small virtual dataset of our own in Superset's export format, with WHERE region IN {{ filter_values('region')|where_in }} in its SQL, a ratio metric (revenue per order) and a SUM(CASE ...) metric for completed revenue. unshackle kept the SQL in a separate file with the Jinja unrendered and left the model behind a TODO: "virtual dataset SQL uses Jinja templating; render it for the migrated model".
The fix is a plain dbt model. filter_values only has a value when a Superset dashboard filter supplies one, so take the WHERE out of the model and filter on region when you query. Once we did that and uncommented the model, the metrics underneath were right. The ratio came out as a numerator, a denominator and a type: ratio metric, and completed revenue as a sum over the CASE expression. mf validate-configs passed, and revenue per order read 83.33 for January and 113.33 for February, the same as dividing by hand.
Where do dashboard filters and row-level security go?
Dashboards become Jupyter notebooks, not dbt. The Sales Dashboard's seven native filters (Country, State, Postal Code, Order Quantity, MSRP, Time Range and Time Grain) came out as seven notebook variables set to nothing, attached to no tile. You write each tile's SQL yourself and wire the filters into it.
Row-level security lives in Superset's Security menu, attached to datasets and roles. List every rule before you switch Superset off and rebuild each one as a policy in your warehouse, so it applies whatever tool runs the query. Rules that use Jinja, such as {{ current_username() }}, need a warehouse function that does the same job. Through Superset's API, unshackle reads row-level security too and writes each rule as a row filter in policies/, a starting point for that rebuild.
How do you check the migrated numbers against Superset?
Run each number both ways and compare: mf query on the dbt side, the same chart in Superset on the other. Start with the charts people quote in meetings. MetricFlow needs a time spine and a clean dbt parse before mf runs (the ThoughtSpot guide walks through both). unshackle verify automates the comparison against Superset's chart data API when you have access to the running instance.
Once the numbers match, Querio reads the metrics as they are, from dbt's semantic_manifest.json, and keeps no second copy. Querio's agent, Claude or any agent connected through our MCP server asks for revenue per order by name. On Snowflake, BigQuery and Databricks the query runs as the signed-in person, so the row-level rules you rebuilt in the warehouse hold for every answer. The MCP server is on every plan, Free included. The metrics stay plain dbt YAML, too: the dbt Semantic Layer serves them on a paid dbt plan, and Superset can connect to it behind its experimental SEMANTIC_LAYERS flag. Moving more than Superset? We also wrote up LookML to MetricFlow and Metabase to dbt.
FAQ
Can Superset dashboards keep running during the move?
Yes. Exporting only reads, and the dbt models you build are new tables, so Superset keeps querying what it queried before. Point a chart at a dbt model when its numbers match, one dataset at a time.
Do Superset's example dashboards work as a practice run?
Yes. Between them they have saved metrics, chart metrics, a calculated column and seven native filters: most of what this page covers, on data nobody will miss if you break it.