Business Intelligence
Customer-facing dashboards with NLQ
Let customers query live warehouse data in plain English with governed NLQ dashboards for faster, secure, and consistent business insights.
Customer-facing dashboards with Natural Language Query (NLQ) simplify how users interact with data. Instead of navigating complex filters or pre-built reports, users can type plain-English questions like "What were my sales last month?" and get instant, clear answers. This approach makes data accessible to everyone, even those without technical expertise.
Key takeaways:
Dashboards embedded in apps let customers explore their own data with user-friendly visualizations.
NLQ removes barriers by translating questions into SQL and delivering insights in seconds.
Businesses using embedded analytics report 2.3× higher retention rates.
Tools like Querio integrate with live data warehouses (e.g., Snowflake, BigQuery) and ensure governed, secure access.
Querio helps businesses:
Connect live data securely.
Build a semantic layer for consistent metrics and definitions.
With NLQ, decision-making becomes faster, reducing hours of work to seconds. It democratizes data access, empowering everyone from executives to front-line staff to make informed decisions.
Benefits of NLQ for Non-Technical End-Users
NLQ’s straightforward design brings powerful advantages to users without technical expertise.
Ease of Use for Non-Technical Users
A common hurdle in data analytics is the technical knowledge required to generate insights. Natural language data querying tools eliminate this barrier entirely. Teams in marketing or sales can ask simple questions like, "What were last month's sales?" or "Which customers spent over $10,000 this quarter?" without needing to learn SQL or complex tools. The system translates plain language into precise, optimized queries, delivering accurate visualized results.
This simplicity significantly reduces errors caused by manual query writing or spreadsheet filtering. Users no longer need to memorize column names, understand table relationships, or worry about syntax. The AI handles all the technical heavy lifting, allowing users to focus on interpreting the data and applying it to their business goals.
Faster Decision-Making
Speed is critical when responding to shifting markets or evolving customer behavior. NLQ drastically cuts the time between asking a question and receiving actionable insights, reducing what might take hours - or even days - to mere seconds. Instead of waiting for reports, users get immediate answers, evolving from static dashboards to dialogue for real-time decision-making without manual SQL.
According to Gartner, 85% of customer service leaders plan to pilot conversational AI by 2025, recognizing how quick access to insights improves customer satisfaction and operational efficiency. When every team member can instantly query data, businesses become more agile and better equipped to respond to opportunities or challenges as they arise.
Increased Data Accessibility
Traditional analytics tools often limit access to a select group of experts, leaving most employees on the sidelines. NLQ changes this by putting data exploration into the hands of everyone. Currently, fewer than 20% of companies effectively leverage their unstructured data, and 83% of employees feel uncertain about using analytics tools. NLQ bridges this gap, making data accessible to all - from the executive suite to front-line staff.
"NLQ addresses this challenge by democratizing data access across organizations. It empowers non-technical users, from marketing managers to C-suite executives, to extract valuable insights without relying on IT departments or data scientists." - AtScale
When data is accessible to everyone, it unlocks hidden insights. Teams no longer need to wait for analysts to become available; instead, they can explore data independently, uncovering trends and opportunities that drive better decisions across every department.
Setting Up Querio Dashboards with NLQ
Getting started with Querio is a simple process that can reshape how your customers interact with data. With just three steps, you can lay the groundwork for providing governed, real-time insights. Querio takes care of the technical details, allowing you to focus on delivering meaningful results to your users.
Connecting to Live Data Sources
Querio integrates directly with your existing data warehouse, whether you use Snowflake, BigQuery, or Postgres. Setup is quick - just provide encrypted, read-only credentials, ensuring secure access to live, up-to-date data. This setup keeps your data safe from unintended changes while giving customers access to the latest information.
This streamlined connection delivers real-world benefits. For instance, in 2024, Lumen reduced its sales summary process from 4 hours to just 15 minutes per seller - a time savings of 93.75%. Similarly, a financial services firm saved $45,000 annually by enabling non-technical teams to perform their own data analysis, cutting down on requests to technical staff. Adding more database connections costs $4,000 per year, making it easy to scale as your data needs grow.
Building and Governing the Semantic Layer
After connecting your data, the next step is to add context through a semantic layer for SaaS. This layer serves as the "brain" behind accurate NLQ responses. Your data team defines key business logic, metrics and semantic layers, and table relationships once, and Querio ensures this context is applied consistently across all queries and dashboards. For example, when someone asks about "active users", they’ll always get the same definition, no matter the department.
"Centralized Context Layer: I see this as the 'brain' that ensures enterprise-grade governance. It allows data teams to define business logic, metrics (e.g., a consistent definition of an 'Active User'), and table relationships once. This context is then applied to all AI-generated answers, ensuring consistency and accuracy across the entire organization. It's a crucial feature that bridges the gap between user-friendly AI and reliable, governed data." - Skywork
Spending time upfront to configure this layer is worth it. The AI translates plain-language questions into optimized SQL queries that run directly on your warehouse, ensuring accurate results based on clearly established business rules.
Customizing Dashboards for End-User Needs
Querio’s dashboard builder allows you to create tailored experiences for different customer groups. You can design role-specific dashboards, set predefined filters, and configure user-specific views to highlight the metrics that matter most to each audience. The drag-and-drop interface makes it easy to arrange charts, adjust time frames, and set alert thresholds based on individual preferences.
This adaptability ensures that each team gets exactly what they need. For example, one team might use a dashboard focused on product analytics, while another relies on a layout centered on financial performance. Despite the differences, all dashboards pull from the same governed data, ensuring consistency and reliability. Customers benefit from dashboards designed to fit their workflows and decision-making processes.
Best Practices for Designing NLQ Dashboards
Creating effective NLQ dashboards requires careful planning to bridge the gap between how users naturally phrase their questions and how the system interprets them. The goal is to align the dashboard's design with natural language, delivering clear and immediate answers. Here are some key strategies to enhance your NLQ dashboard for better user engagement.
Defining Business Lexicon and Synonyms
While Natural language data querying tools are built to understand everyday English, they won't automatically recognize your organization's specific terminology. That's where your data team steps in. They need to configure the system with your company's unique terms. For example, one sales team frequently referred to their Sales Amortized Revenue field as "adrr" in conversations. By adding "adrr" as a synonym in the NLQ system, they drastically cut down the time spent preparing for monthly reviews, as the system instantly understood their intent.
To replicate this, map commonly used business terms and their synonyms to the relevant data fields. If your team uses terms like "gross sales" or shorthand like "adrr", include those as synonyms. The same applies to data values - if "Freshmen" are often called "First Years", make sure the system can recognize both terms interchangeably. For technical names, use clear aliases; for instance, rename "CustID" to "Customer ID" and add synonyms like "Customer Number."
Avoid using generic terms like "Average" or "Total" for field names, as top NLQ systems like Querio can calculate these automatically. Instead, assign distinct, descriptive names to attributes and set default aggregations for measures - like "Average" for test scores or "Distinct Count" for unique customers - to maintain consistency.
Implementing Named Filters and Entities
Once you've refined your terminology, the next step is to simplify data filtering with named filters and entities. Named filters link natural language phrases to specific conditions. For example, you could define "Failing" as test scores below 70% or use "undergrads" to encompass Freshmen, Sophomores, and Juniors. These filters make it easy for users to request tailored data sets.
Named entities, on the other hand, group related fields that users often need together. A university dashboard might offer a "Student Information" entity that bundles fields like name, major, email, and test scores. So, when someone asks for "student information for failing biology majors", the system delivers a filtered table with all relevant details. Users can then refine the results further by adding or removing columns as needed.
This method has proven effective. According to the 2025 State of Search and AI Analytics Report, dashboards with integrated NLQ features saw a 2.3× increase in adoption.
Testing and Iterating on NLQ Experiences
The success of your NLQ dashboard hinges on continuous improvement. Start small by focusing on a narrow use case with only essential fields, then expand gradually. Use Querio's usage data to monitor adoption and pinpoint queries the system struggles to handle. Conduct one-on-one sessions with both advanced users and those encountering difficulties to uncover additional terminology or features that need to be addressed.
Create a feedback loop by involving end users in the design and testing process, and ensure they know who to contact if they face issues. This iterative approach, based on real user behavior, will help your NLQ dashboard become increasingly intuitive and valuable over time.
Standard Dashboards vs. NLQ-Powered Dashboards in Querio
Standard Dashboards vs NLQ-Powered Dashboards Feature Comparison
Choosing between standard dashboards and Querio's NLQ-powered dashboards can significantly influence how users interact with and access data. Standard dashboards often require users to be trained in navigating visualizations and applying filters effectively. In contrast, Querio's NLQ-powered dashboards simplify the process by enabling users to ask plain-English questions and receive instant insights from live data directly.
Take Mercury Data, for example. In August 2025, they adopted Querio to solve challenges related to accessing and analyzing complex raw data. This switch to NLQ-powered dashboards removed the delays caused by relying on data teams for custom reports. Now, their customer-facing teams can pull insights whenever they need them, without waiting.
Comparison of Features and Benefits
Here’s a side-by-side look at how Querio's NLQ-powered dashboards stack up against standard dashboards in key areas:
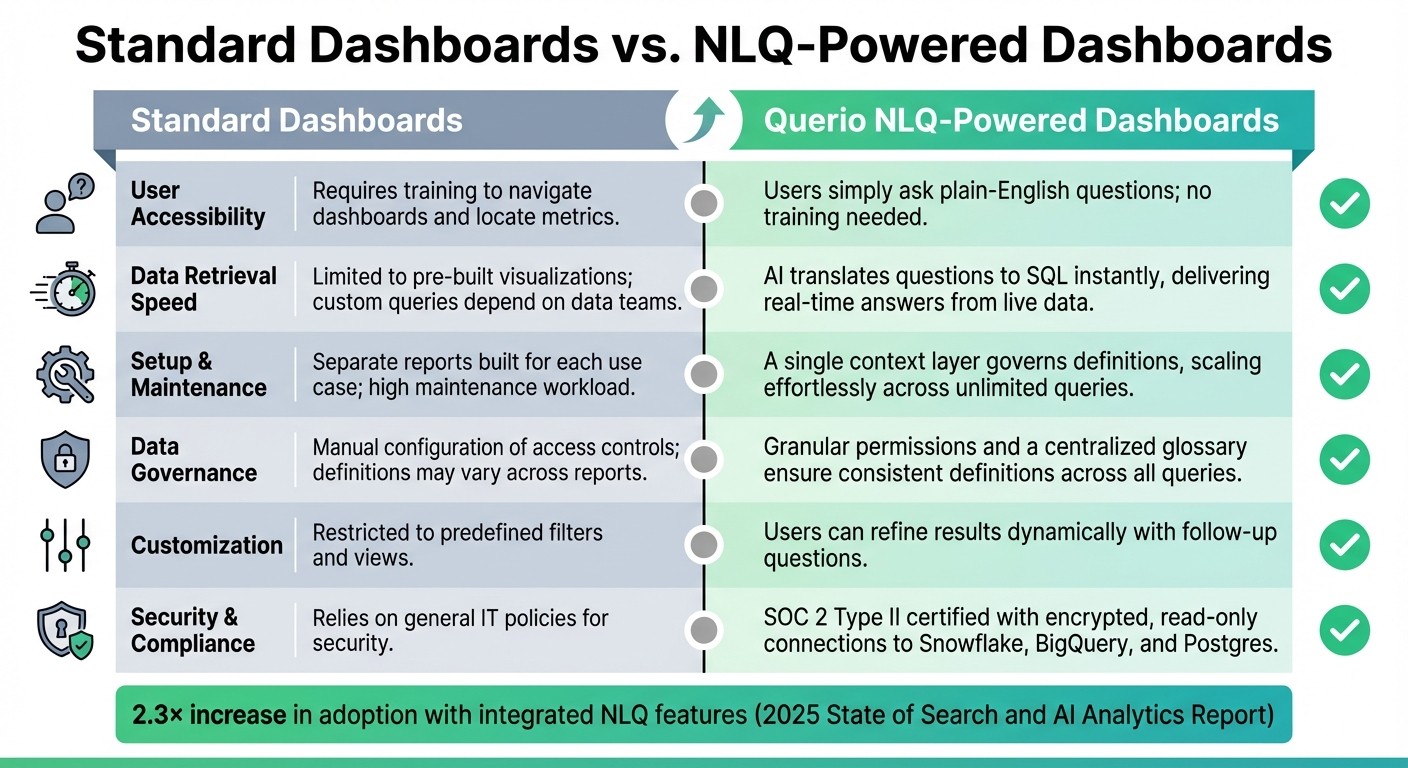
Feature | Standard Dashboards | Querio NLQ-Powered Dashboards |
|---|---|---|
User Accessibility | Requires training to navigate dashboards and locate metrics | Users simply ask plain-English questions; no training needed |
Data Retrieval Speed | Limited to pre-built visualizations; custom queries depend on data teams | AI translates questions to SQL instantly, delivering real-time answers from live data |
Setup & Maintenance | Separate reports built for each use case; high maintenance workload | A single context layer governs definitions, scaling effortlessly across unlimited queries |
Data Governance | Manual configuration of access controls; definitions may vary across reports | Granular permissions and a centralized glossary ensure consistent definitions across all queries |
Customization | Restricted to predefined filters and views | Users can refine results dynamically with follow-up questions |
Security & Compliance | Relies on general IT policies for security | SOC 2 Type II certified with encrypted, read-only connections to Snowflake, BigQuery, and Postgres |
This table highlights how Querio's NLQ-powered dashboards transform data interaction, making governance seamless and fostering better user engagement.
A key advantage of Querio's approach lies in its centralized semantic layer. This feature ensures consistent definitions across the board, addressing a common issue with standard dashboards. For instance, terms like "revenue" or "active customers" can carry different meanings depending on the user or report in traditional setups. Querio eliminates this confusion by maintaining a single source of truth, so everyone gets consistent, accurate results - no matter who’s asking the questions.
Conclusion
Querio’s NLQ-powered dashboards make it easier than ever to interact with live warehouse data. Instead of wrestling with complex visualizations or relying on data teams, users can ask straightforward questions in plain English and get immediate, accurate answers. This simplicity addresses a major hurdle - 33% of users shy away from dashboards due to usability challenges.
The boost in decision-making speed is undeniable. While traditional analytics might take hours or even days to provide insights, Querio delivers real-time answers. Sales managers, operations leads, and finance teams can dive into data on their own, making well-informed decisions without needing IT support or advanced skills in SQL or Python. This shift not only saves time but also supports independent data exploration across all teams.
Querio also ensures accuracy and security with its centralized semantic layer. By offering SOC 2 Type II compliance and secure, read-only connections to platforms like Snowflake, BigQuery, and Postgres, organizations can expand data access without sacrificing governance or security.
Beyond answering direct questions, Querio’s AI-driven capabilities surface insights users might not even think to ask. This helps teams uncover risks and opportunities early, enabling proactive decision-making. With unlimited viewer licenses and an implementation process that takes only a few hours, Querio makes enterprise-level business intelligence both accessible and cost-effective.
For businesses ready to move beyond static dashboards, Querio offers the speed, ease of use, and security needed to turn data into a true competitive advantage.
FAQs
How does Natural Language Query (NLQ) make data easier to access for non-technical users?
Natural Language Query (NLQ) takes the complexity out of data access by letting users ask questions in simple, everyday language. There's no need to master intricate query languages or depend on technical experts. This approach makes it easier for anyone to interact with data and uncover insights without delay.
With NLQ, even non-technical users can explore dashboards effortlessly. For example, they can ask questions like, "What were the sales in California last month?" or "How many customers signed up this week?" and get clear, actionable answers instantly. This means faster decisions and smarter strategies for everyone, no matter their technical skills.
What makes Querio's NLQ-powered dashboards better for non-technical users?
Querio's NLQ-powered dashboards make data analysis a breeze by letting users ask questions in plain language - no complicated queries or technical know-how required. This approach cuts down on steps and delivers insights faster, putting the information you need right at your fingertips.
Thanks to its conversational and easy-to-use interface, even those without a technical background can dive into data with ease. The result? Quicker decisions made with confidence. It's a modern, user-centric take on business intelligence.
How does Querio protect data and ensure compliance when connecting to live data sources?
Querio takes data security seriously, aligning itself with enterprise data governance frameworks like Unity Catalog. By incorporating semantic intelligence, it provides insights that are not only context-aware but also governed, ensuring every interaction with data is supported by metadata.
Connections to live data sources are protected to comply with organizational security policies, with strict controls over access to sensitive information. This careful approach allows users to explore data safely and efficiently while staying within the boundaries of data governance standards.
Related Blog Posts


