Guide
What Is User Behavior Analytics: Drive Growth in 2026
Discover what is user behavior analytics and how it drives growth in 2026. This comprehensive guide covers UBA mechanisms, key metrics, use cases, &
Your dashboard says signups are stable, activation dipped, and churn might be creeping up. Product says onboarding feels clunky. Growth says traffic quality changed. Engineering says nothing obvious broke. Everyone has data, but nobody can say with confidence why users are behaving differently.
That's the point where many teams start confusing measurement with understanding. They have pageviews, DAU, feature counts, and a few conversion charts. What they don't have is a usable explanation of user intent, friction, and momentum across the customer journey. If you're asking what is user behavior analytics, the practical answer is simple: it's the discipline of turning raw interaction data into decisions about product, growth, and customer experience.
In a modern data stack, that discipline matters even more. Behavioral data no longer lives only inside a product analytics tool. It sits alongside billing, CRM, support, and marketing data in the warehouse. That changes the scope of what you can learn, and who can act on it.
Table of Contents
- The Gap Between Data and Decisions
- How User Behavior Analytics Actually Works
- Driving Growth with Practical UBA Use Cases
- Essential Metrics and Example Analyses
- A Framework for Implementing User Behavior Analytics
- The Modern Warehouse-First UBA Strategy
The Gap Between Data and Decisions
A common failure mode looks like this. A team tracks everything they can think of, then opens a dashboard during a weekly review and argues over interpretation. One person sees a conversion problem. Another sees a traffic problem. A third sees a design issue. All three are reacting to the same chart.
That gap exists because most dashboards answer what happened, not why it happened. A drop in completion rate tells you an outcome changed. It doesn't tell you whether users got confused, hit an error, lost trust, found a workaround, or never intended to complete the task in the first place.
User behavior analytics sits in that gap. It's the practice of collecting and analyzing user actions in enough context that teams can infer motivation, friction, and likely next steps. That means looking beyond totals and averages. You need event sequences, paths, cohorts, and the surrounding business context.
Behavior without context is just noise
A pageview spike can mean interest, but it can also mean users are stuck and refreshing. A long session can mean engagement, or it can mean someone is lost. Even a feature click can be misleading if you don't know whether the user adopted the feature, abandoned it, or came back later through support.
That's why good UBA blends product telemetry with other operational signals. In practice, teams often need to connect usage events with CRM stages, billing records, support tickets, and acquisition source. That broader view is one reason warehouse-native analytics is becoming so important.
For teams collecting behavioral data from the open web, there's also a practical instrumentation issue. If your input data is distorted by blocking, rate limits, or bot defenses, your downstream analysis gets shaky fast. When that's part of your workflow, a technical guide on how to handle anti-bot systems is useful because it helps you think about data quality before you ever analyze behavior.
Practical rule: If a metric changes and nobody can explain the user action behind it, you don't have insight yet.
A lot of teams also underestimate the operational drag created by fragmented analytics. Product pulls one view from an event tool, finance has another in the warehouse, and leadership gets a slide deck stitched together by hand. The result is delay and rework. A more useful operating model is outlined in this piece on moving from data to decisions with AI analytics, which identifies the core issue: decision speed depends on how easily teams can interrogate shared data.
How User Behavior Analytics Actually Works
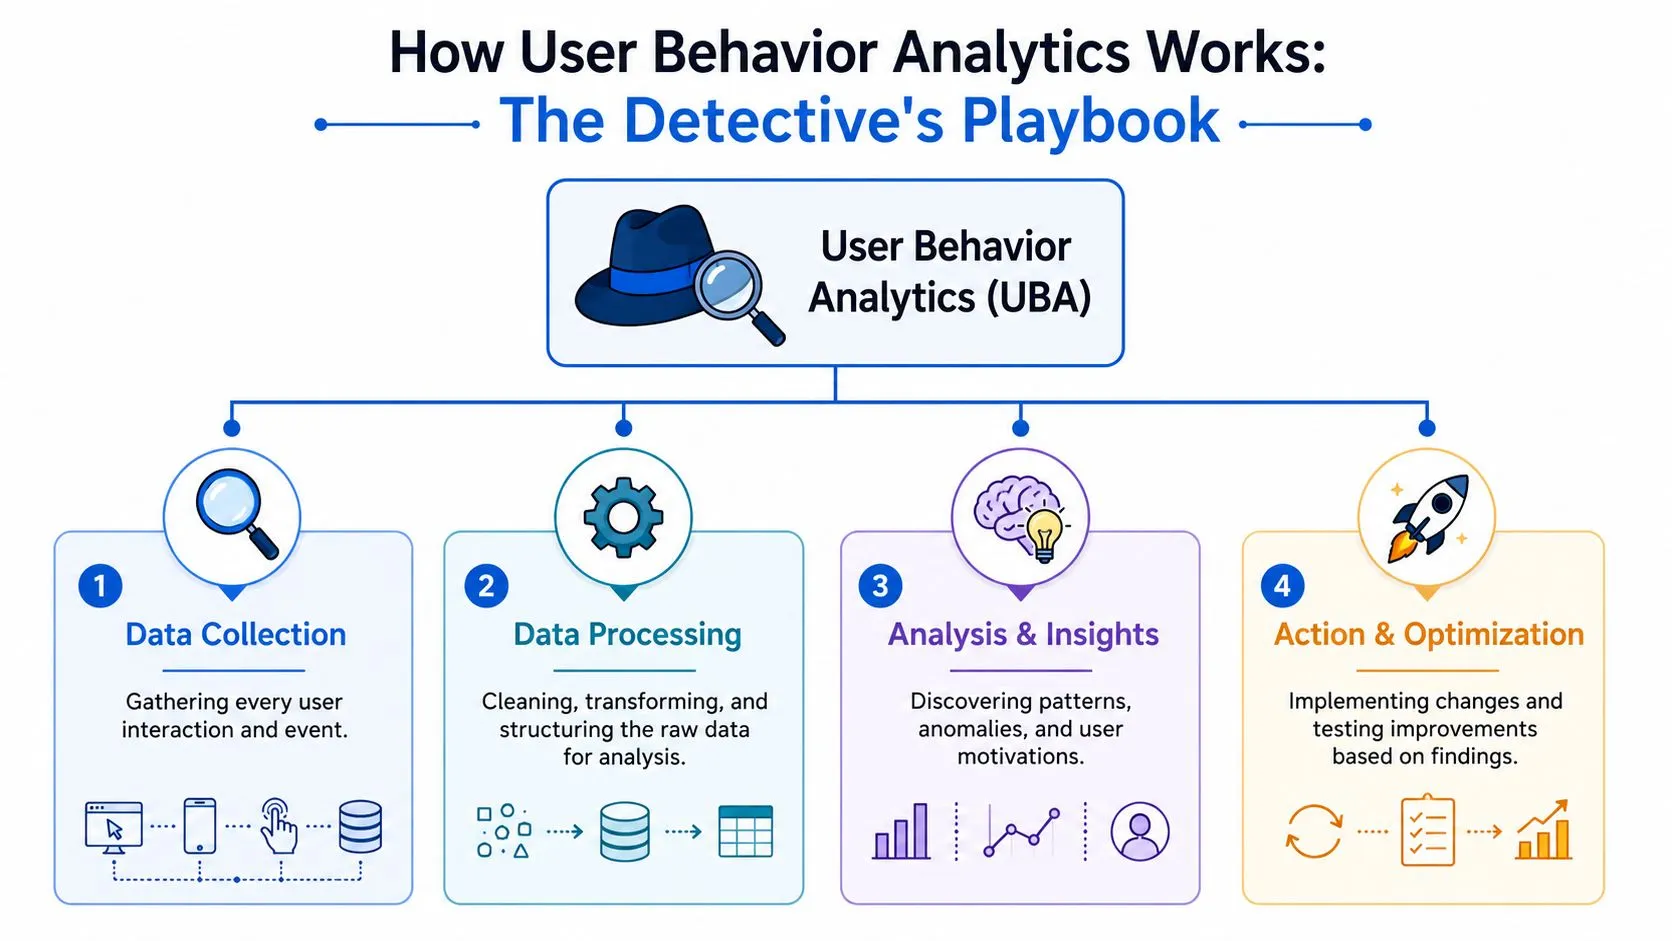
The easiest way to understand UBA is to think like a detective. You don't solve a case by staring at one clue. You gather evidence, sort signal from noise, reconstruct the sequence, and test the most likely explanation against the facts.
Start with the clues
Behavioral data usually enters the stack from several places at once:
- Client-side events record what users do in the interface, such as clicking a button, opening a modal, or submitting a form.
- Server-side events capture actions that matter even when the browser can't be trusted, like account creation, payment status changes, or job completion.
- Application logs show the operational side of a user journey, including failures, retries, or latency-related drop-off.
- Business systems add meaning. CRM tells you deal stage, billing tells you plan status, and support data shows where confusion surfaced.
In dedicated analytics tools, these streams often land in separate schemas with opinionated limits. In a warehouse-native setup, you can keep them close together and define your own event model.
Then decide which signals matter
Collecting more events doesn't automatically create better analytics. You need to decide which behaviors are meaningful for the business. The right signals usually have three traits. They correspond to a user goal, they map to a stage in the journey, and they can trigger an action from a team.
A useful signal set might include:
- Intent signals like pricing page views, workspace creation, or repeated use of a core feature.
- Friction signals such as form abandonment, repeated invalid input, support contact after a failed action, or rage clicks.
- Value signals like inviting teammates, integrating another system, or returning to a workflow without prompting.
- Risk signals including lower usage from previously active accounts, repeated failed jobs, or a sharp change in feature mix.
When teams want inspiration for pattern recognition, even outside product analytics, I sometimes point them to resources like BeyondComments' video analyzer. It's not a UBA tool, but it's a good reminder that behavior analysis always starts with observable actions, then moves toward interpretation.
Analysis connects actions to intent
Most UBA work falls into a handful of analytical methods:
- Funnel analysis asks where users drop out of a defined sequence.
- Path analysis asks what routes users take, not the routes designers expected.
- Cohort analysis compares behavior across groups that started at different times or came from different channels.
- Segmentation breaks users apart by plan, persona, acquisition source, lifecycle stage, or behavior pattern.
- Anomaly detection looks for unusual shifts worth investigating.
There's no single perfect method. Funnels are great for known processes. Paths are better when users wander. Cohorts help when product changes need time to show their effect.
The strongest analyses usually combine methods. A funnel tells you where the leak is. A path view shows how users got there. A cohort view tells you whether the problem is new or chronic.
Clustering can also help when behavior patterns are complex and your personas are too broad. If your team is exploring unsupervised grouping of usage patterns, this overview of clustering algorithms for analytics workflows is a practical bridge between data science concepts and product use cases.
Interpretation turns patterns into decisions
Many teams stumble at this point. They identify a pattern, then immediately jump to a fix. Patterns, however, do not speak for themselves. It is crucial to determine if the observed behavior reflects confusion, lack of relevance, poor onboarding, technical failure, or a different user job to be done.
A good interpretation process usually includes:
- Compare segments to see whether the issue is broad or isolated.
- Check timing around releases, campaigns, pricing changes, and support spikes.
- Validate with qualitative input from tickets, calls, or session review.
- Translate into action that a product, design, lifecycle, or sales team can own.
That's what user behavior analytics is in practice. Not just event collection. Not just dashboards. It's a disciplined way to build a believable case about what users are trying to do, where they get blocked, and what the business should change next.
Driving Growth with Practical UBA Use Cases
The value of UBA shows up when teams stop debating metrics in the abstract and start changing actual journeys. Product and growth teams use the same behavioral data differently, but they're both trying to answer one question: what should we change next to improve an important outcome?
There's a business case for doing this well. Companies that extensively use user behavior analytics report outperforming their peers with 85% more sales growth and more than 25% greater gross margin, according to McKinsey's article on unlocking the power of customer insights.
Product teams use UBA to reduce friction
The first high-value use case is onboarding. A PM might see that new users create an account but don't reach their first meaningful action. Traditional analytics can show the drop-off. UBA helps isolate the cause.
Maybe users who skip one setup step almost never activate. Maybe people who invite a teammate early tend to stick, while solo users stall. Maybe a required field creates confusion because the label is too internal. These are different product problems, and they require different interventions.
Another strong use case is feature validation. Teams often ship functionality, then measure adoption at the surface level. That misses the important distinction between a feature being tried and a feature becoming part of real usage. UBA looks at repeat usage, downstream actions, and whether engaged users move deeper into the product.
Usability work also gets sharper with behavioral evidence. If people loop between two screens, trigger support messages after a specific action, or abandon a workflow after encountering an error state, you have concrete direction for product and design. You're not relying on opinion or the loudest stakeholder.
Growth teams use UBA to improve conversion and retention
Growth teams usually start with funnel optimization, but the best work goes beyond headline conversion rates. They examine where users hesitate, which segments convert differently, and what pre-conversion behaviors correlate with stronger retention later.
A simple example is lead qualification. Two acquisition channels can deliver similar signup volume while producing very different in-product behavior. If one cohort explores the product but never reaches value, and another reaches core usage quickly, growth should change messaging, targeting, or handoff criteria. Volume alone won't tell you that.
Churn prevention also becomes more practical when you watch for behavioral drift instead of waiting for cancellations. Accounts often show warning signs before they leave. They may stop using a key workflow, reduce breadth of usage, or switch from proactive engagement to support-heavy behavior. Those signals let customer success or lifecycle marketing intervene while the account is still recoverable.
- Onboarding optimization focuses on first value and early friction.
- Feature validation separates curiosity from durable adoption.
- Funnel improvement shows where intent breaks down.
- Retention work identifies behavior that signals health or risk.
Good UBA doesn't produce a prettier dashboard. It gives teams a reason to act.
For lean growth organizations, the main bottleneck is often analyst capacity rather than lack of ideas. That's why self-serve workflows matter. This article on how growth teams at SaaS startups use AI BI to run experiments without analytics support gets at a real operational issue: experimentation slows down when every behavioral question has to queue behind reporting requests.
Essential Metrics and Example Analyses
A useful UBA program tracks metrics that reflect movement through the product, not just traffic volume. That doesn't mean vanity metrics are useless. It means they're incomplete on their own.
Key User Behavior Analytics KPIs
| Metric | What It Measures | Business Question It Answers |
|---|---|---|
| Activation event completion | Whether a new user reaches a meaningful first outcome | Are new users getting value quickly enough to stay? |
| Time to value | How long it takes users to reach first meaningful success | Is onboarding helping users progress or slowing them down? |
| Feature adoption rate | Whether a feature becomes part of normal behavior | Did we build something users actually incorporate into their workflow? |
| Repeat usage frequency | How often users return to key actions | Is this behavior habitual or one-time curiosity? |
| Session depth | How far users progress within a session | Are users moving through important workflows or bouncing around? |
| Error encounter rate | How often users hit failures or invalid states | Is technical or UX friction blocking progress? |
| Conversion rate by cohort | Outcome differences across grouped users | Which channels, plans, or join periods produce better users? |
| Retention by cohort | Ongoing return behavior over time | Are product changes improving stickiness for new groups of users? |
A mature team doesn't track all of these with equal weight. They pick the few that reflect their product's real value path. For a collaboration tool, that might be workspace creation followed by teammate invitation and repeat project activity. For a B2B SaaS platform, it may be integration setup, report creation, and recurring use by multiple roles.
If you're refining the KPI layer itself, this guide to user engagement metrics that matter is a useful companion because it helps separate shallow activity from meaningful product health.
Example analysis for a signup funnel
Suppose your signup flow has four stages: account created, email verified, workspace created, first core action completed.
At a high level, the analysis logic is straightforward:
- Define one event for each step.
- Assign each event to a user and timestamp.
- Keep only users whose events occur in the right order.
- Count how many users reach each stage.
- Break results out by segment such as acquisition source, plan, or device type.
Pseudo-SQL logic might look like this in plain English:
- Build a table of users who created accounts.
- Left join later events for verification, workspace creation, and first core action.
- Mark the earliest timestamp for each step.
- Filter out impossible sequences where later steps happen before earlier ones.
- Aggregate counts by cohort.
That analysis answers two different questions. First, where is the largest drop-off? Second, which user groups suffer that drop-off most heavily? Those are the questions that lead to action.
Example analysis for cohort retention
Retention becomes clearer when you group users by start period and compare their behavior over time. The point isn't to build a pretty heatmap. The point is to see whether newer cohorts are becoming healthier after product changes, onboarding updates, or messaging shifts.
A practical workflow looks like this:
- Create the cohort definition based on the user's first seen date or first activation date.
- Choose the return event that represents meaningful usage, not casual visits.
- Measure return windows in consistent periods, such as weekly or monthly.
- Compare cohorts side by side to see whether later groups are retaining better, worse, or differently.
Watch out: Retention analyses break down when the “return” event is too shallow. Logging in is often less useful than completing a core workflow.
The strongest retention work also joins behavioral and business context. A return from a paid account means something different from a return from a trial user. That's another reason warehouse-based analysis tends to outperform isolated product analytics views.
A Framework for Implementing User Behavior Analytics
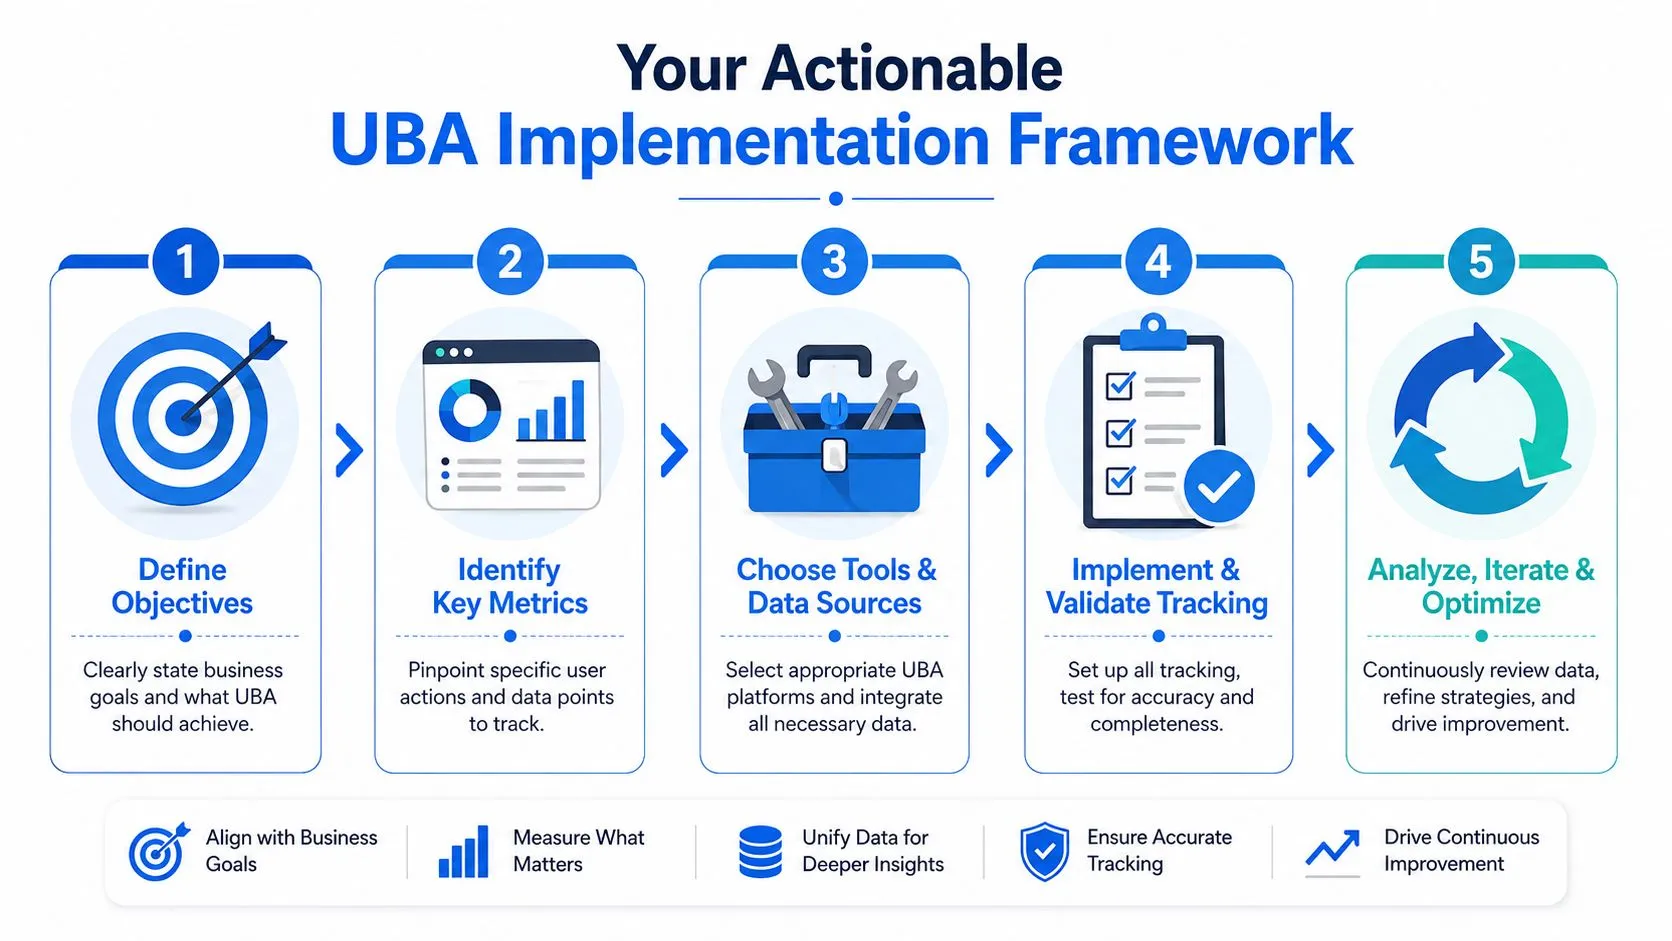
Most UBA failures aren't caused by weak tools. They're caused by weak setup. Teams instrument too much, name events inconsistently, ignore identity stitching, and discover too late that basic questions are hard to answer.
Start with the tracking plan
Before anyone writes code, define the business decisions the data needs to support. Then work backward into events, properties, and entity definitions.
A solid tracking plan usually answers:
- What counts as a user when people can be anonymous, invited, or merged later?
- What counts as an account or workspace if multiple users belong to one customer?
- Which events are milestones versus low-value noise?
- Which properties are required on every important event, such as plan type, source, role, or experiment assignment?
Consistency matters more than cleverness. Event names should be stable, readable, and tied to business meaning. “workspace_created” ages well. “clicked_blue_button_v2” does not.
Model for analysis, not just collection
Raw events are rarely enough. Analysts and PMs need a model they can query without reconstructing the business every time.
In practice, that often means creating:
- A clean events table with standardized timestamps, event names, and properties.
- User dimension tables with lifecycle fields, acquisition source, and account relationships.
- Account or workspace tables so B2B analysis doesn't collapse into user-only views.
- Derived models for activation, feature adoption, retention, and health signals.
Warehouse-native teams have an edge. They can model once and reuse the logic across dashboards, notebooks, AI workflows, and reverse ETL actions instead of re-implementing the same definitions inside several tools.
Privacy is part of the implementation
Behavioral analytics can become invasive fast if teams capture everything because they can. That's a mistake, both ethically and operationally.
Keep a few rules in place:
- Collect with intent and avoid sensitive fields you don't need.
- Mask or hash identifiers where full values aren't required for analysis.
- Define access by role so broad event access doesn't automatically expose private business context.
- Document retention policies and deletion workflows for regulated environments.
Privacy and usefulness aren't opposites. A disciplined event model usually improves both.
Teams get into trouble when they treat privacy review as a legal checkpoint instead of a data design decision.
Pick tools that fit your operating model
A dedicated product analytics tool can be enough for early instrumentation and quick visualizations. That's especially true when one team owns the questions and the data model is simple.
But complexity arrives quickly. You'll want product events joined to support outcomes, sales context, contract state, or usage-based billing. At that point, a fragmented toolchain starts to create duplicate definitions and conflicting numbers. The implementation choice isn't just about features. It's about whether your data operating model scales with the business.
The Modern Warehouse-First UBA Strategy
Traditional UBA tooling was built around a separate analytics destination. You send events into a vendor-controlled system, use its schema, live within its query model, and export summaries back out when you need broader context. That can work for straightforward app analytics. It becomes restrictive when the business asks more interesting questions.
Why dedicated analytics tools become limiting
The main problem isn't that these tools are bad. It's that they often isolate behavioral data from the rest of the company's operating reality.
A PM wants to know whether users who opened support tickets during onboarding retained differently. A growth lead wants to compare self-serve expansion with sales-assisted accounts. A Head of Data wants one definition of activation used everywhere. Those are hard questions to answer cleanly when behavior lives in one system, revenue in another, and account state in a third.
There are also practical trade-offs:
- Rigid schemas make unusual workflows harder to model.
- Separate governance creates confusion over source of truth.
- Limited joins reduce behavioral analysis to product-only views.
- Team bottlenecks appear when only analysts can bridge the systems manually.
If your business depends on commerce data, inventory context, or catalog behavior, even adjacent implementation work becomes a data integration problem. A practical example is this Shopify product data integration guide, which shows how quickly analysis quality depends on whether product data is unified before anyone starts interpreting customer behavior.
Why warehouse-native UBA changes the game
A warehouse-first approach starts from a different assumption. The warehouse is the system of record, and behavioral events are just one more high-value dataset inside it. That means UBA can use the same governed identity model, the same dimensions, and the same business definitions already trusted across the company.
That enables better analysis. You can join feature usage with plan type, support interactions, renewal status, sales motion, and lifecycle stage without exporting data between disconnected tools. You can also support different working styles. Analysts can write SQL or Python. PMs and operators can query through governed interfaces built on the same underlying models.
One option in that category is Querio, which runs AI coding agents directly on the data warehouse so teams can analyze behavior through notebooks, queries, and reusable data files without moving the source data into a separate BI silo. That matters when the actual challenge isn't chart creation. It's making complex behavioral analysis accessible without turning the data team into a ticket queue.
Warehouse-native UBA won't fix bad instrumentation or weak product thinking. But once the basics are in place, it gives teams a more durable way to answer the questions that drive product and growth decisions.
If your team has plenty of user data but still waits on analysts to answer basic behavior questions, take a look at Querio. It gives teams a warehouse-native way to explore behavioral data, join it with the rest of the business context, and turn ad hoc questions into repeatable analysis without copying data into another silo.