Guide
SQL Query Optimisation: Proven Techniques for 2026
Master SQL query optimisation with actionable techniques for diagnosing slow queries, reading execution plans, and tuning for real-world performance.

Most SQL tuning advice fails because it treats performance like a spelling problem. Clean up the text, add an index, avoid SELECT *, and the query should magically speed up. In production, the ugly truth is that the query text is often fine, while the optimizer is choosing a bad plan because its row estimates are wrong, the data is skewed, or the statistics are stale.
That's why a query can look harmless on 1,000 rows and fall apart on 1,000,000 rows. The syntax didn't change, but the plan did. If you keep reaching for surface-level rewrites without checking the execution plan, you'll keep fixing the wrong thing.
Table of Contents
- Why Most SQL Tuning Advice Fails in Production
- A Stepwise Diagnostic Workflow for Slow Queries
- How Statistics and Cardinality Estimation Drive Plan Quality
- Indexing and Schema Changes Without Creating Write Bottlenecks
- Query Rewrite Patterns That Actually Improve Performance
- Monitoring and Concurrency Controls for Sustained Performance
- Real-World Before and After Optimization Scenarios
Why Most SQL Tuning Advice Fails in Production

The usual SQL query optimisation checklist sounds sensible until it hits a real workload. Avoid SELECT *, add indexes, rewrite joins, update stats. Those are all valid tools, but they're not a diagnosis. They're only useful after you know whether the failure is in the query text, the row estimates, or the plan choice itself.
The optimizer does not read your intent. It estimates cardinality, compares candidate plans, and picks what looks cheapest at compile time. SQL Server's statistics are the foundation for that estimate, and Microsoft documents that they're stored as BLOBs and used by the Query Optimizer to produce a better plan, which is why stale or incomplete statistics can mislead it badly. Microsoft's statistics documentation makes the mechanism explicit.
A query that works fine on a tiny sample often fails because the sample hides the distribution problem. Skewed data, like a status column where most rows are active and only a few are cancelled, can trick a planner into choosing the wrong join order or scan strategy. That's where generic advice breaks down, because the query text may already be reasonable while the plan is wrong for the data shape.
Practical rule: if a rewrite doesn't change the execution plan in a meaningful way, it probably didn't solve the real problem.
The fastest way to spot a plan-quality issue is to see the same SQL behave differently as the table grows. If runtime explodes while the query still looks clean, the optimizer is usually guessing wrong somewhere. That's also why this topic gets messy in production, because the winning fix is often invisible in a checklist, and the losing fix can look “best practice” on paper.
The other reason checklists disappoint is that teams copy advice without preserving the operating context. A production dashboard query, an ad hoc analyst query, and an ingestion-side report don't tolerate the same trade-offs. A tidy rewrite that helps one workload can hurt another, which is why the first question should be, “What plan did the optimizer choose, and why?”
The SQL query basics refresher is useful only if you already know the basics aren't the bottleneck.
A Stepwise Diagnostic Workflow for Slow Queries
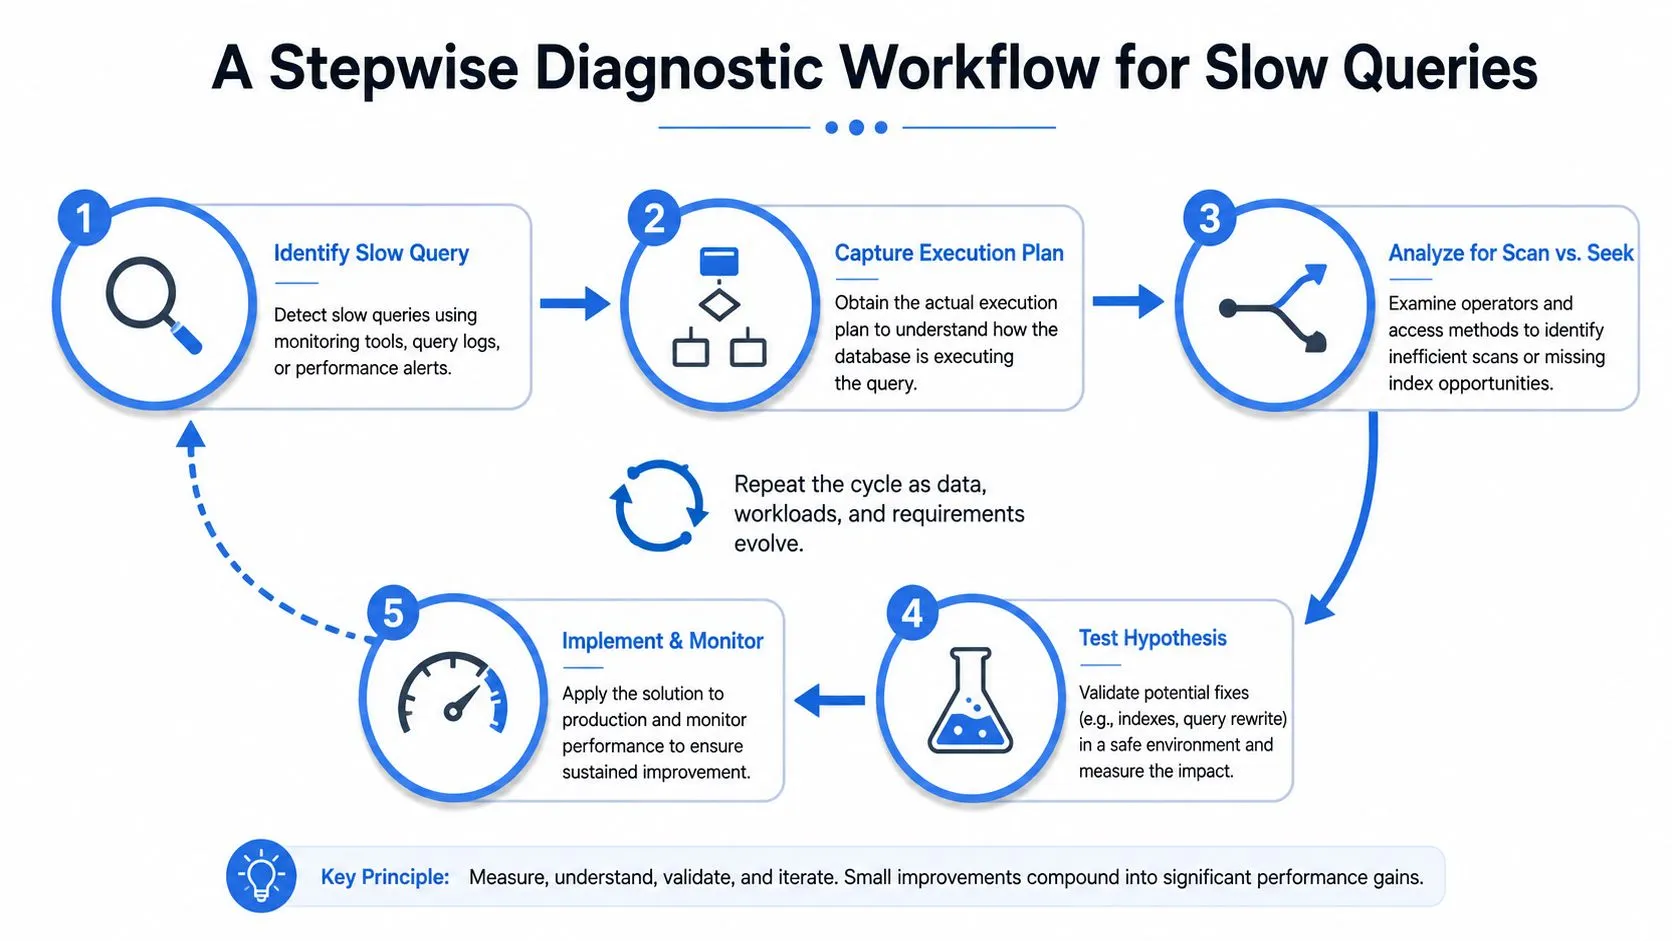
A useful tuning session starts with the slow query, not a cleaned-up version of it. Capture the query with its real parameters, because parameter values often decide whether a plan is cheap or disastrous. Then run EXPLAIN ANALYZE and look at the operators the engine executed, not the shape you hoped it would choose.
Find the worst node first
The biggest mistake is trying to “improve” the whole plan at once. Focus on the worst node, usually the deepest scan or the operator with the highest combination of loops and time. That node tells you where the work is happening, and it keeps you from tuning a harmless part of the query while the bottleneck stays untouched.
The plan usually tells you where the pain is. Read the expensive operator first, not the prettiest one.
Once you know the hotspot, make exactly one change. That might be a rewrite, a new index, or a stats refresh, but it should be one intervention only. If you change three things at once, you won't know which one fixed the problem, and you'll almost certainly mislearn the lesson.
Refresh statistics before you compare again
After the change, refresh table statistics with ANALYZE and rerun the query. Comparing the new plan against the old one is where the true insight shows up. If the row estimates improve and the join order changes, you've probably hit a plan-quality issue. If the estimates stay wrong, the optimizer still doesn't trust the data distribution it sees.
The value of the one-change loop is that it separates plan-quality problems from rewrite effects. A query can get faster because the rewrite reduced work, or because the optimizer finally had enough information to choose a better plan. Those are not the same win, and you want to know which one you got.
The nested SQL select guide can help when the suspicious operator sits inside a subquery or derived table, but the process stays the same.
How Statistics and Cardinality Estimation Drive Plan Quality
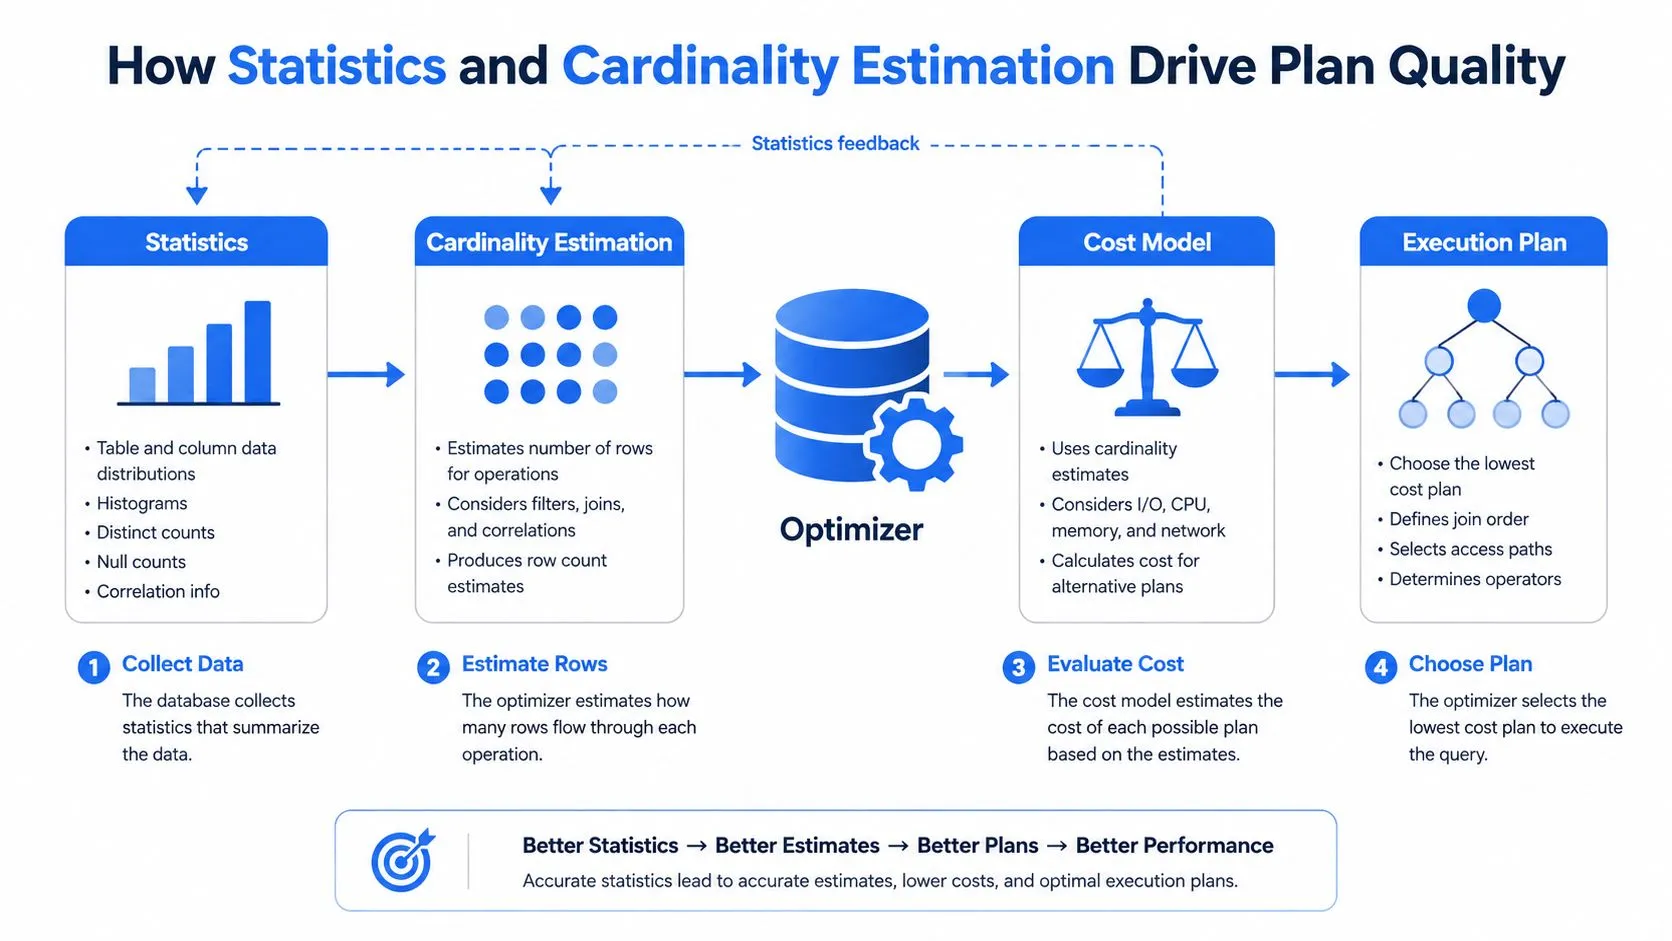
A query plan is only as good as the statistics behind it. In SQL Server, statistics summarize row counts, distinct values, NULL fractions, histograms, and correlation, and the optimizer uses them to estimate cardinality, the number of rows a step is expected to return before execution starts. That estimate shapes join choice, access path, and whether the engine believes a seek, scan, nested loop, or hash join is the cheapest option. The diagram above shows how those pieces fit together to produce plan quality.
Why stale statistics hurt more than bad SQL
Statistics age quickly in busy systems. SQL Server's auto-update threshold is roughly 20% of table changes plus 500 rows, so on a 10 million-row table the engine may wait until more than 2 million row changes before refreshing statistics by default. That lag is enough to leave the optimizer working from a picture of the table that no longer matches production.
The problem is not just that the metadata is old. Once the distribution shifts, the histogram stops reflecting real data, and the optimizer can keep choosing a plan that looks correct on paper but performs poorly under current conditions. A query that was stable yesterday can slow down after inserts, updates, or deletes change the shape of the data, even if the SQL text never changes.
What to look for when estimates look wrong
A wide gap between actual rows and estimated rows is the clearest signal that plan quality is off. That mismatch usually shows up around skewed predicates, joins on selective dimensions, or filters that have become more common over time. Histogram-based metadata is meant to capture that skew, but it only works when the stats still resemble the data being queried.
Refresh the statistics when you know the distribution has changed, then compare the new plan with the old one. If estimates get closer to reality and the join order shifts, the optimizer had the wrong picture of the data before the refresh. If nothing moves, the issue is probably somewhere else, such as index design, query shape, or a compatibility setting that is constraining plan choice.
For subqueries and derived tables, the same diagnostic logic still applies, and the nested SQL select guide is useful when you need to inspect where bad estimates first appear.
The point is simple. Statistics do not just support the optimizer, they define the plan space the optimizer thinks is worth considering.
Indexing and Schema Changes Without Creating Write Bottlenecks
Indexing is still one of the most useful tuning levers, but it's also the easiest one to overuse. A targeted index on a frequently filtered or joined column can remove a lot of unnecessary work. Too many indexes, though, slow writes and add storage and maintenance overhead, which is why the question is never “Can I add an index?” It's “Which index pays for itself on this workload?”
| Technique | Read Benefit | Write Cost | Maintenance Burden |
|---|---|---|---|
| Targeted index on join or filter columns | High when the predicate is selective | Moderate | Moderate |
| Covering index | High for repeated lookup patterns | Higher than a simple index | Higher |
| Composite index | High when column order matches the filter pattern | Moderate to high | Moderate |
| Partitioning | Strong for pruning large segments | Can help or hurt depending on ingest path | High |
| Materialized view | High for repeated summary queries | Extra work on refresh and writes | High |
The table above is a key trade-off often overlooked. Partitioning and materialized views can be powerful, but they also add operational weight. If your workload is self-serve analytics, you need to think about the people who maintain the system after the first win, not just the query author who asked for speed.
Useful heuristic: optimize the small set of queries that consume most database time, then monitor index usage so you can remove the dead weight.
That's where composite index ordering and covering strategy matter. Put the leading columns where the query filters or joins first, then confirm the engine is using the index. If an index only helps one report but punishes every insert and update, it's not a free improvement. It's a debt instrument with a performance coupon.
This is also the place where Querio fits as one option in the tooling layer, because it runs AI coding agents on the warehouse and can help teams query, analyze, and build with less manual handoff. Tools don't remove the trade-off, but they can make it easier to observe which queries are worth indexing and which ones are better left alone.
Query Rewrite Patterns That Actually Improve Performance
A rewrite only matters if it changes what the optimizer can prove. Cosmetic edits that make SQL easier to read but leave the same access path in place rarely move the needle. The rewrites that help are the ones that remove ambiguity, restore index use, or let the planner prune data earlier.
Four patterns worth checking
- Implicit type conversion: If a string column is compared to a numeric literal, or a timestamp column is cast on the wrong side of the predicate, the engine may stop using the intended index. Make the types match before the comparison.
- Correlated subquery: A row-by-row subquery often looks clean and performs like a loop. Rewrite it as a join or an aggregated join path when the logic allows it.
- Unnecessary
DISTINCT: This can hide upstream duplication instead of fixing it. IfDISTINCTis masking a data quality issue, the engine still does the work, then throws results away. - Wildcard predicate: Patterns that block partition pruning force the engine to touch more data than needed. That is a query design issue, not a hardware issue.
These patterns matter because they change the optimizer's choices. A correlated subquery can force repeated work, while a join can give the planner more room to reorder operations and reduce rows earlier. A bad cast can stop an index from being used even when the rest of the query is fine.
Understanding common table expressions can help you restructure complex queries for better optimizer behavior, see our CTE guide for details.
The right way to validate the rewrite is to compare plans, not just query text. If the operator tree still shows the same scan or the same repeated loops, the rewrite has not changed enough. If the plan shifts to a seek, a better join order, or fewer rows flowing into the expensive step, the rewrite paid off.
The main mistake teams make is treating these as universal rules. They are specific tools for specific plan shapes, and they only matter when they change the engine's ability to reason about the data.
Monitoring and Concurrency Controls for Sustained Performance
A fast query today can become a noisy neighbor tomorrow. Data changes, usage patterns drift, and one analytical job can start competing with transactional traffic. That's why monitoring has to sit next to tuning, not behind it.
Keep a feedback loop on the expensive paths
Start by tracking query-level execution time and plan changes so regressions show up before users complain. The point is not to watch every statement forever. The point is to watch the statements that consume the most database time and catch when a plan flips into something worse.
Resource controls matter just as much. A single expensive report can starve other workloads if you let it run unmanaged, especially in shared warehouse environments. That's where resource groups or workload management help, because they isolate query classes instead of asking every workload to behave politely on its own.
If you only tune when someone files a ticket, you're already behind. The better signal is the workload pattern itself.
Query optimization tooling belongs in this operating model because teams need visibility into plans, execution cost, and query behavior before they can act. Monitoring, benchmarking, and concurrency control work best together, since each one closes a different failure mode.
The priority order should be boring and disciplined. Watch the high-cost queries, review plan changes, check for lock waits, and tune configuration only when the evidence says the bottleneck is systemic. That keeps you from chasing one-off complaints and helps you protect transactional work while still improving analytics performance.
Real-World Before and After Optimization Scenarios
A product dashboard started timing out after the underlying table grew and the statistics went stale. The query itself was simple, but the plan had drifted into a scan-heavy path because the optimizer no longer trusted its old cardinality estimate. After a stats refresh and a careful recheck of the plan, the execution path changed and the dashboard recovered without a rewrite.
Another team had an ad hoc analytical query that kept touching too much data because the filter prevented partition pruning. They rewrote the predicate so the engine could eliminate irrelevant partitions earlier, then verified that the plan stopped scanning unnecessary segments. The SQL got a little less compact, but the operator tree got much smaller.
A reporting pipeline had the opposite problem. Too many indexes were slowing writes and adding overhead the team had mistaken for “protection.” After removing inferior indexes that weren't pulling their weight, the write path became easier to maintain and the overall throughput improved.
Those three cases share the same lesson. Successful SQL query optimisation is a diagnosis process, not a bag of tricks. The winners didn't just edit SQL. They found the bottleneck, proved what the optimizer was doing, and changed only the part that mattered.
Querio helps teams work directly on warehouse data with AI coding agents, notebook-based workflows, and query-plan visibility, so the people debugging performance don't have to rely on guesswork or slow handoffs. If you're trying to keep dashboards, self-serve analytics, and product reporting fast without turning every table into a tuning project, visit Querio and see how it fits into your workflow.