Guide
Programming for Data Analytics Explained and How to Master
Learn programming for data analytics from scratch. Master the essential skills to analyze data effectively and boost your career in 2026.
You've got a dashboard request waiting, a product manager asking why activation fell, and an executive who wants an answer before the next meeting. The analyst who owns the data is already handling three other requests, so a small reporting change becomes a queue, a handoff, and another round of clarification.
Programming for data analytics changes that pattern. It turns repeated questions into reusable workflows, moves logic closer to the warehouse, and gives teams a way to produce decision support without rebuilding every answer by hand. Python became the dominant general-purpose language for data analytics by the late 2010s. In the Python Developers Survey 2018 coverage, 58% of respondents used Python for data analysis, up from 50% in 2017, and the survey reached more than 20,000 developers across more than 150 countries.
The point isn't to memorize syntax for its own sake. You'll learn how SQL, Python, notebooks, tests, version control, semantic layers, and AI-assisted workflows fit together. You'll also see why a warehouse-first approach, including file-based notebooks and inspectable code, can serve both technical analysts and the people who need answers from data.
Table of Contents
- Introduction to Programming for Data Analytics in Modern Teams
- What Programming for Data Analytics Really Means
- Core Languages and Libraries That Power Analytics Work
- How an Analytics Programming Workflow Flows End to End
- Real Project Examples With Code You Can Adapt
- Your Learning Path From First Script to Production Ready
- Best Practices That Make Analytics Code Collaborative and Reliable
Introduction to Programming for Data Analytics in Modern Teams
A product team rarely asks for “a query.” It asks why new users stop onboarding, which customer segment is expanding, or whether a feature launch changed retention. Those questions cross tables, definitions, time windows, and business assumptions. A dashboard may display the final metric, but it often hides the logic that produced it.
That hidden logic creates dependence. A founder waits for a weekly report. A product manager requests another filter. A data leader discovers that two dashboards use different definitions of an active customer. Each request looks small, yet the analyst must locate the source tables, interpret the metric, adjust the query, validate the result, and explain the change.
Programming gives the team a better unit of work: a repeatable analytical workflow. Instead of manually preparing a report, an analyst can write code that extracts data, applies documented rules, checks expectations, creates a result table, and produces a visualization. The next question becomes an input to the workflow rather than a fresh investigation.
Why warehouse-first analytics matters
The data warehouse should be more than a storage layer that dashboards query. It can become the controlled source for reusable models, analysis tables, and decision-support workflows. SQL handles filtering, joins, and aggregation where the data already lives. Python adds flexible transformation, statistical analysis, visualization, and orchestration.
This approach also makes assumptions visible. A stakeholder can inspect the query, a teammate can review the transformation, and a scheduled job can rerun the same logic after new data arrives. That's a stronger foundation than copying numbers from a dashboard into a spreadsheet.
The broader shift toward self-serve analytics is explored in how modern BI tools empower non-technical teams. Self-service doesn't mean removing analysts from the process. It means giving analysts the infrastructure to publish reliable, understandable work that others can safely explore.
By the end of this guide, you'll have a practical model for choosing tools, designing an end-to-end pipeline, building reusable projects, and moving from notebooks to production. The key question is no longer “Can I write Python?” It's “Can I turn a business question into a reliable analytical product?”
What Programming for Data Analytics Really Means
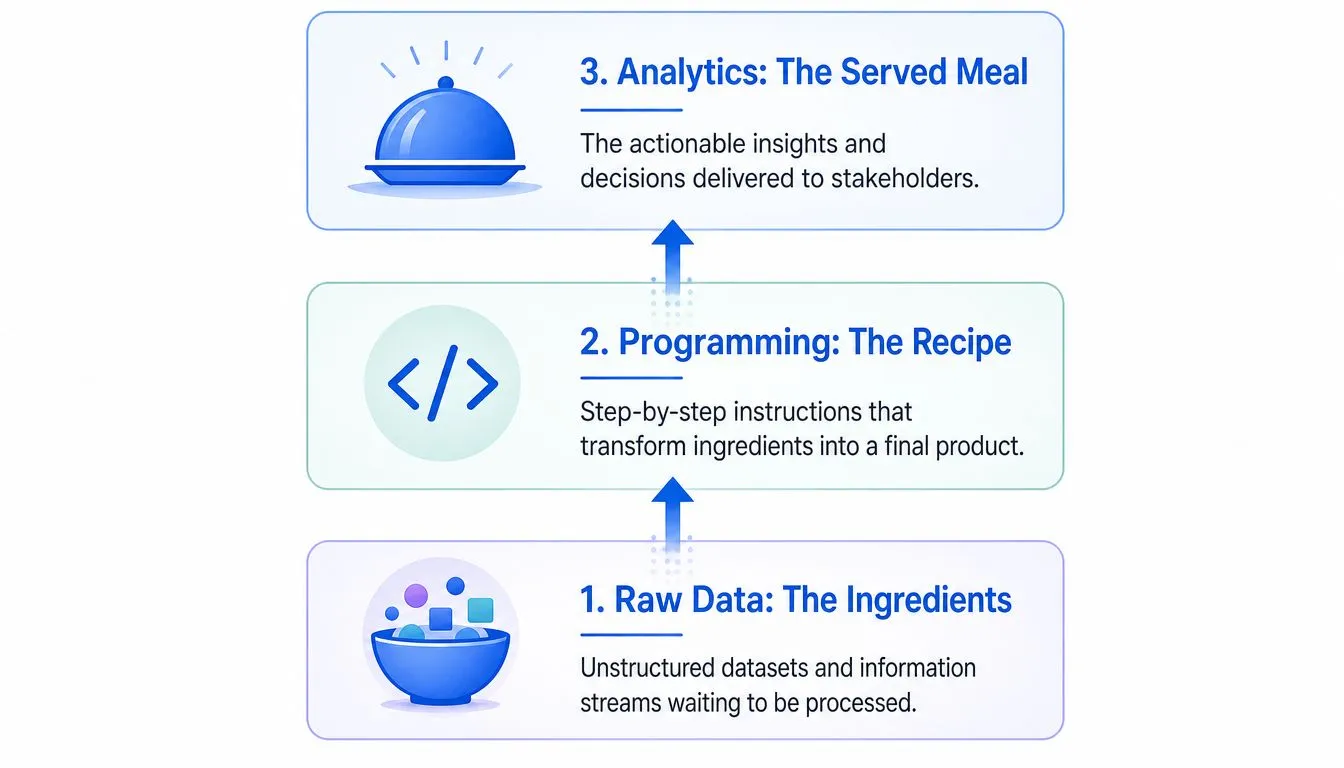
Think of a restaurant kitchen.
Raw data is the collection of ingredients. Some ingredients are fresh, some are mislabeled, and some arrive in containers that don't match the recipe. Programming is the recipe and the preparation process. Analytics is the finished meal, presented in a form that lets someone make a decision.
A useful analytics program usually performs several connected jobs:
- Extract: Retrieve the relevant records from a warehouse, application database, file, or API.
- Clean: Standardize dates, handle missing values, remove duplicates, and resolve inconsistent labels.
- Transform: Join sources, calculate metrics, reshape tables, and create analysis-ready fields.
- Explore: Examine distributions, segments, trends, and unusual observations.
- Communicate: Produce a chart, table, model output, notebook, or recommendation.
The recipe analogy also explains why programming differs from clicking through a BI interface. A dashboard is useful for recurring views, but its behavior can be constrained by predefined filters and calculations. Code lets you express a custom sequence of decisions and save that sequence for someone else to inspect or rerun.
Where SQL ends and programming begins
SQL is programming, even though analysts often learn it separately from Python. A SQL query tells a database how to select, join, group, and reshape structured data. Python then expands the workflow into tasks such as statistical modeling, file handling, API orchestration, visualization, and automated validation.
Programming for analytics sits between ad hoc querying and full data engineering. An analyst might not own ingestion infrastructure, but they still need to write dependable transformations and understand how data moves through the warehouse. A production-minded analyst treats each result as an asset with inputs, logic, outputs, and a clear owner.
Practical rule: If you can't explain where a metric came from and rerun the steps that produced it, you have an answer, not yet an analytical workflow.
Teams hiring for this blend of analytical reasoning and engineering discipline can use an analytics engineer job description resource from Talantrix to clarify responsibilities. The role commonly sits in the space between business questions, warehouse modeling, and maintainable analytical code.
The payoff is reproducibility, flexibility, and scale. Reproducibility means the same inputs and rules can produce the same result. Flexibility means you can adapt the workflow to a new segment or question. Scale means the process doesn't depend on one person remembering a sequence of manual clicks.
Core Languages and Libraries That Power Analytics Work
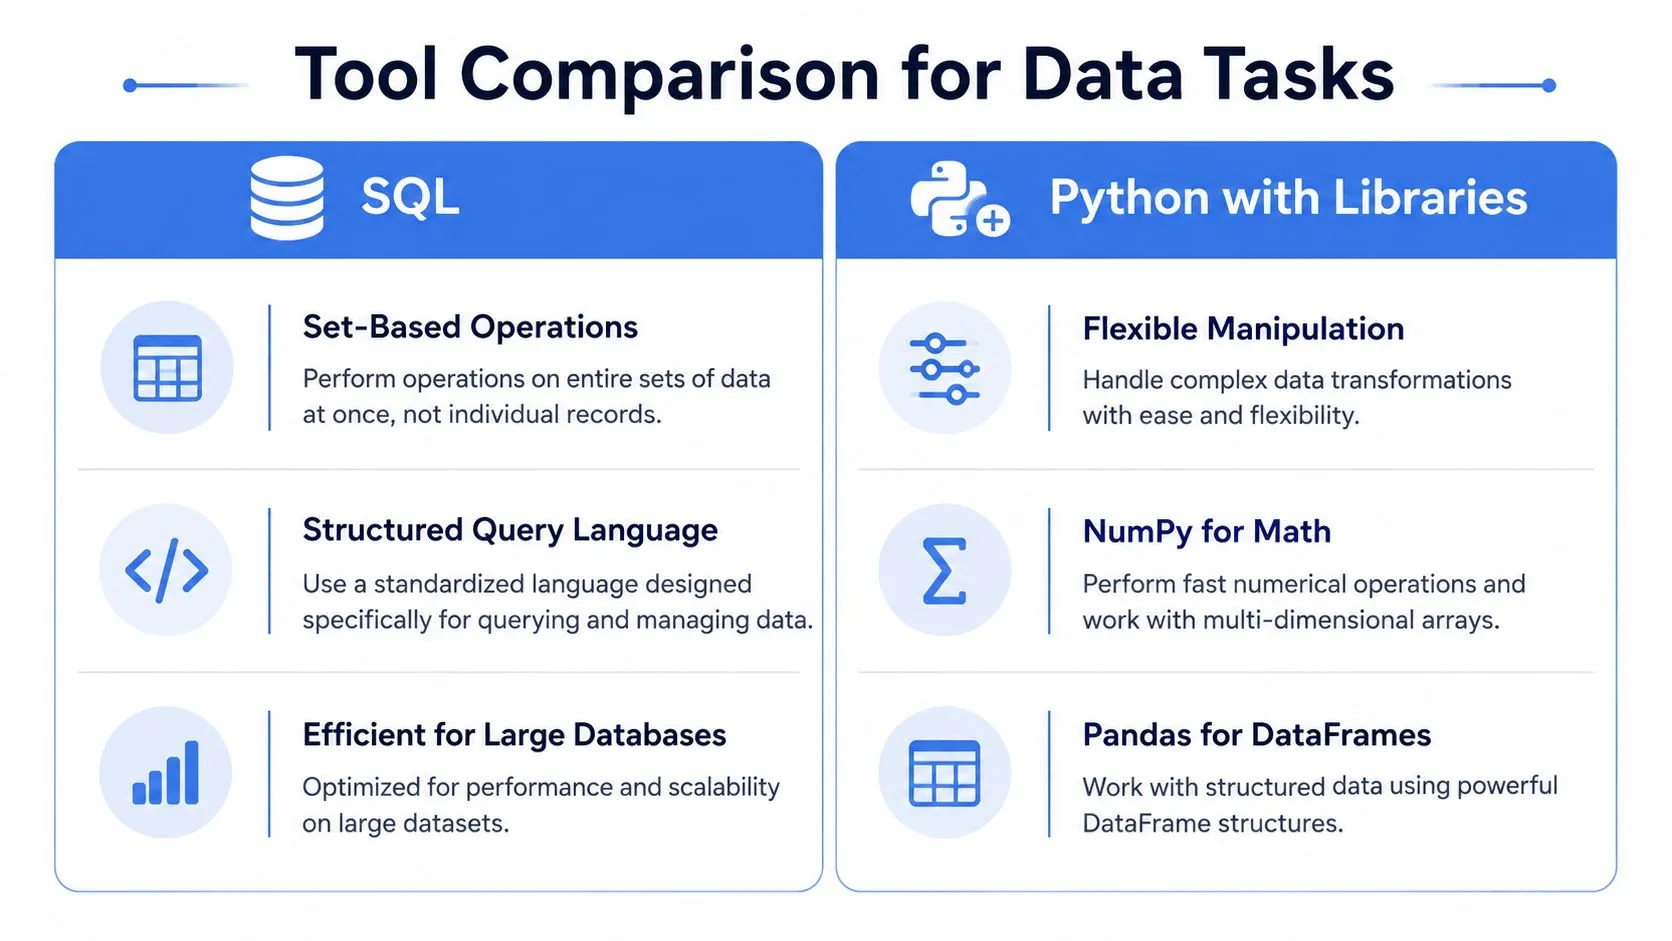
Tool choice should follow the shape of the work. SQL is strongest when the problem is relational and the data already lives in a database. Python is a flexible choice for manipulation, orchestration, visualization, and modeling. R remains valuable when statistical analysis and research workflows dominate.
Python's position in analytics isn't just a matter of reputation. In the JetBrains summary of the Python Developers Survey, 48% of Python developers were involved in data exploration and processing in 2023, and 77% of those working in that area used Python for it. Among those developers, Pandas was used by 80% and NumPy by 75%, showing how strongly analytics work has converged around foundational libraries.
A practical comparison
| Tool | Strongest fit | Choose it when | Watch for |
|---|---|---|---|
| SQL | Filtering, joins, aggregation, warehouse transformations | The data is structured and computation can run in the database | Complex statistical workflows may become awkward |
| Python | Data manipulation, automation, modeling, visualization | You need a broad ecosystem and one language across analysis tasks | Uncontrolled local processing can create performance and governance issues |
| R | Statistical analysis and research | Statistical depth, specialized methods, or an existing R team matters | Integration with a Python-first production stack may require extra coordination |
| Matplotlib and Seaborn | Static charts and exploratory plots | You need controlled, code-defined visualizations | Interactive stakeholder exploration may need another layer |
| Plotly | Interactive charts | Users need to inspect points, filters, or trends directly | Interactivity doesn't replace clear metric definitions |
Start with SQL if you're new to analytics. It teaches you how tables relate, how grain affects a result, and why a join can change a count. Add Python after you can reliably retrieve the right data, then learn Pandas for tabular manipulation and NumPy for numerical operations.
If you're choosing between R and Python, use the team's environment and the analytical problem as tie-breakers. A statistician working in a research-heavy group may prefer R. A product analyst building scheduled workflows, APIs, and machine learning features may benefit from Python. The statistical tools comparison for R, Python, SPSS, and SAS offers a useful way to evaluate that choice by task rather than fashion.
A structured Python learning guide for developers can help beginners avoid learning disconnected language features. Focus on functions, data structures, modules, exceptions, and testing, then apply each concept to a real analytical question.
You can also use the following video as a visual introduction to Python's role in analytics:
The best stack is usually not the largest stack. It's the smallest combination that makes the workflow understandable, testable, and useful to the people making decisions.
How an Analytics Programming Workflow Flows End to End
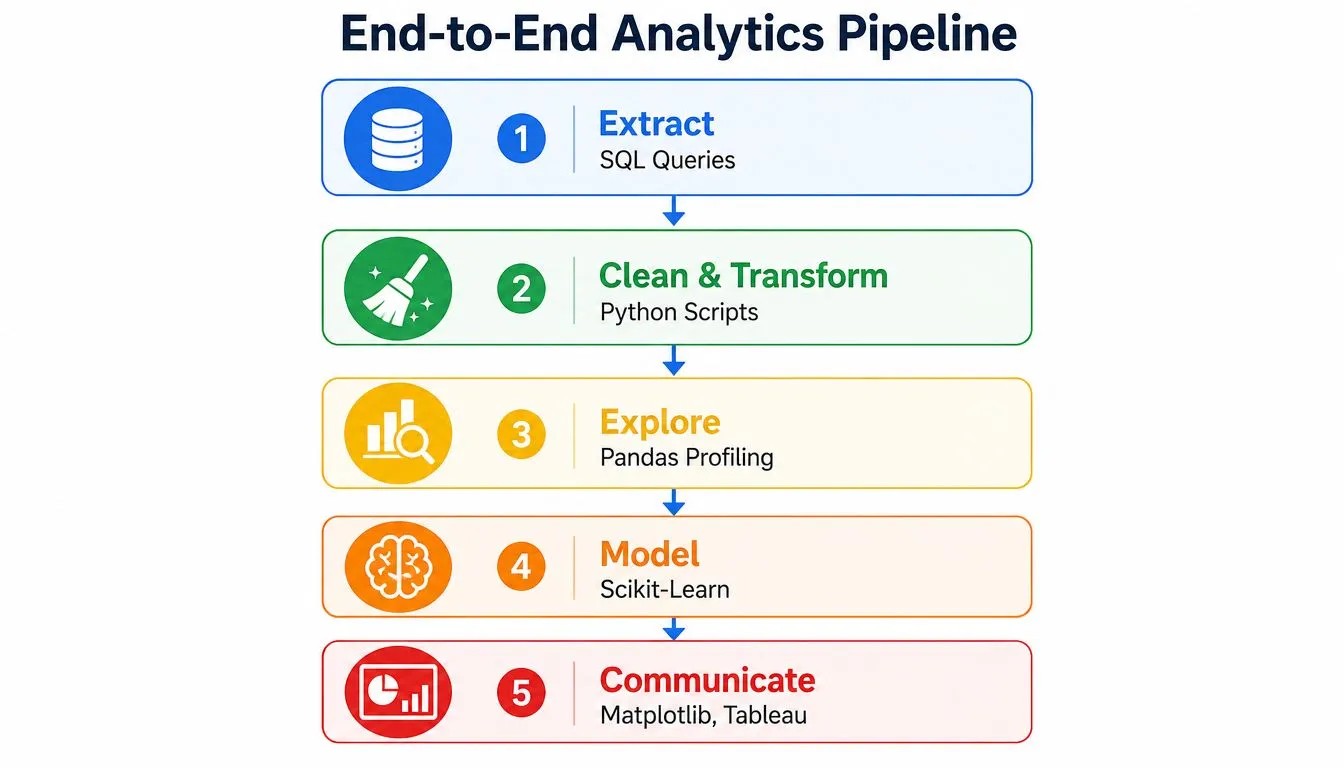
A dependable workflow behaves like a pipeline. Each stage receives a defined input, performs a focused job, and hands a clear output to the next stage. That design prevents the common failure where a notebook contains extraction, cleaning, analysis, and presentation in one tangled sequence.
Start with extraction
Use SQL to select only the fields and rows the analysis needs. Apply joins, filters, and aggregations in the warehouse whenever practical. Databases are designed for set-based operations, so asking the warehouse to reduce a large source table before Python receives it usually creates a cleaner boundary.
The query should state the grain of the result. Is each row a customer, order, session, or customer-month? Many analytical errors begin when a person assumes a table has one row per entity but a join has introduced multiple rows.
Transform and validate
Python can orchestrate the query, combine outputs, engineer features, and prepare data for analysis. Pandas is useful when the result fits the processing environment and the transformation benefits from expressive dataframe operations. For larger workloads, keep the heavy filtering and aggregation in SQL and let Python coordinate the stages.
Validation belongs here, not only at the end. Check that required columns exist, dates fall within expected ranges, keys behave as expected, and row counts are plausible for the question. A failed validation is easier to investigate than a polished chart built on an invalid join.
Explore and model
Exploration should answer focused questions rather than generate endless charts. Compare cohorts, inspect distributions, identify missingness, and test whether a pattern survives reasonable segment definitions. If you build a predictive model, separate training data from evaluation data and record the feature definitions used.
A model isn't the finished product. The business user needs to know which action the prediction supports, what information enters the decision, and how the output will be monitored.
Communicate and operate
The final output may be a warehouse table, notebook, dashboard dataset, alert, or recommendation. Store the output where its users can access it, document the metric definitions, and schedule the workflow if the decision repeats.
Semi-structured inputs often require an explicit parsing step before analysis. A practical text-to-JSON guide from LocalChat can help teams think through how unstructured text becomes a consistent input for downstream code.
For broader stack decisions, the modern analytics stack guide provides context on how extraction, transformation, warehouses, and analysis tools fit together. The central performance lesson remains simple: design the workload before optimizing the code. Analytical database performance depends heavily on the query shape, joins, filters, and execution plan, not only on the language used to submit the request.
Real Project Examples With Code You Can Adapt
Small projects become valuable when they end with a decision. A churn table matters when a customer success team can prioritize outreach. A cohort table matters when a growth team can distinguish acquisition volume from durable revenue. A model matters when an owner knows what action follows its output.
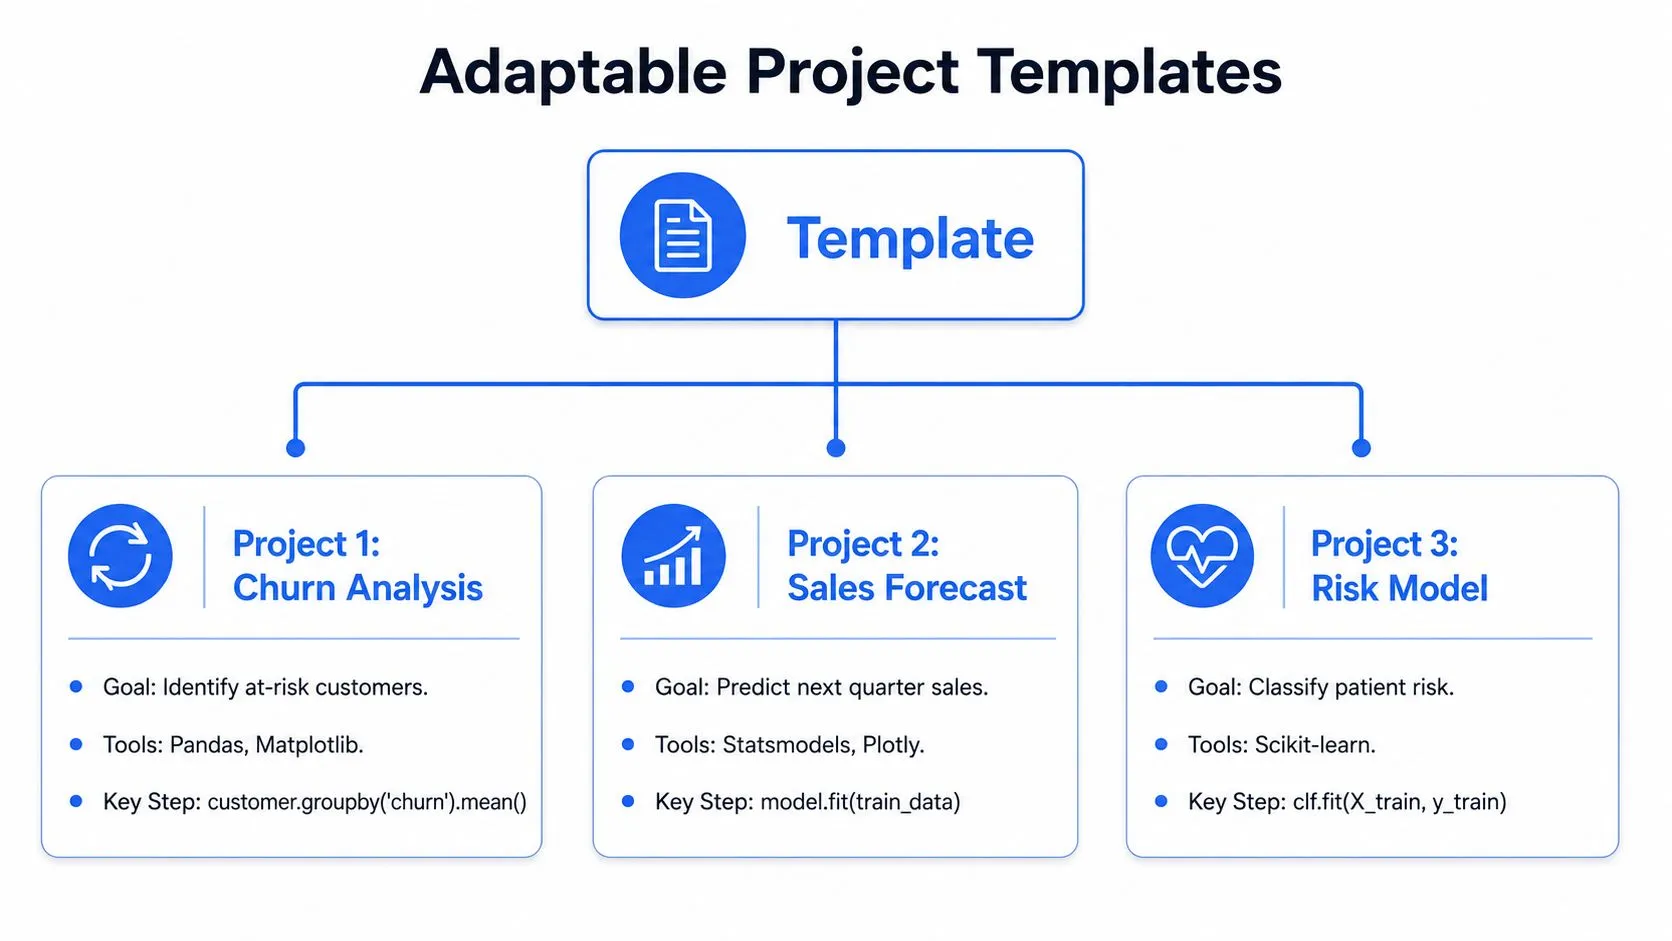
Churn exploration
Suppose a customer table contains customer_id, plan, tenure_months, support_tickets, and churn. The first pass should describe the population rather than jump directly to a model.
summary = (
    customers
    .groupby("churn")[["tenure_months", "support_tickets"]]
    .mean()
)

summary.plot.bar()
The code compares average characteristics across churn groups. The business question is whether the observed differences suggest an intervention, such as earlier onboarding support or a review of customers with repeated unresolved tickets. Before acting, verify that the fields are measured before churn and that the grouping doesn't conceal important plan or region differences.
Revenue cohorts
A cohort table begins with a clear definition. For example, assign each customer a first-purchase month, then calculate revenue by months since that first purchase.
select
  customer_id,
  date_trunc('month', min(order_date)) as cohort_month
from orders
group by customer_id;
Python can then reshape the extracted result:
cohorts = (
    orders
    .assign(months_since_first_purchase=lambda x:
            x["order_month"] - x["cohort_month"])
    .groupby(["cohort_month", "months_since_first_purchase"])
    ["revenue"].sum()
    .unstack(fill_value=0)
)
The output can show whether newer cohorts behave differently from earlier ones. The recommendation might involve onboarding, pricing, or retention work, but only if the team distinguishes cohort effects from changes in traffic sources, product mix, or accounting treatment.
A model that can run again
A simple classifier can start in a notebook, then move into a scheduled job after the feature definitions and evaluation process are stable.
from sklearn.model_selection import train_test_split
from sklearn.linear_model import LogisticRegression

X_train, X_test, y_train, y_test = train_test_split(
    features, target, test_size=0.2, random_state=7
)

model = LogisticRegression(max_iter=1000)
model.fit(X_train, y_train)
The production version should load a defined input table, apply the same feature logic, generate predictions, write them to a controlled destination, and log errors. The important transition isn't copying notebook cells into a script. It's turning an exploratory idea into a workflow with stable inputs, repeatable execution, and an accountable owner.
Your Learning Path From First Script to Production Ready
Learn in an order that follows how analytical work happens. Starting with advanced machine learning before you can define a table's grain usually creates confusion, because model outputs can't repair unclear inputs.
First build the data foundation
Begin with SQL fundamentals. Practice selecting, filtering, grouping, joining, handling nulls, and using window functions. Build a small report from raw tables and write down the grain of every intermediate result.
Next, learn Python fundamentals through analytics tasks. Focus on variables, lists and dictionaries, functions, modules, exceptions, and reading documentation. Don't collect isolated exercises. Write a script that loads data, validates columns, applies a transformation, and saves an output.
Then develop analytical fluency
Learn Pandas by solving problems that require filtering, merging, grouping, reshaping, and date handling. Learn NumPy when you need array operations and numerical computation. Add visualization with Matplotlib, Seaborn, or Plotly, but attach every chart to a question.
Statistics should follow exploration. Study distributions, sampling, uncertainty, correlation, regression, and experiment interpretation. You don't need to apply every method immediately. You do need to understand what a method assumes and what its output can support.
A useful checkpoint: You're ready to progress when you can explain the data grain, identify the main failure modes, and reproduce the result without relying on hidden notebook state.
Make the work production-ready
Learn Git early enough that version control becomes normal, not a rescue technique. Practice small commits, meaningful changes, code review, and branches. Then add tests for transformations, checks for source data, dependency management, and scheduled execution.
Avoid tutorial hell by giving each stage a deliverable:
- SQL milestone: A documented customer or revenue model built from multiple tables.
- Python milestone: A script that extracts data and produces a validated analysis table.
- Statistics milestone: A written recommendation that explains uncertainty and limitations.
- Engineering milestone: A scheduled workflow with logs, tests, and a clear owner.
Use warehouse data safely. Start with read-only access, limit sensitive fields, work from approved models, and avoid downloading more data than the task requires. Production readiness is less about knowing every library and more about knowing how to make your work inspectable, repeatable, and safe.
Best Practices That Make Analytics Code Collaborative and Reliable
Analytics code fails in teams when the result depends on a person's memory. A notebook may run perfectly on Tuesday because it contains a hidden variable, a local file, or an active database session. On Friday, another analyst opens it and gets a different result or no result at all.
Reproducibility requires more than saving a notebook. Expert guidance on reproducible research and data analysis recommends versioned analysis code, identifiable data snapshots, captured execution environments, reusable scripts, and automated notebook execution. These controls address common problems such as noisy notebook diffs, changed source data, hidden state, and credentials that exist only on one machine.
Treat notebooks as interfaces, not storage closets
Use notebooks for exploration, explanation, and review. Move reusable logic into scripts or modules. Keep credentials outside the code, define dependencies explicitly, and make each execution start from a clean environment.
A collaborative repository should make it easy to answer:
- What changed? Version control records the code and review history.
- Which data was used? Store a reference to the source model, snapshot, or extraction date.
- Can it run again? Automate the complete workflow rather than depending on manual cell execution.
- Who owns the output? Assign responsibility for definitions, failures, and updates.
Build for self-service and AI-assisted work
The modern analytics programmer increasingly builds reusable data products, not just dashboards. A semantic layer can give teams shared definitions for concepts such as revenue, activation, or retained users. Metadata can explain ownership, freshness, lineage, and permitted use. AI agents can help generate SQL, summarize results, or scaffold Python, but they still need governed models and reviewable outputs.
That changes the skill that matters. If an agent can draft a query, the analyst's value shifts toward defining the question, selecting trustworthy sources, checking grain, testing the result, and translating evidence into an action. The question becomes: what should the team build when query generation is cheap? The answer is reusable context, reliable metrics, clear interfaces, and workflows that people can inspect.
Querio is one example of this approach. It uses a file system model with reactive notebooks, executes SQL and Python against connected data sources, and exposes generated code for inspection and editing. In practice, that can support a shared workflow where technical and non-technical users work from warehouse-backed files rather than passing every request through a human API.
The durable asset isn't the chart. It's the tested definition, documented transformation, and accessible workflow behind the chart.
Teams comparing collaboration and governance patterns can also review data analysis tools for collaboration, versioning, and reproducibility. The strongest setup combines warehouse discipline, code review, semantic consistency, automated checks, and interfaces that let stakeholders explore without bypassing governance.
If your team spends too much time answering repeated data questions, visit Querio to explore warehouse-backed notebooks that generate and expose SQL and Python for review. Use it to turn ad hoc analysis into reusable decision-support workflows that technical and non-technical teammates can inspect and extend.