Power BI Embedded: The 2026 Guide for Product Teams
Is Power BI Embedded right for your SaaS app? This guide covers architecture, pricing, security, common pitfalls, and a comparison to modern alternatives.
https://www.youtube.com/watch?v=nq7AHXP2LI8
published
Outrank AI
power bi embedded, embedded analytics, saas analytics, customer facing dashboards, querio
df8fde27-fc6a-425c-b094-6548dcb1ad46

Power BI Embedded is Microsoft’s Azure service for putting interactive Power BI reports inside your own product, and it has been generally available since November 2, 2016. It lets your customers view embedded analytics without needing Power BI licenses, while pricing starts at $750 per month for A1 capacity and scales upward as you add dedicated compute.
If you’re evaluating customer-facing analytics right now, you’re probably in a familiar bind. Product wants dashboards inside the app. Sales wants analytics in demos. Customers want self-serve answers without waiting on your support team. Engineering, meanwhile, already has a full roadmap and doesn’t want to become the reporting team by accident.
That’s where power bi embedded usually enters the conversation. It looks like the obvious enterprise answer because it’s backed by Microsoft, works with the broader Power BI ecosystem, and gives you a way to embed reports directly into your application, website, or customer portal. For teams already using Azure and Power BI, it can feel like the shortest path from internal BI to a customer-facing analytics product.
But the first impression is only part of the story. The critical decision isn’t whether Power BI Embedded can work. It can. The main question is whether its architecture, pricing model, developer workflow, and operational overhead fit the kind of SaaS product you’re building.
Table of Contents
The Analytics Dilemma for Modern Product Teams
A product manager gets the request from a strategic customer. They don’t want CSV exports anymore. They want trends, cohort views, usage breakdowns, and account-level dashboards inside the product. The ask sounds simple until the implementation choices land on the table.
One path is to build analytics from scratch. That means frontend charting, backend query orchestration, permissions, caching, and ongoing maintenance. The other path is to buy an embedded analytics platform and accept its constraints. For many teams, Microsoft lands on the shortlist fast because Power BI is already familiar inside the company.
The appeal is easy to understand. Analysts can keep working in Power BI Desktop. Data teams can publish reports to the service. Developers can embed those reports in the app instead of rebuilding every chart by hand. For a roadmap under pressure, that sounds efficient.
What gets missed early is that embedded analytics isn’t just a reporting feature. It becomes part of your product surface, your security model, your customer experience, and your infrastructure bill. Once it’s live, every refresh issue, auth issue, rendering issue, or tenant-isolation bug becomes a product problem, not a BI problem.
That’s why teams need to evaluate this as a platform choice, not a widget choice.
For product leaders thinking through customer-facing reporting strategy, the broader challenge looks a lot like the one described in analytics for product managers. The hard part isn’t getting charts on a screen. It’s building an analytics experience that scales with customer demands without turning your data team into a permanent delivery bottleneck.
Power BI Embedded solves a real problem. It just doesn’t remove the need to think like a product team operating an analytics platform.
What Is Power BI Embedded and How Does It Work
A common SaaS scenario looks like this: the product team wants customer-facing dashboards in the app this quarter, analysts already build in Power BI, and engineering wants to avoid building a charting layer from scratch. Power BI Embedded exists for exactly that use case. It lets you serve Power BI reports inside your own product instead of sending customers to the Power BI service.
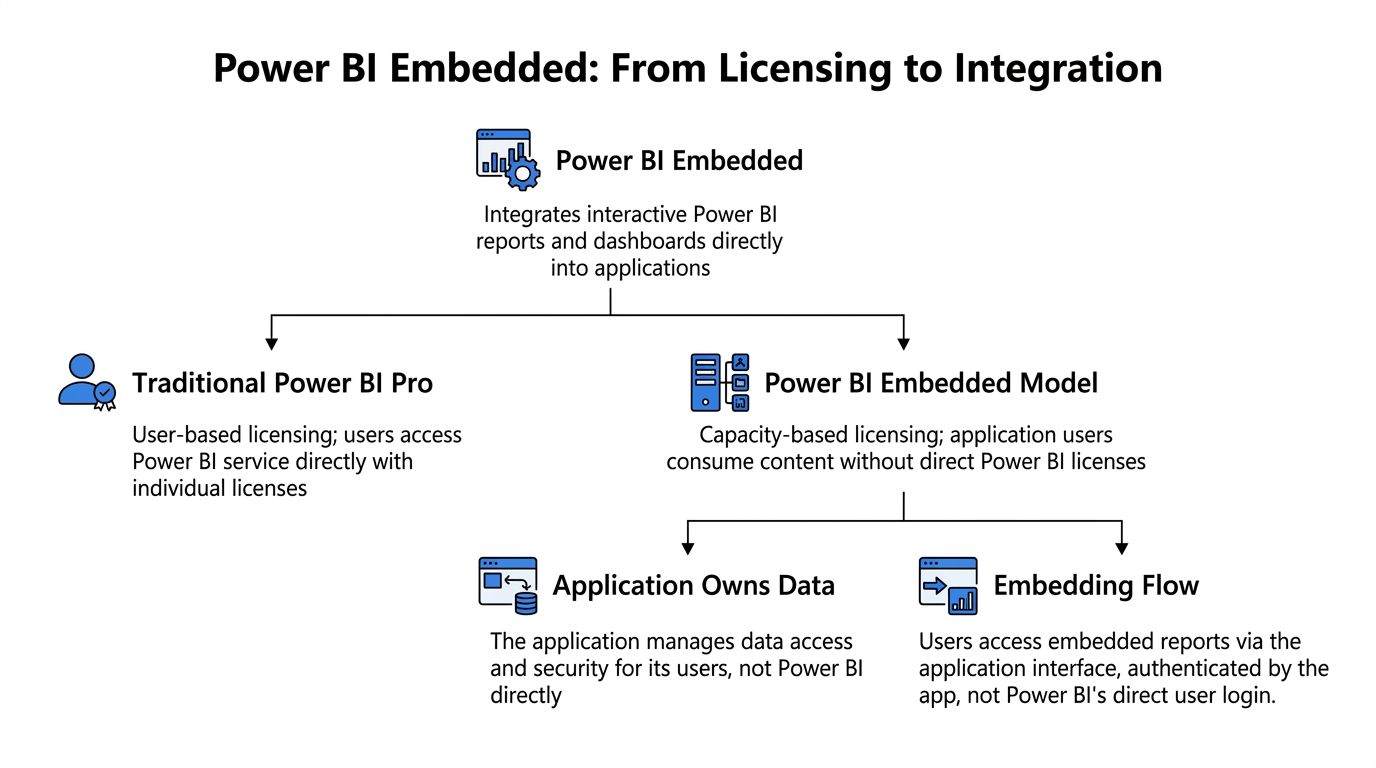
Power BI Embedded is Microsoft’s Azure-based embedding model for Power BI content. The practical idea is simple. Reports are still authored in Power BI Desktop and published to Microsoft’s service, but your application handles how those reports are delivered to end users.
The core shift from licenses to capacity
The biggest change is commercial and architectural at the same time.
With standard Power BI usage, access is tied more directly to named users and the Power BI service. With Embedded, your app becomes the delivery layer, and you pay for dedicated capacity so external users can view reports without each person needing a Power BI license in the usual way.
That sounds cleaner than it often is.
Capacity-based delivery works well when you have a clear embedded use case and enough usage to justify dedicated infrastructure. It gets harder when demand is uneven, tenants have very different usage patterns, or the product team expects the reporting layer to behave like a native web app under load. At that point, you are no longer choosing a BI tool alone. You are choosing an operating model.
A typical implementation follows this path:
A BI developer builds a report in Power BI Desktop.
The report is published to a Power BI workspace.
That workspace is attached to embedded capacity.
Your backend authenticates with Microsoft and generates an embed token.
Your frontend uses the Power BI client library to render the report inside your product.
For teams comparing architecture options, this Power BI embedding guide for SaaS products gives a simpler product view of the same flow.
The two embedding models that matter
Two access models drive most design decisions.
App-owns-data is the model most SaaS teams care about. Your application signs in to Microsoft, generates embed tokens, and decides what each customer can access. The customer sees analytics inside your product, usually without interacting with the Power BI service directly.
User-owns-data is a better fit for internal portals and enterprise scenarios where users already have Power BI identities and licenses. In that setup, Microsoft handles more of the user context. Your product has less control over the experience.
The trade-off is straightforward:
Model | Best fit | What your team owns |
|---|---|---|
App-owns-data | External customers in your SaaS app | Authentication flow, token generation, tenant scoping, embedded UX |
User-owns-data | Internal employees using Power BI accounts | Less application control, more dependence on Microsoft-side identity and licensing |
For a customer-facing SaaS product, app-owns-data is usually the only realistic choice. It gives the product team control over access and presentation, but it also pushes more responsibility onto engineering. Token services, tenant isolation, workspace design, and failure handling all become part of the application stack.
That is the part many teams underestimate. Power BI can reduce report authoring time. It does not remove the platform work required to ship embedded analytics well.
Exploring Core Features for SaaS Applications
A SaaS team usually understands the true nature of Power BI Embedded after the first few customer rollouts. The demo looks strong. Then product asks for tenant-specific views, customer success wants account-level usage dashboards, and engineering realizes report delivery now depends on security rules, API orchestration, and refresh jobs behaving predictably under load.
For customer-facing analytics, the features that matter are not the broadest BI features. The ones that carry the most weight are row-level security, programmatic control through APIs, and refresh strategies for large, growing datasets. Those three decide whether embedded analytics stays manageable or turns into another platform your team has to operate.
Row-level security shapes the product model
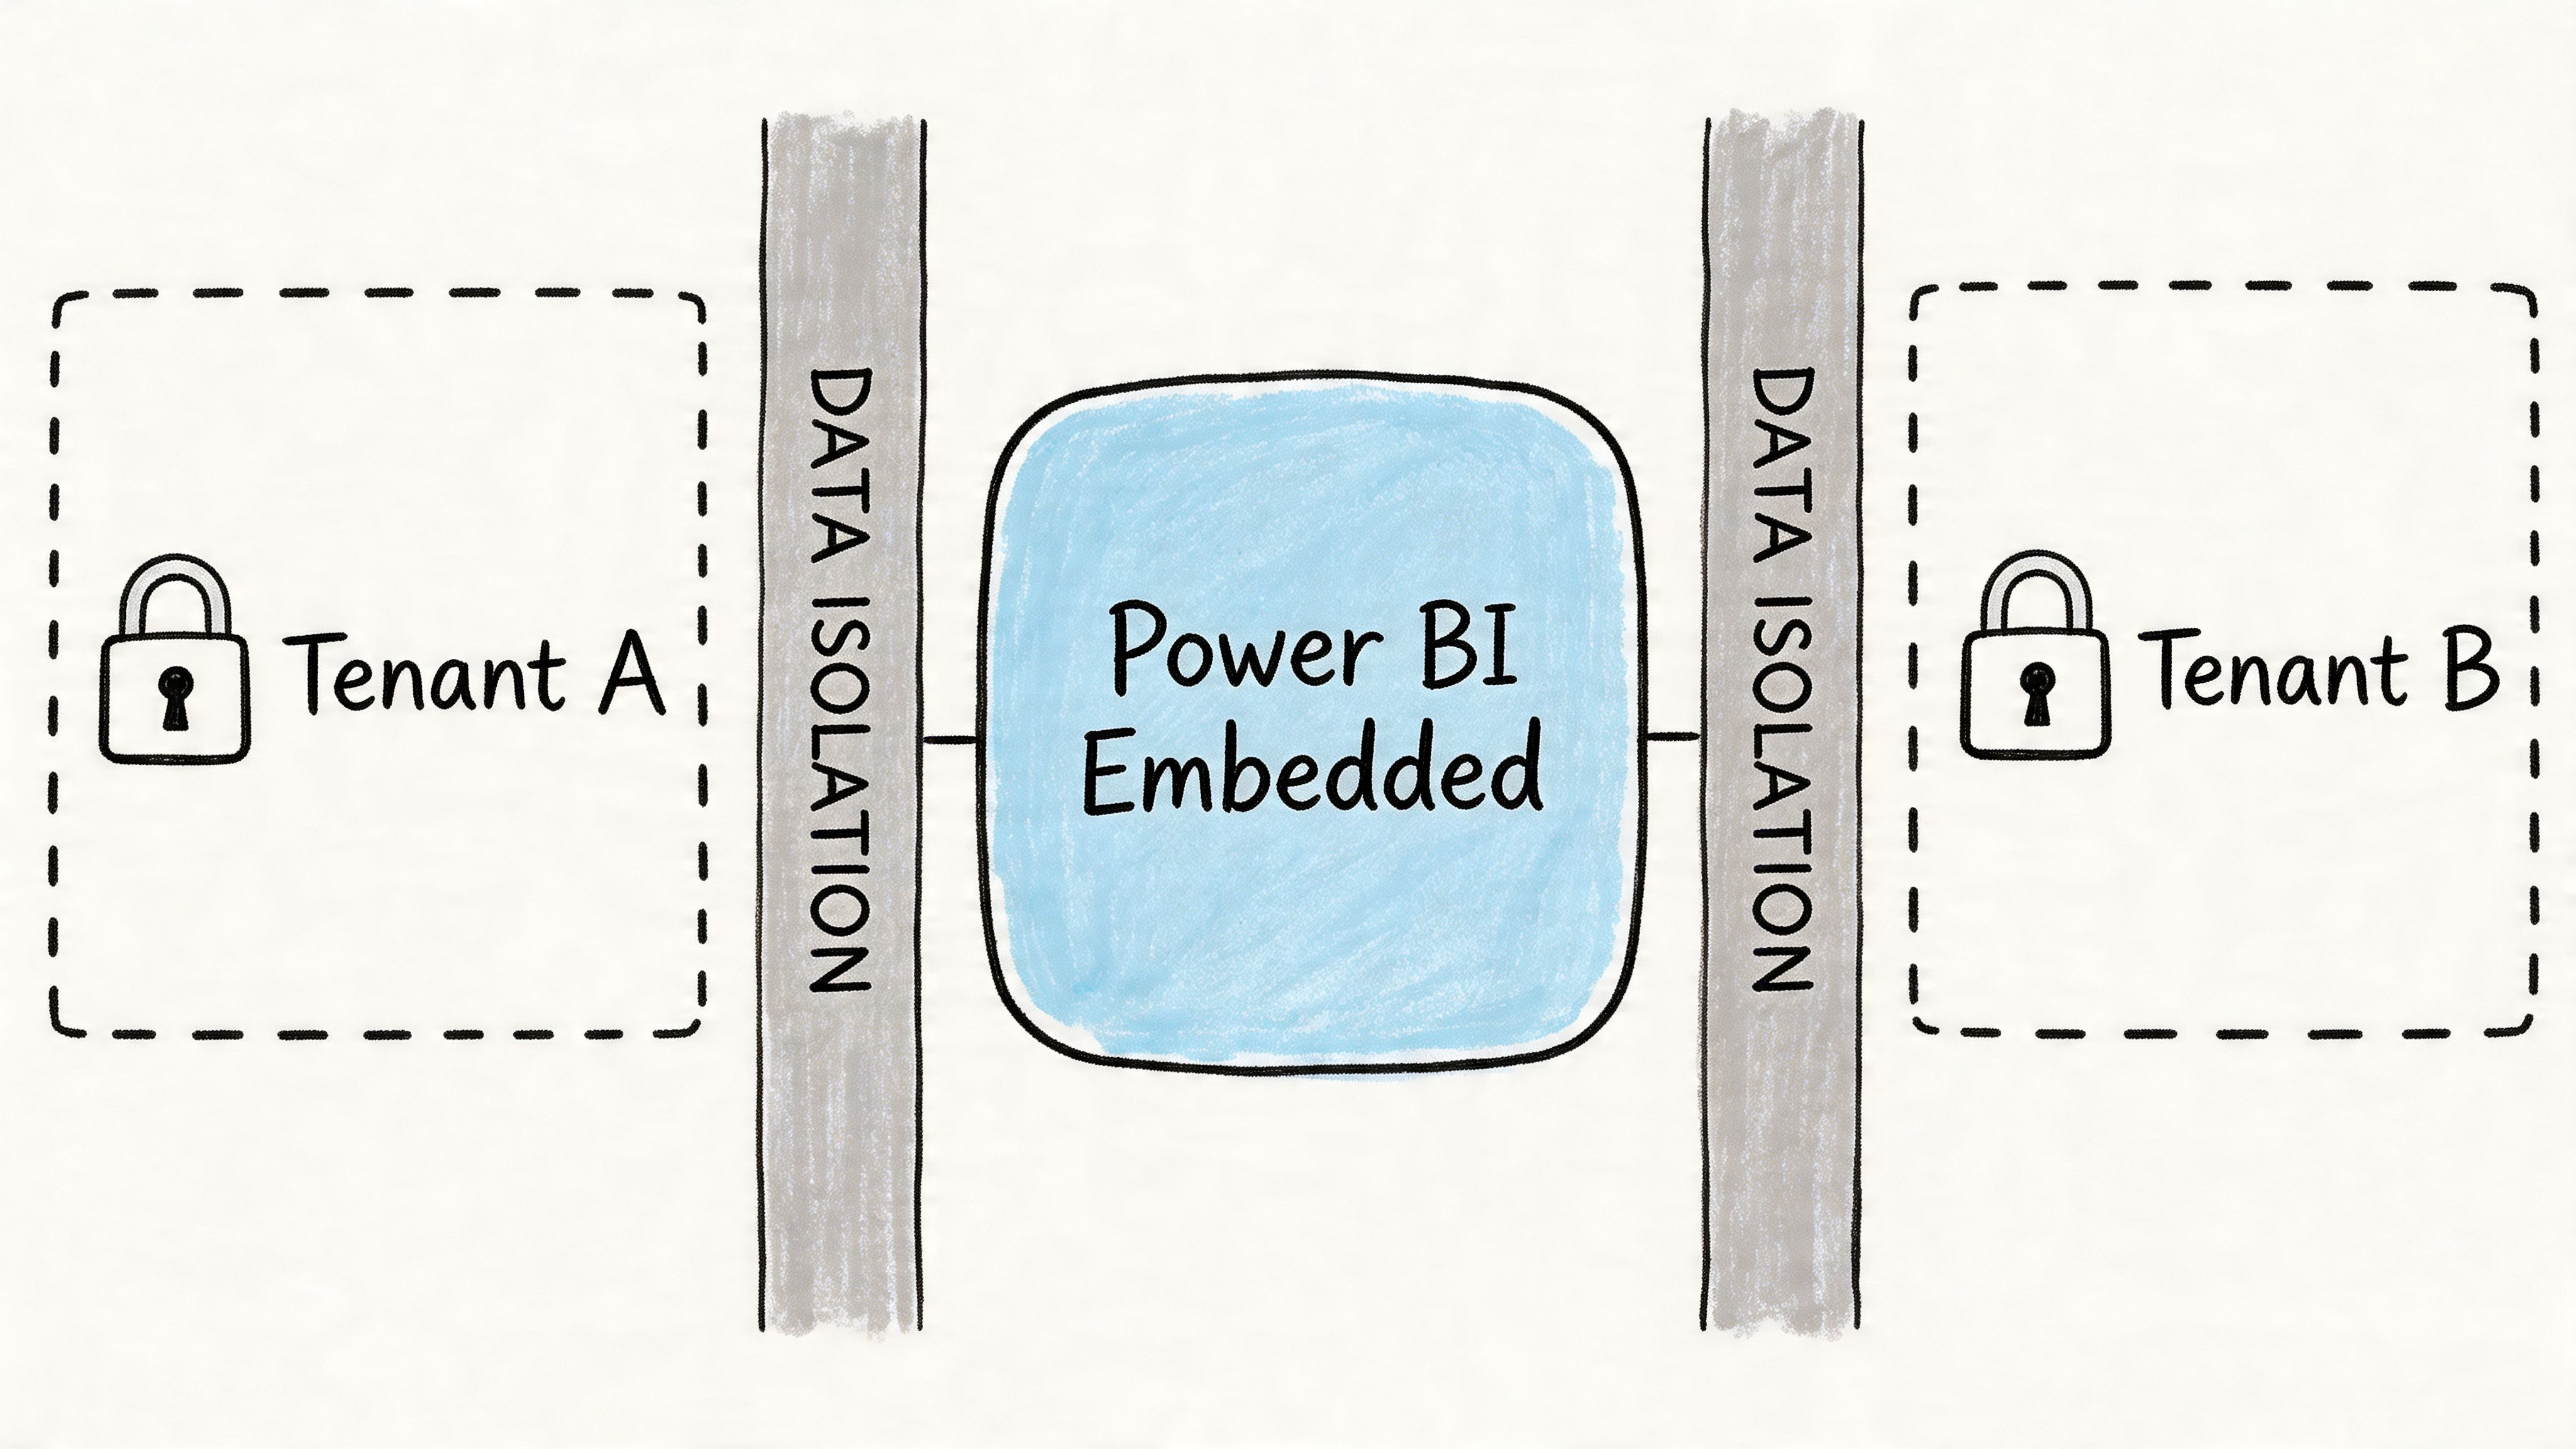
For multi-tenant products, Row-Level Security (RLS) is not a reporting detail. It is part of the application architecture.
If tenant scoping is inconsistent across your data model, embed token generation, and report filters, the failure mode is serious. Customers can see the wrong slice of data, support teams lose confidence in the analytics layer, and engineering ends up debugging identity logic across two systems instead of one. Power BI supports this pattern, but the setup demands discipline.
RLS usually earns its keep in three cases:
Tenant isolation: one shared model or report serves many customers, with access controlled by identity or tenant attributes
Role-based access: admins, managers, and individual users see different parts of the same data
Report reuse: teams avoid cloning dashboards per account and keep logic centralized
A broader product-side view is in this guide to row-level security for multi-tenant SaaS analytics.
The trade-off is straightforward. RLS reduces report sprawl, but it increases the cost of getting identity mapping right. In a small deployment, that may be acceptable. In a fast-growing SaaS product, every new tenant rule, custom permission edge case, or exception for enterprise accounts adds more policy logic to maintain.
APIs matter because manual operations do not scale
Power BI Embedded is far more workable when the engineering team treats it as infrastructure, not as a set of reports someone published in a portal.
The REST APIs are what make that possible. They let teams automate workspace management, control embed flows, move assets across environments, and keep embedded analytics connected to the product lifecycle instead of a manual BI process. If you are comparing options for embedding dashboards into a SaaS product, this is one of the clearest dividing lines. Power BI can do it, but it asks your team to own more orchestration than many buyers expect.
The practical API-driven patterns usually include:
Provisioning workflows: create or configure workspaces and content as part of deployment
Embed operations: issue tokens from the backend with the right report and identity context
Environment management: move reports and datasets from development to staging to production with fewer manual steps
This is powerful. It is also operational work. Your developers are now responsible for token lifecycles, deployment consistency, service principal permissions, and failure handling around a third-party analytics runtime.
Refresh behavior decides whether the system stays efficient
Refresh is one of the least exciting parts of an embedded analytics evaluation. It is also where a lot of total cost shows up.
For growing product datasets, full refresh is easy to understand and expensive to live with. As data volumes rise, refresh windows stretch, capacity pressure increases, and downstream report latency becomes a product issue, not just a BI issue. Microsoft documents incremental refresh as a way to partition tables and refresh only recent data while keeping historical partitions unchanged, which is why it matters so much for usage analytics, event streams, revenue history, and operational trend reporting.
A practical way to compare the main options:
Capability | Why it matters in SaaS |
|---|---|
Full refresh | Simple setup, but it gets slower and more expensive as historical data grows |
Incremental refresh | Better suited to time-based data where only recent periods change |
API-driven operations | Required if refresh, deployment, and embedding are part of the product stack |
Incremental refresh helps, but it does not remove the underlying constraints. You still need a model designed around time partitions, a data source that supports the pattern cleanly, and enough operational visibility to catch failures before customers do. That is a recurring theme with Power BI Embedded. The core features are real and useful, but using them well in a SaaS product often takes more engineering effort than the initial sales pitch suggests.
High-Level Integration Patterns and Steps
The implementation path for power bi embedded is straightforward on paper. In a real product, the complexity sits in the handoffs between Azure setup, report publishing, backend token generation, and frontend rendering. Most delays happen in those seams.
What the implementation lifecycle looks like
At a high level, teams usually move through four stages.
First, provision dedicated capacity in Azure. This is the infrastructure layer that allows your app to serve embedded content to users who don’t hold Power BI licenses. Without that capacity assignment, the customer-facing model doesn’t work as intended.
Second, publish reports into a workspace that lives on that capacity. This is often where analysts and developers start crossing responsibilities. Analysts may own report creation. Developers need to understand workspace IDs, report IDs, dataset dependencies, and deployment behavior.
Third, generate embed tokens from your backend. This is the critical handoff point between your product’s authentication layer and Power BI’s rendering model. Tokens shouldn’t be generated in the frontend. Your app server needs to request and deliver them securely.
Fourth, render the report inside your web application. The Power BI JavaScript client handles the in-app display layer, but your team still owns the experience around loading states, token refresh, access failures, and surrounding UI.
For teams comparing implementation options more broadly, this walkthrough on how to embed dashboards in a SaaS product helps frame where embedded BI fits versus more custom approaches.
Where teams usually underestimate effort
The common mistake is assuming the job ends once a report appears inside an iframe or container. That’s only the first milestone.
The actual work usually includes:
Environment management: keeping development, staging, and production content consistent.
Security mapping: making sure user identity in your app maps correctly to tenant access in Power BI.
Operational support: handling expired tokens, broken refreshes, and report changes that affect embedding.
Frontend fit and finish: making embedded analytics feel like part of your product, not a bolted-on portal.
A useful mental split is this:
Team | Usually owns |
|---|---|
Analyst or BI developer | Model design, report creation, visuals, DAX logic |
Application developer | Capacity setup, embedding flow, token service, app integration |
Platform or data lead | Security design, deployment process, cost and performance governance |
The embedded demo is the easy part. The durable operating model is the hard part.
That’s why integration planning should start with ownership questions, not SDK questions.
Navigating Security and Multi-Tenancy Models
Security design in power bi embedded isn’t just about protecting a report. It’s about deciding how your product will isolate customer data under load, across environments, and through future changes. For SaaS teams, that decision sits closer to platform architecture than BI configuration.
Tenant isolation is a product architecture decision
The most common pattern is dynamic RLS. Your team defines security rules in the semantic model, then passes the effective identity when generating embed tokens. That allows one shared report and one shared dataset model to serve many customers while filtering data differently per user or tenant.
That approach is efficient, but it raises the bar for correctness. If identity mapping is weak or model logic becomes messy, you can create security risk through configuration drift rather than through obvious code bugs.
The alternative some teams move toward is more isolated tenancy patterns. Those can reduce blast radius and simplify reasoning, but they usually increase administrative overhead. More isolation often means more content lifecycle management.
Here’s the trade-off in plain terms:
Shared model with dynamic RLS: lower content duplication, more dependency on correct security logic.
More isolated tenant setup: clearer separation, but more operational complexity to manage at scale.
Hybrid models: sometimes necessary, but easy to make inconsistent over time.
What works in practice
The right answer depends on how your product is sold and how your customers expect analytics to behave.
If you serve many customers from a similar schema and want consistent product analytics, shared models with strong RLS are often workable. If customers have meaningfully different data structures, governance rules, or account-specific reporting requirements, the limits of that shared model show up quickly.
A few practical checks help:
Map identity outside the report first. Don’t rely on report logic to compensate for unclear tenant definitions in your app.
Keep security logic reviewable. If only one Power BI specialist understands the model filters, that’s a platform risk.
Test failure modes intentionally. Verify what happens with missing identity context, stale roles, and unexpected account mappings.
A lot of teams also underestimate how much product trust depends on this layer. Customers don’t care whether the leak happened in DAX, tokens, or workspace management. They see one thing: your app showed the wrong data.
Secure embedded analytics isn’t about adding RLS at the end. It’s about making tenant isolation a first-class product decision from the start.
Understanding the Pricing and Scaling Model
A common SaaS moment looks like this. The first embedded rollout goes live, a few customers adopt it, and the monthly bill seems manageable. Then a larger customer starts using heavier reports, concurrency rises at the wrong time of day, and the question shifts from “What does an A SKU cost?” to “How much capacity do we need to keep the product reliable?”
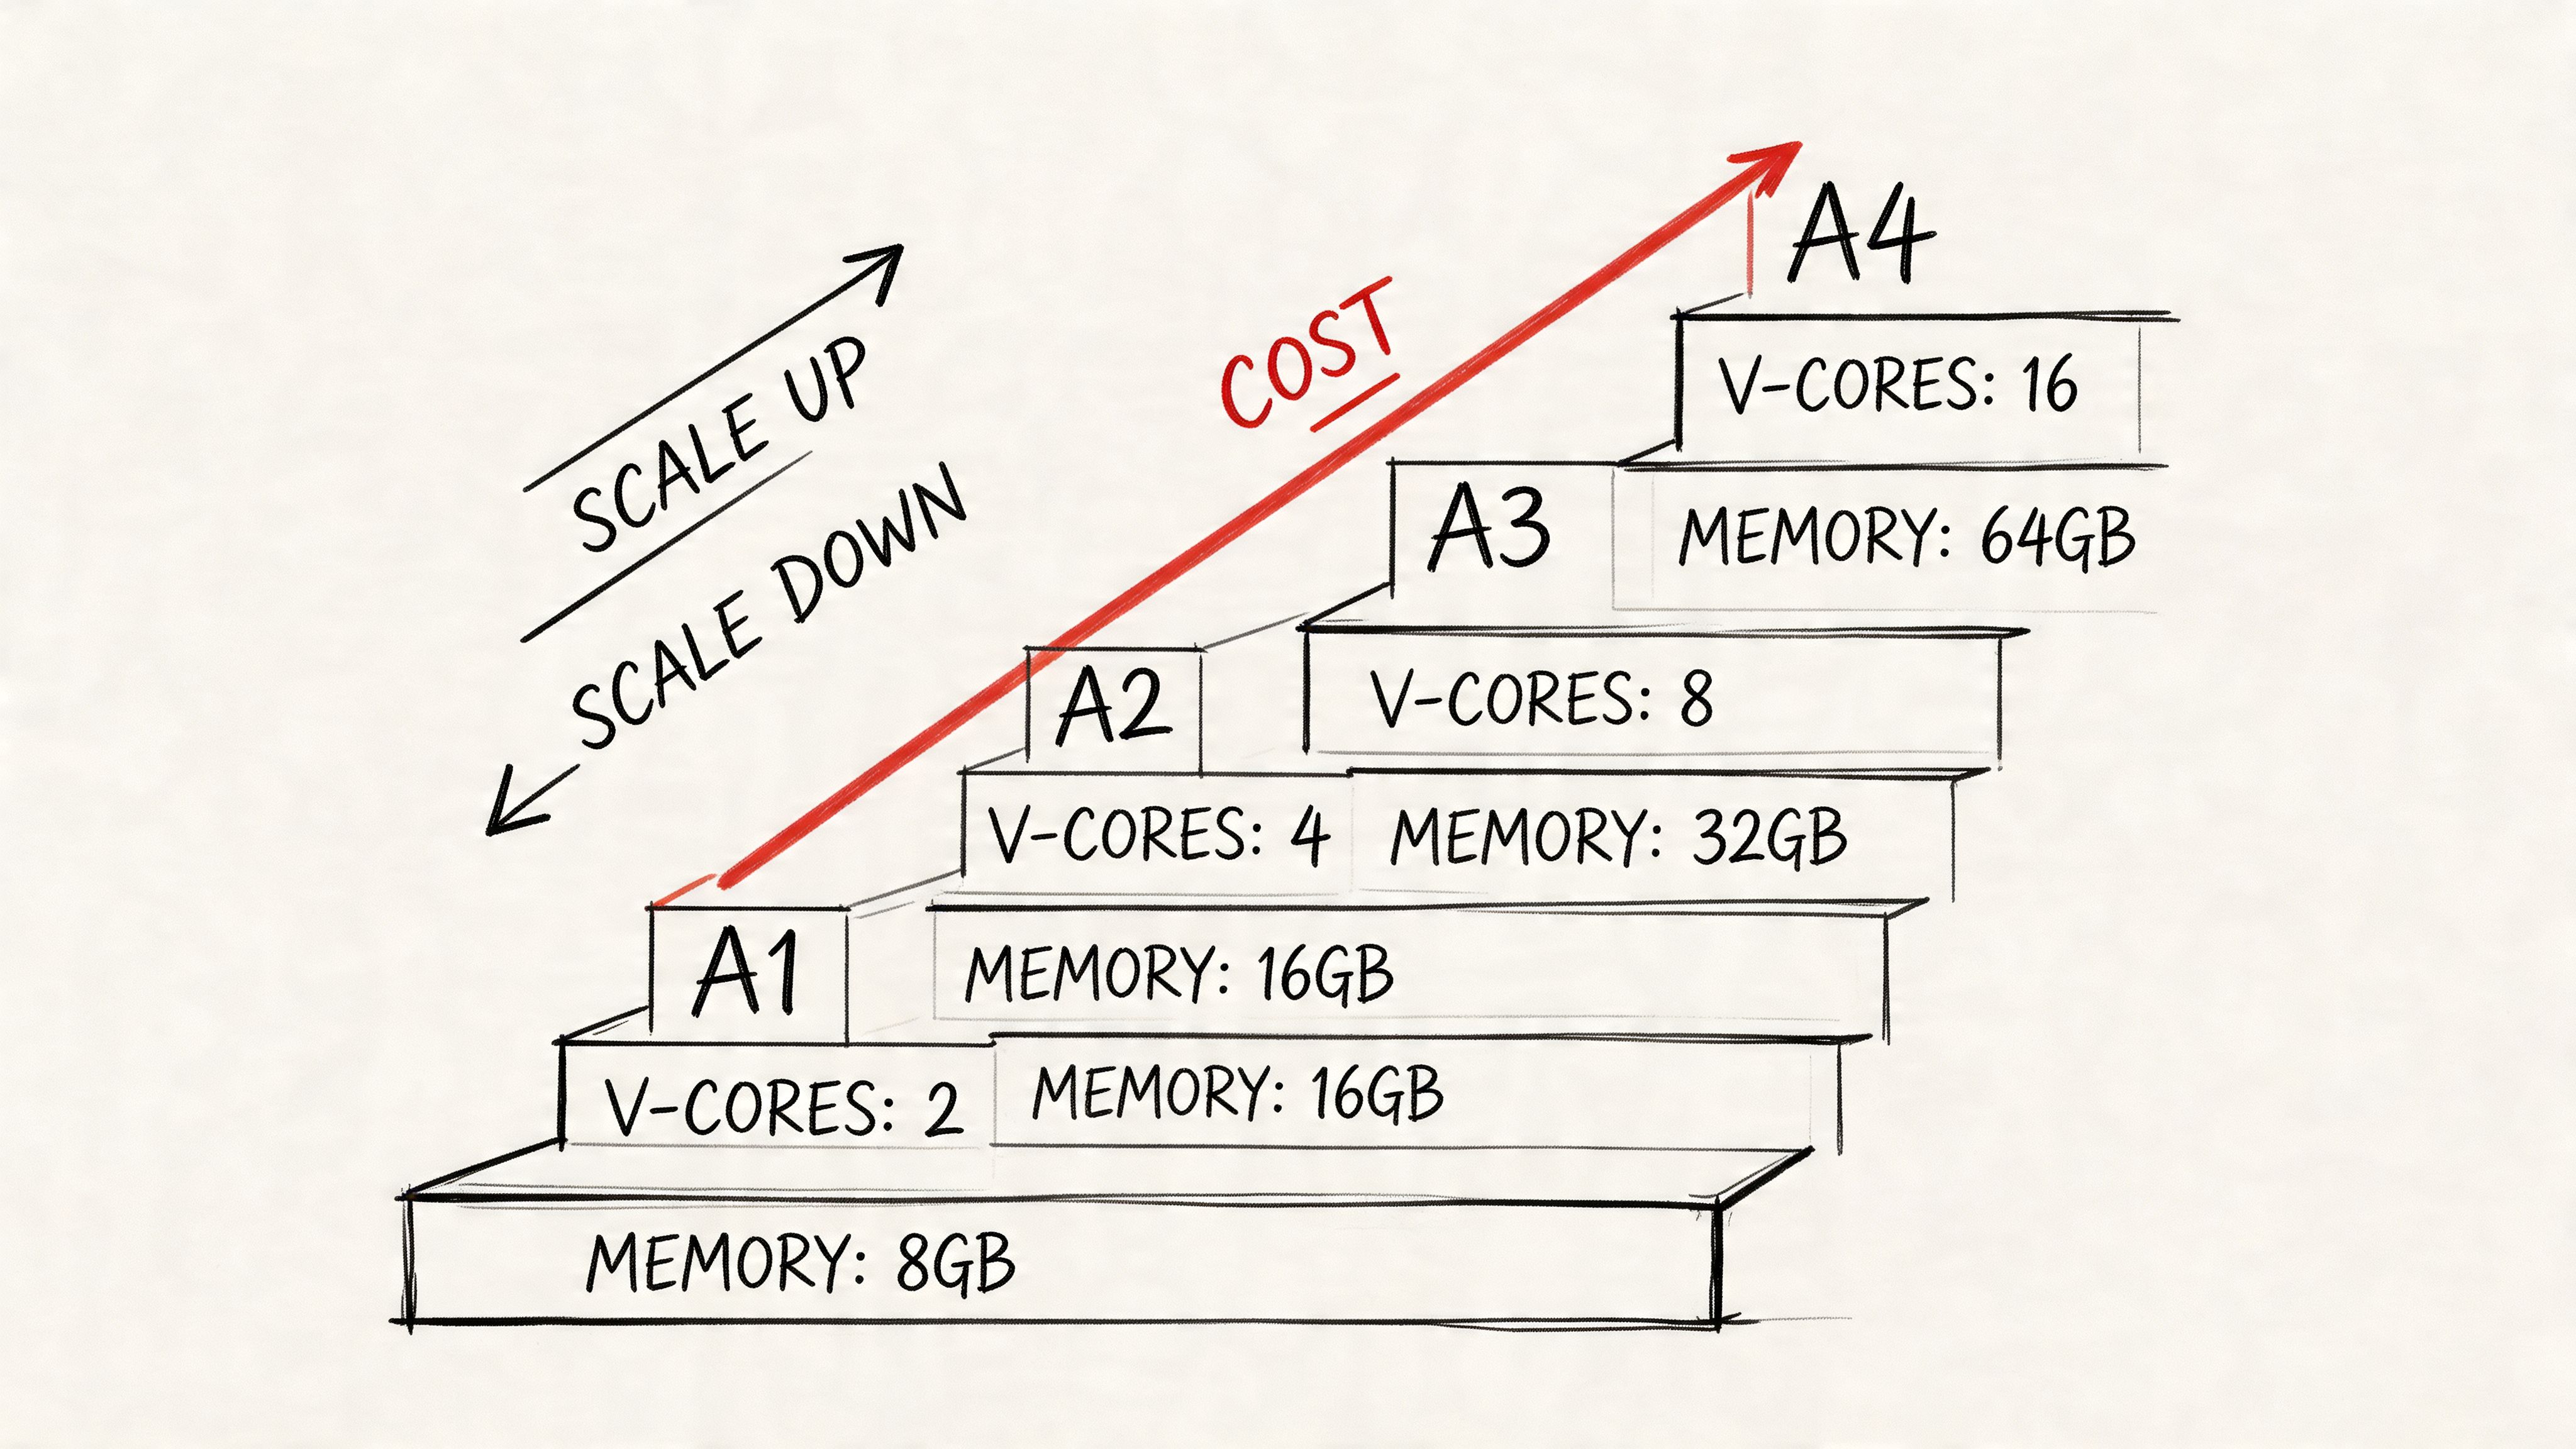
Power BI Embedded pricing is easy to underestimate because the SKU table looks tidy. The operational reality is less tidy. You are buying dedicated capacity, which means you have to forecast demand, absorb idle time, and decide how much performance headroom your product needs.
Microsoft documents the embedded capacity model in its Power BI Embedded capacity documentation. That documentation is the better reference point for planning than marketing-level pricing summaries, because the hard part is not reading the entry price. The hard part is understanding what happens when report usage, refresh activity, and model growth all compete for the same reserved resources.
Capacity pricing changes the cost model
For a SaaS team, the main budgeting shift is simple. Viewer access may not require individual Power BI licenses, but your platform still carries a fixed infrastructure commitment.
That creates a few predictable trade-offs:
If you buy too little capacity, users feel it first through slower loads, queueing, or throttling.
If you buy too much, analytics becomes an always-on fixed cost, even when customer usage is light.
If usage is spiky, the economics get awkward because reserved capacity is a cleaner fit for steady demand than for bursty tenant behavior.
The total cost of ownership starts to matter more than the headline SKU. You are not just paying for compute. You are paying for the people and process needed to monitor capacity, tune models, and decide when scale-up is cheaper than redesign.
The limit that usually catches teams late
In practice, one of the more painful surprises is the per-item memory limit.
Microsoft states in its embedded capacity documentation that capacity tiers come with item-size constraints, and that those limits can block a semantic model or report even when the capacity itself is not fully consumed. That distinction matters. Overall capacity and maximum size for a single model are different controls.
Teams often discover this after a customer asks for more history, more dimensions, or more tenant-specific customization. At that point, the choice is rarely pleasant. You either refactor the model, split workloads apart, or move to a higher tier.
Concern | What it means |
|---|---|
Capacity tier | Sets the compute you reserve for embedded workloads |
Per-item memory cap | Restricts the size of a single semantic model or item |
Scaling up | May remove a bottleneck, but can increase monthly cost quickly |
Model design | Has a direct effect on whether your current tier remains usable |
Here’s a useful walkthrough if you want to see the commercial framing in action:
The bigger issue for modern product teams is flexibility. Power BI Embedded can work well when usage patterns are predictable, models are controlled centrally, and the team accepts Microsoft’s capacity logic as a product constraint. It gets harder when each customer expects deeper customization, faster iteration, or pricing that scales more closely with actual product usage. That is one reason some SaaS teams start evaluating more agile approaches such as Querio. They want fewer capacity planning exercises and less friction between analytics demand and product delivery.
Common Pitfalls and Real-World Challenges
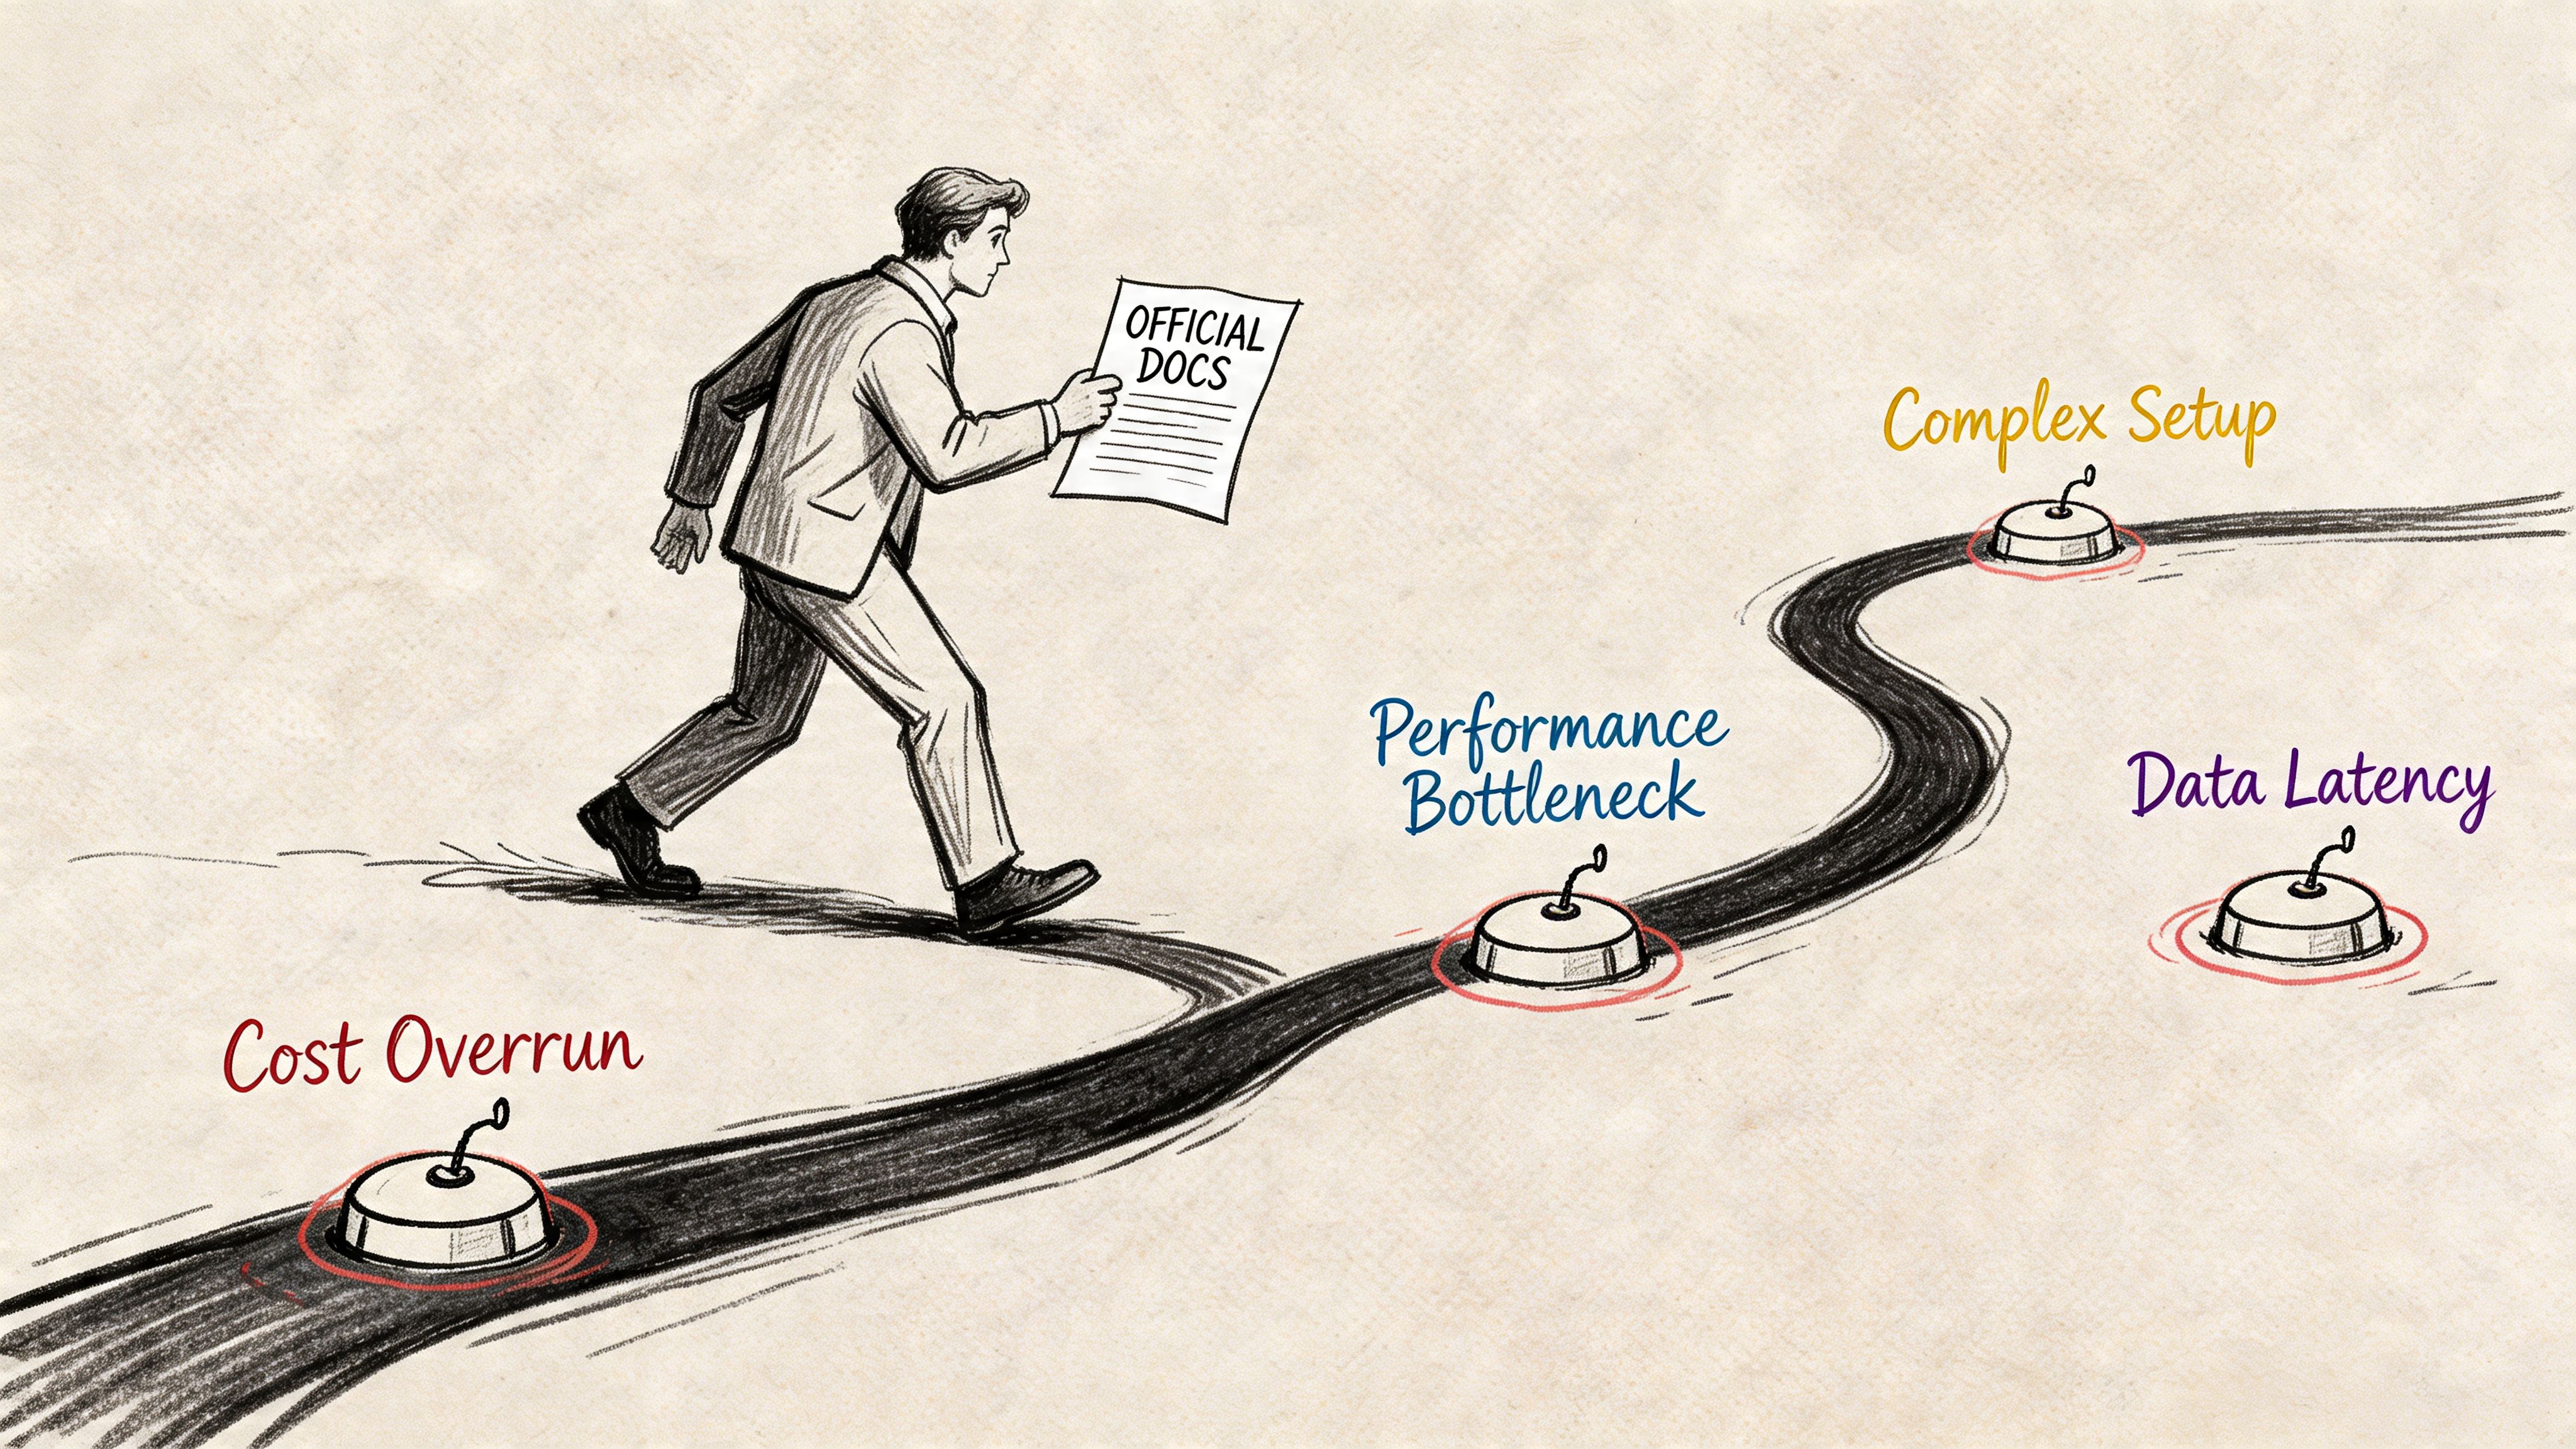
The glossy product story of Power BI Embedded starts to crack. It is often presented as a low-code route to customer-facing analytics. In practice, a lot of the pain lands outside report authoring. It shows up in auth flows, browser behavior, UX compromises, and the amount of platform knowledge your team needs to keep things stable.
Authentication is not a solved problem
One of the most frustrating issues is browser security behavior. Microsoft acknowledges that modern Chromium security updates can disrupt iframe authentication and force repeated logins, and developer discussions show recurring complaints that official guidance is too basic for high-traffic SaaS applications, as noted in Microsoft’s secure embed guidance for Power BI.
That problem matters because embedded analytics lives inside the same customer expectations as the rest of your product. If users hit login loops, popup-blocker friction, or auth failures that only happen in certain browsers, they don’t treat it as a Power BI issue. They treat it as your app being unreliable.
The practical consequences are usually ugly:
Support tickets increase: users report intermittent access problems you can’t always reproduce easily.
Frontend complexity grows: engineers add workarounds around token refresh and iframe behavior.
Trust drops fast: analytics becomes the part of the product that “sometimes breaks.”
If your app needs a seamless, consumer-grade embedded experience, test auth behavior in real browser conditions early. Don’t trust a happy-path development demo.
Why the embedded experience often feels less native than expected
There’s also a branding and UX gap that many teams notice only after implementation begins. Power BI reports are powerful, but they still feel like Power BI reports. You can frame them inside your application, but deep customization is limited compared with a system you build around your own frontend components and query layer.
That becomes more obvious when product teams want:
Tighter white-labeling
Custom drill paths tied to app behavior
Context-aware interactions across the rest of the product
A reporting experience that doesn’t feel like an embedded BI tool
The learning curve is another hidden cost. Developers new to the Microsoft BI stack have to understand Azure capacity, workspaces, embed tokens, model behavior, security roles, and rendering quirks. None of those pieces is impossible. Together, they add friction.
A lot of teams can make Power BI Embedded work. Fewer teams enjoy operating it as part of a fast-moving SaaS product.
Power BI Embedded vs Modern Alternatives like Querio
By the time a team reaches vendor comparison, the issue usually isn’t whether Power BI Embedded is capable. It is. The issue is whether its BI-first architecture matches the product and operating model you want.
A fair comparison starts with the strengths. Power BI Embedded works well when a company is already deep in Microsoft, already building in Power BI, and willing to run customer-facing analytics on dedicated capacity. If your reporting needs map cleanly to embedded dashboards and your team accepts the platform constraints, it can be a solid fit.
Where Power BI Embedded fits best
Power BI Embedded tends to fit best when these conditions are true:
Your reporting team already works in Power BI. Reusing existing authoring skills is a real advantage.
Your customer experience can tolerate an embedded BI feel. Not every product needs custom analytics UX.
Your workload is steady enough for reserved capacity to make sense. Fixed infrastructure is easier to justify when demand is predictable.
Your engineering team can support the integration layer. Someone still has to own auth, tokens, security, and scaling.
That combination is common in larger enterprise environments. It’s less comfortable in leaner SaaS teams trying to move quickly without adopting a full BI platform operating model.
Where modern platforms pull ahead
The main alternatives aren’t just “other dashboard tools.” They’re platforms built around a different philosophy. Instead of centering everything on report embedding, they center analytics on flexibility, code, and direct access to the warehouse with fewer layers between product questions and answers.
That matters if your team wants:
Faster iteration without BI publishing cycles
More control over user experience
A more flexible cost model for changing demand
Analytics workflows that blend exploration, logic, and delivery in one place
There’s also a budget angle. As described in this Power BI Embedded POC reflection, Power BI Embedded removes per-user viewer license costs, but its capacity-based pricing, such as A1 at about $1 per hour, can be hard for startups with variable traffic. That same source also highlights the developer learning curve as a practical barrier.
A side-by-side view makes the trade-offs clearer:
Criterion | Power BI Embedded | Querio (Modern Alternative) |
|---|---|---|
Core model | Embed Power BI reports into your app | Build self-serve analytics directly on the warehouse |
Primary workflow | BI authoring plus developer integration | File-system and notebook-oriented analytics workflow |
Viewer licensing | No Power BI license required for embedded viewers | Not centered on Power BI viewer licensing |
Cost behavior | Capacity-based, requires proactive sizing | More flexible for teams avoiding dedicated embed capacity overhead |
Customization | Strong reporting, limited native-feeling product control | Better suited to custom and iterative analytics experiences |
Developer friction | Higher, especially around auth and embedded operations | Lower for teams that want direct, programmable workflows |
Best fit | Microsoft-heavy teams delivering embedded dashboards | Mid-market teams that want speed, flexibility, and self-serve data work |
If the goal is polished embedded dashboards inside a Microsoft-centric stack, Power BI Embedded is a real contender. If the goal is to make analytics faster, more flexible, and less dependent on a BI platform delivery model, newer approaches often fit better.
If your team wants customer-facing or internal analytics without the usual BI embedding overhead, take a look at Querio. Querio deploys AI coding agents directly on your warehouse so teams can build self-serve analytics, Python notebook workflows, and product-facing data experiences without turning the data team into a human API.

