Finding the Best Power BI Competitors of 2026
Explore the top Power BI competitors with our in-depth comparison. Discover which BI tool is the right fit for your team's specific needs and data strategy.
https://www.youtube.com/watch?v=LQkeY64E830
published
Outrank AI
power bi competitors, business intelligence, data analytics tools, bi comparison
d91c9494-3003-44bc-9dee-139e429dc1d8

For all its strengths, a growing number of companies are starting to feel the limitations of Power BI and are searching for competitors that can offer more speed and genuine self-service analytics. Choosing the right alternative really comes down to your company’s unique goals, where you are in your data journey, and how fast you plan to grow.
Why Smart Companies Look Beyond Power BI
Let's be clear: Microsoft Power BI is a titan in the business intelligence world. Its seamless connection with the Microsoft ecosystem—think Excel, Azure, and Teams—and attractive price point have made it the go-to BI tool for tens of thousands of organizations. In fact, SRAnalytics pegs its market share at 20.06%, with over 65,829 companies confirmed to be using it. You can dig deeper into these BI statistics and market trends on market.us.

But that same mass-market appeal is also its biggest weakness for fast-moving companies. The very design that makes Power BI so accessible can eventually become a source of friction, creating frustrating bottlenecks that get in the way of true agility.
The Challenge of Dashboard Rigidity
The main currency of traditional BI tools, including Power BI, is the dashboard. Dashboards are great for tracking metrics you already know are important, but they’re also inherently static. They serve up a pre-canned view of the data that an analyst has carefully prepared.
This becomes a real problem the moment a business user needs to dig deeper. If a leader has a follow-up question that the dashboard wasn't built to answer, the process grinds to a halt. It usually looks something like this:
Someone submits a new request to the already busy data team.
They wait in line for an analyst to free up.
The analyst has to go back, tweak the data model, and build a new report or visual.
This back-and-forth injects huge delays into the decision-making process. The data team becomes a bottleneck, and critical business questions can take days or weeks to answer. For any company that relies on speed to compete, this workflow just doesn’t cut it.
Seeking True Self-Service Analytics
Most BI tools talk a big game about "self-service," but what they usually mean is giving business users the ability to apply filters to reports that someone else built. True self-service is about empowering non-technical people to ask their own questions, explore the data freely, and find answers without having to write code or wait for an analyst.
The search for a Power BI alternative isn't about criticizing its features. It's a strategic move toward building a more scalable data culture. It's about finding a tool that encourages curiosity and lets everyone make data-driven decisions, not just consume reports.
This is the wall many organizations hit with Power BI. While new features are always being added, the fundamental workflow is still built around analysts producing reports for everyone else to consume. This is precisely why forward-thinking companies are exploring Power BI competitors that offer a more direct and flexible route to insights, moving past rigid dashboards toward a system that actually encourages exploration and reduces the dependency on a handful of data specialists.
An Overview of the Modern BI Landscape
Trying to choose a business intelligence tool today can feel overwhelming. While Microsoft Power BI is often the default choice, the market is filled with excellent alternatives, each built with a different philosophy. To find the right one, you need to look past the marketing and understand how these tools are fundamentally designed.
The global cloud-based BI market is expected to reach $15.2 billion by 2026, growing at an impressive 22.8% CAGR. This isn't just about big corporations; a majority of small and medium-sized businesses now see BI tools as critical infrastructure. As you can see from these BI tool trends from SR Analytics, this demand is fueling a new generation of specialized Power BI competitors that cater to specific needs beyond one-size-fits-all dashboards.
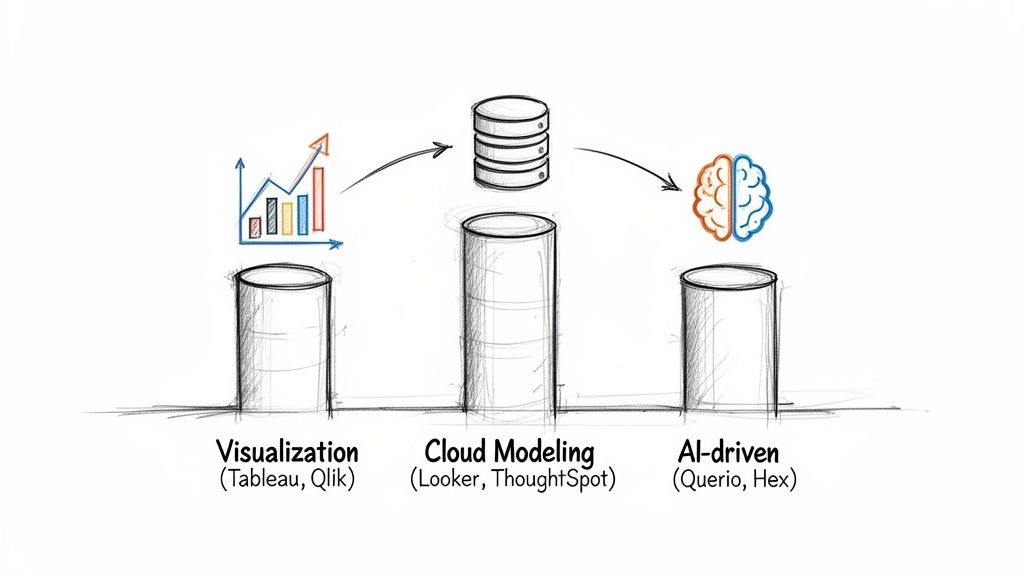
To make sense of the options, I find it helpful to group them into three main categories based on their core approach to data.
Before we dive into the details, here's a quick look at the major players and where they shine. This table should help you quickly get your bearings.
Power BI Competitors At a Glance
Competitor | Core Strength | Ideal For |
|---|---|---|
Tableau | Best-in-class data visualization and storytelling. | Data artists and analysts creating polished, public-facing reports. |
Looker | Centralized, code-based data modeling for governance. | Organizations needing a single source of truth for self-service analytics. |
Querio | AI agents for direct, natural-language data exploration. | Teams that want to empower non-technical users with deep analytics capabilities. |
Qlik | Associative engine for discovering hidden data relationships. | Guided analytics applications where free-form exploration is key. |
ThoughtSpot | Search-based analytics for quick, simple data questions. | Business users who prefer a search bar interface over building dashboards. |
This table provides a high-level summary, but the real value comes from understanding why each tool is built the way it is. Let's explore the three main philosophies driving the market.
The Visualization Giants
This category is dominated by the established leaders, primarily Tableau and Qlik. Their design philosophy is centered on one thing: creating polished, interactive, and visually compelling stories from data.
Tableau is the go-to for data analysts and designers who need to craft beautiful, high-impact visuals. Its drag-and-drop interface is incredibly intuitive for exploring data and building dashboards from the ground up.
Qlik, on the other hand, is famous for its powerful associative engine. This unique feature helps you see connections across all your data, not just what's in your current view, making it great for uncovering unexpected insights.
These tools are at their best when the end product is a finely tuned report or dashboard intended for a wide audience.
The Cloud-Native Modelers
The next group of competitors, led by platforms like Looker (now part of Google Cloud) and ThoughtSpot, decided to tackle a different problem. They shifted the focus from the final chart to the underlying data model, prioritizing governance and consistency above all else.
Looker is the poster child for this approach with its proprietary modeling language, LookML. The idea is simple but powerful: have your data team define all your business logic and metrics in one central place. This ensures that when someone looks at "revenue" or "active users," everyone is using the exact same definition. ThoughtSpot takes a different path to a similar goal, championing search-based analytics that lets anyone ask questions in plain English.
The big idea here is to create a single source of truth. By investing time in a robust, governed data model upfront, these platforms promise to deliver more reliable self-service analytics for the entire company.
The New Wave of AI-Driven Disruptors
Most recently, we've seen the rise of a new breed of BI tools built with AI at their core. Platforms like Querio and Hex aren't just bolting on AI features; they are completely rethinking how people interact with data. You can learn more about how they differ in our complete guide to AI business intelligence tools.
Querio, for example, uses a fundamentally different architecture. Instead of pulling data into a separate BI layer, its AI agents work directly within your data warehouse. Business users can ask complex questions in a flexible, notebook-style interface, and the AI translates those requests into sophisticated analysis on the fly.
This approach transforms the role of a data team. Instead of being stuck in a never-ending loop of building and tweaking reports, they can focus on building a self-serve analytics infrastructure that truly empowers everyone to answer their own questions.
What Features Actually Make a Difference?
When you’re trying to pick the right business intelligence tool, it’s easy to get lost in marketing buzz. Most Power BI competitors will show you slick dashboards and reports, but the real differentiators are buried in the details—the core architecture that dictates how your team will actually work with data day-to-day.
Let’s get past the feature checklists and talk about what really separates the leaders from the pack. We'll look at how Power BI handles things, compare it to major players like Tableau, Looker, and ThoughtSpot, and see how some of the newer, AI-focused tools are changing the game.
Data Connectivity and Integration
A BI tool is only as good as the data it can reach. For organizations built on the Microsoft stack, Power BI is tough to beat. It offers seamless, one-click connections to everything in the Microsoft and Azure ecosystem. If your data lives in Azure Synapse, SQL Server, or even just Excel files, Power BI provides a beautifully frictionless experience.
But here’s the catch: the moment your data stack gets more diverse, things can get a bit clunky. While Power BI has hundreds of connectors, getting it to play nice with sources outside the Microsoft bubble, like Google BigQuery or Amazon Redshift, doesn't always feel as smooth or optimized. This is often where competitors find their opening.
Looker (Google Cloud): It’s no surprise that Looker’s integration with the Google Cloud Platform, especially BigQuery, is phenomenal. Its entire architecture was designed with the modern cloud data warehouse in mind.
Tableau: Long celebrated for its flexibility, Tableau has a well-deserved reputation for connecting to just about any data source you can throw at it while maintaining great performance. This makes it a go-to for companies with a mixed-and-matched data environment.
The takeaway here is that "great connectivity" is entirely dependent on your existing setup. If you're a Microsoft-centric shop, Power BI is the obvious and correct choice. If you have a multi-cloud strategy or use a "best-of-breed" approach for your data tools, you’ll likely find that other platforms offer a smoother ride.
AI and Machine Learning Capabilities
AI isn't just a marketing gimmick in BI anymore; it's a fundamental capability. But how that AI is implemented can create wildly different experiences for your users. Power BI has some neat AI features like "Quick Insights," which automatically finds trends in your data, and a Q&A function for natural language questions. It also lets you plug in models from Azure Machine Learning.
This approach is certainly powerful, but it can feel like a "black box." The AI gives you an answer, but you can’t always see how it got there. For analysts who need to validate the logic or tweak the process, this lack of transparency can be a real roadblock.
Querio takes a completely different, "glass-box" approach. Its AI coding agents generate Python and SQL right in front of you within a notebook interface. This lets technical users see, edit, and build on what the AI created, giving you both the speed of automation and the control of human expertise.
Other tools also have their own spin on AI. ThoughtSpot built its entire platform around a search-based experience that lets you "google" your data. Tableau has introduced "Ask Data" and "Explain Data" to make analysis more approachable. The real difference comes down to control and transparency. For users who just need quick answers, Power BI or ThoughtSpot work great. But for teams that want to work with AI to build custom, sophisticated analyses, a notebook-based tool is far more effective.
Here’s a look at Querio's modern, AI-native interface. It combines a simple, natural language prompt with the power of a full code notebook.
This screenshot shows a user asking a question in plain English. The AI doesn't just produce a chart; it generates the code and visualization, perfectly bridging the gap between a business question and the technical work needed to answer it.
Self-Service Analytics Models
"Self-service" might be the most overused phrase in the BI industry, and what it means in practice varies dramatically from one platform to another. Getting this right is critical to actually empowering your team.
Dashboard-Centric (Power BI & Tableau): In this world, self-service means business users can click around on pre-built dashboards—applying filters, drilling down, and exporting data. This is great for tracking known KPIs, but the minute someone has a new, ad-hoc question the dashboard wasn't designed for, they hit a wall. This creates the classic bottleneck where they have to file a ticket and wait for the data team.
Search-Based (ThoughtSpot): This offers a more dynamic form of self-service. Users type questions into a search bar, and the tool generates new charts on the fly. It's a huge improvement over static dashboards for answering straightforward questions.
AI-Native Notebooks (Querio): This is the next evolution of self-service. By giving users a flexible notebook environment powered by AI agents, even non-technical people can ask complex, multi-part questions and get instant answers. This model is designed to completely eliminate the "I'll have to ask the data team" bottleneck.
Microsoft is starting to move in this direction with its Fabric Notebooks, but for now, they are squarely aimed at data scientists and engineers, not your average business user. If you want to learn more about what separates these approaches, check out our guide on the 10 essential features of modern business intelligence tools.
Embedded Analytics and Developer Experience
Embedding analytics directly into your own product or customer portal is a massive value-add. Power BI Embedded is a solid, capable product, but it's very much designed for the Azure ecosystem. For developers who don't live and breathe Microsoft technologies, it can come with a steep learning curve.
The developer experience is a huge point of differentiation among Power BI competitors. Looker, for instance, is highly praised for its API-first design and its LookML modeling layer, which developers love for building scalable and maintainable embedded solutions.
Querio puts a major emphasis on a developer-friendly embedded SDK built for speed. The entire goal is to let your product team add powerful, AI-driven analytics into your app in a matter of hours, not weeks. It’s designed to be used without needing deep, specialized BI expertise, drastically shortening the time it takes to launch customer-facing data features.
In the end, the best tool depends entirely on your team's skills and priorities. If you’re an Azure-native organization, Power BI Embedded makes perfect sense. But if your top priorities are development speed and flexibility, you’ll find that alternatives with modern SDKs and API-first designs give you a serious edge.
Choosing Your Tool Based on Real-World Use Cases
A side-by-side feature list doesn't tell the whole story. The right analytics tool for you depends entirely on the problems you’re trying to solve day-to-day. What matters most is how a platform’s design fits your team’s workflow and helps you make smarter decisions, faster.
So, let's step away from the spec sheets and walk through a few common business scenarios. This will give you a much clearer picture of which tool is truly the best fit for your specific challenges.
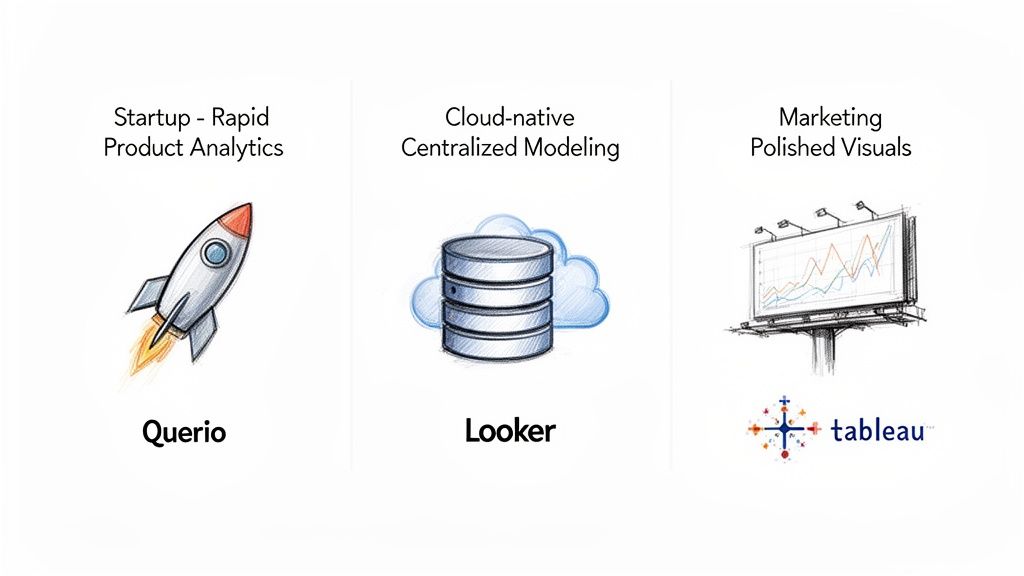
Scenario 1: You Need Rapid Product Analytics Without a Large Data Team
Picture this: you’re a growing company where product and growth teams need to constantly test ideas and understand user behavior. The problem is, your data team is small and buried in requests, creating a massive bottleneck for everyone.
This is exactly where a tool like Querio shines. It’s built from the ground up for self-service analytics, empowering non-technical users to get their own answers.
Instead of filing a ticket and waiting days for a report, a product manager can simply ask Querio’s AI agent, "How did user engagement change for customers who used our new feature last week, segmented by their subscription plan?" The AI handles the complex query generation, turning a multi-day process into a matter of minutes. This completely changes the dynamic, freeing up your data team to focus on building a solid data foundation rather than just churning out reports.
Scenario 2: Your Company Needs Pixel-Perfect Visuals for Marketing
Now, imagine your marketing team is gearing up for a huge campaign. They need to create stunning, public-facing visualizations for your website, an annual report, or a social media blitz. The data has to tell a story that not only informs but also looks incredible and reinforces your brand.
For this job, Tableau is the undisputed leader. It has long been the gold standard for data artistry.
Tableau’s real power is its near-infinite flexibility in visual design. It gives analysts granular control over every single element—from fonts and colors to layout and interactivity. While other tools produce perfectly fine charts, Tableau allows designers to craft bespoke data stories that are both beautiful and deeply insightful. When presentation quality is non-negotiable, it's the obvious choice.
Scenario 3: You Run on Google Cloud and Require Centralized Governance
Let's say your organization is all-in on the Google Cloud Platform, and most of your data lives in BigQuery. Your top priority is establishing a single source of truth for every business metric to ensure everyone, in every department, is speaking the same language.
In this environment, Looker (now part of Google Cloud) is the natural fit. Its entire architecture is designed for this exact purpose.
Looker's secret sauce is its LookML modeling layer. This is where your data team defines all business logic, calculations, and data relationships in one central, version-controlled repository. Once that model is built, business users can explore data with total confidence, knowing that a metric like "monthly recurring revenue" means the same thing for sales, marketing, and finance. This "govern-from-the-center" philosophy is perfect for companies that need scalable and reliable analytics. You can explore a variety of other examples of business intelligence to see how different tools solve different problems.
Scenario 4: You Need to Optimize Internal Reporting for Your SME
Here’s a final scenario: you're a small-to-medium enterprise that runs on the Microsoft ecosystem for everything from finance to sales. The main goal is to get standard internal reports out faster and get a better handle on operational KPIs without breaking the bank.
This is Power BI's home turf. It excels at delivering quick, tangible returns in this kind of setup.
For SMEs, particularly in manufacturing or professional services, Power BI has been shown to deliver a 366% ROI by speeding up report creation and cutting down data prep time. It’s an impressive figure, but it’s based on a traditional BI model. If the real cost driver for your business is the analyst bottleneck, the ROI calculation changes. This is where Power BI competitors like Querio offer a different kind of return by fundamentally scaling the impact of your existing data team. Learn more about how Power BI delivers value for SMEs on techcronus.com.
Evaluating Total Cost of Ownership Beyond the License
That $10 per user per month price for Power BI looks great on a spreadsheet. It’s an easy number to get approved. But anyone who has managed a data stack knows that the initial license fee is just the cover charge—the real costs show up later.
To make a sound investment, you have to look past the sticker price and calculate the Total Cost of Ownership (TCO). This means accounting for all the "soft costs" that don’t appear on the initial invoice but can quietly drain your budget over time.
Uncovering the Hidden Costs
When you’re weighing Power BI competitors, you need to be honest about what it really takes to keep the lights on. The expenses you don't see at first are often the ones that hurt the most.
Implementation and Setup: Getting a BI tool off the ground is never just a simple install. It involves paying consultants, training your team, and dedicating valuable engineering hours just to connect it to your data sources.
Ongoing Maintenance: This is the big one. With traditional tools like Power BI, every new metric request or broken dashboard becomes a ticket in the data team's backlog. Those engineering and analyst salaries add up fast.
Vendor Lock-In: Once you’re deep into the Microsoft ecosystem, it’s tough to get out. The more you build around the Azure stack, the more painful and expensive it becomes to switch platforms if your needs evolve.
These expenses give you a much more realistic view of what you'll actually spend. If you want to dig deeper into this, we've broken down the numbers in our guide to the total cost and ROI of data analysis tools.
The Opportunity Cost of Bottlenecks
The most significant expense isn't even financial—it's the opportunity cost of moving slowly. When your marketing manager or sales lead has to wait two weeks for a simple report update, the business loses its agility. Opportunities pass by while you’re waiting for answers.
This delay is a direct symptom of the old BI model, where a handful of data specialists are expected to serve the entire organization's needs. The time your analysts spend building and fixing basic reports is time they can't spend on the strategic work that actually moves the needle.
In an agile business, the cost of a delayed insight is often far greater than the cost of a software license. A tool that creates analysis backlogs is actively slowing down your growth.
This is where you see the true TCO of different tools come into focus. When a platform like Querio uses AI agents to let non-technical people get their own answers, you’re not just saving on engineering overhead. You’re fundamentally changing the speed at which your entire company operates, which delivers a far greater return on your investment.
A Decision Framework for Picking Your BI Tool
Picking the right BI tool isn't about finding a universal "best." It’s about finding the right fit for your company’s culture, goals, and technical reality. Instead of getting bogged down in an endless feature-for-feature showdown, the smart move is to step back and ask some fundamental questions about what you truly need.
Honestly mapping out your answers will point you directly to the right Power BI competitors for your situation. Think of this as an internal audit—it's easily the most important part of the entire selection process.
Key Strategic Questions to Ask
What's your main analytics goal? Are you trying to nail down operational reporting by tracking the KPIs you already know are important? Or is your focus on strategic exploration—digging for the unknown insights that could change the game? The first points toward a classic dashboarding tool, while the second requires a platform built for discovery.
Who really needs the data? Is it for your business teams who need fast answers to everyday questions? Is it for data analysts tasked with building out complex, governed models? Or is it for product managers who need to iterate on user behavior data at a moment's notice? Your answer changes everything.
How mature is your data stack? Are you all-in on a single ecosystem like Microsoft Azure? Or are you running a more modern, best-of-breed setup across multiple clouds? This is a huge factor in determining how much flexibility you'll need for data connections and integration.
What's your take on vendor lock-in? How critical is it for your team to stay agile and retain the freedom to switch tools if your needs change down the road? This question hits right at the heart of your long-term Total Cost of Ownership (TCO).
The flowchart below shows why thinking about TCO is so important. The initial sticker price is rarely the full story.
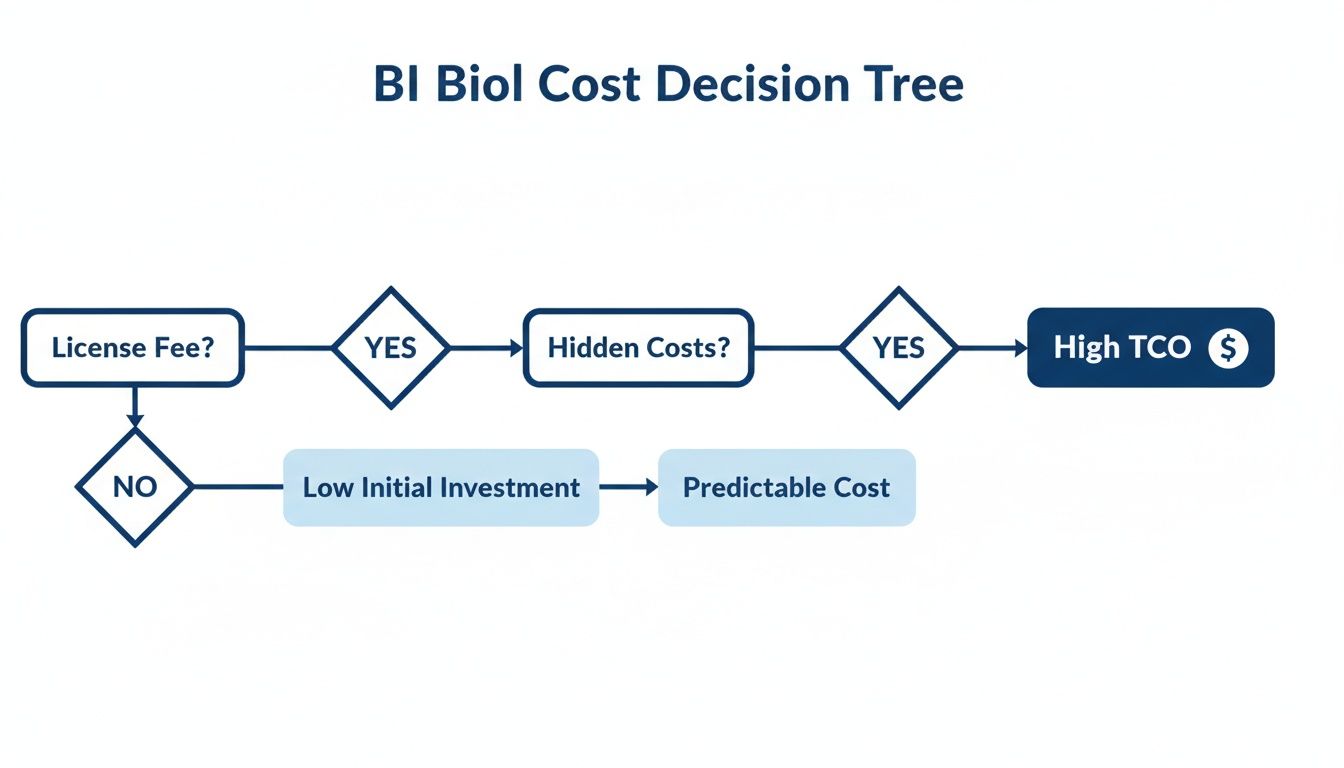
As you can see, what starts as a reasonable license fee can quickly balloon into a much higher TCO once you account for all the hidden costs of maintenance, specialized engineering, and lengthy implementation projects.
Mapping Your Needs to the Right Tool
If your answers are pointing you away from traditional dashboards and toward a more agile, self-serve model that frees up your data team, then you’re probably looking for a new generation of BI tool. To help finalize your choice, a thorough business intelligence software comparison can offer deeper insights into the specific strengths and weaknesses of different platforms.
For fast-moving companies that want to scale their data insights without having to scale their data team headcount, the path forward is clear. You have to move beyond the dashboard bottleneck.
This is exactly where Querio comes in. By deploying AI agents directly onto your data warehouse, it delivers a true self-service experience. This approach puts data into the hands of your entire organization, letting your data team shift their focus from building one-off reports to driving real, strategic growth.
Common Questions About Power BI Alternatives
When you start looking for alternatives to Power BI, a few key questions always come up. We've heard them all, so here are some straightforward answers based on our experience helping teams navigate this decision.
What's the Best Free Alternative to Power BI?
For teams on a tight budget or individuals just getting their feet wet, Google Looker Studio is hard to beat. It’s completely free and connects seamlessly with other Google tools like BigQuery and Sheets. You can build some surprisingly solid visualizations without spending a dime.
Just know what you're getting into. Looker Studio doesn't have the robust data modeling or enterprise-level security and governance features you’d find in a paid platform. It's a great starting point, but growing teams often hit its limits.
Is Tableau Easier to Learn Than Power BI?
This is the classic "it depends" question, but the answer really hinges on your background.
Tableau often feels more intuitive to people who think visually—designers, analysts, and anyone who wants to create complex, beautiful charts with a drag-and-drop interface. If you've never touched a BI tool before, many find Tableau's canvas more approachable.
On the other hand, anyone who lives and breathes Excel will feel right at home in Power BI. The interface, formulas (DAX), and data modeling concepts are very familiar, which can make the initial learning curve feel much shorter for business users with a strong spreadsheet background.
The decision-making process here has a lot in common with other technical choices. It's useful to think about the principles for choosing a monitoring tool, including its total cost of ownership, because the "easiest" tool isn't always the one with the lowest upfront learning curve but the one that fits your team's skills best in the long run.
How Are Modern Tools Like Querio Different?
The biggest difference is the entire workflow. Traditional tools like Power BI are fundamentally about the dashboard. An analyst builds a data model, creates a set of static reports, and then business users can filter and view them. The problem is that the moment a new, unexpected question comes up, it creates a bottleneck.
Querio completely flips this around. Instead of a fixed dashboard, it deploys AI agents that operate directly on your data warehouse. This means anyone on the team, technical or not, can ask new questions and get answers in a flexible notebook format. You effectively bypass the old dashboard request queue. It changes the data team's job from being report builders to being enablers of genuine self-service.
Ready to eliminate analytics bottlenecks and empower your team with true self-service? Querio deploys AI agents directly on your data warehouse, enabling anyone to get answers in minutes, not weeks. Learn more about Querio.

