Top Examples of Semi Structured Data: Unlock Insights
Discover 8 key examples of semi structured data, from JSON and XML to logs. Learn to analyze and unlock insights with modern data warehousing.
https://www.youtube.com/watch?v=YwP8JLKKbU0
published
Outrank AI
examples of semi structured data, semi structured data, data analysis, data engineering, json vs xml
13b77f75-eea7-496b-b3f1-0db087d54dcf

Most lists of examples of semi structured data stop at naming JSON and XML, then move on. That misses the part data teams struggle with: deciding what to do when a source is only partly predictable, changes shape every week, and still needs to land in a warehouse where people can query it without filing tickets.
That gap matters because a huge share of enterprise information doesn't arrive as clean relational tables. One widely cited estimate says roughly 90% of enterprise data is unstructured, which is exactly why semi-structured formats became so important. They give teams enough organization to ingest, validate, and analyze messy operational data without forcing every source into a rigid schema on day one.
In practice, the most valuable data often shows up in API payloads, web events, HTML pages, logs, emails, and application documents. These sources usually contain keys, tags, metadata, or timestamps, but they also contain optional fields, nested objects, inconsistent records, and free text. That's why treating semi-structured data as just a storage problem doesn't work. It's an analysis design problem.
The good news is that modern warehouses and notebook workflows handle this far better than old ETL-first stacks did. If your team can land raw payloads, explore them with Python and SQL, and publish cleaned views back into the warehouse, you can move from “messy source” to “actionable model” much faster.
Table of Contents
8. Unstructured Text with Metadata (Emails, Documents, User-Generated Content)
From Chaos to Clarity: Your Strategy for Semi-Structured Data
1. JSON (JavaScript Object Notation)
JSON is the first format that comes to mind, and for good reason. It became a classic semi-structured format because it preserves machine-readable organization through keys, arrays, and nested objects while still allowing records to vary across events or entities, as noted in Snowflake's overview of structured, semi-structured, and unstructured data. That combination is why APIs, product telemetry, and application payloads lean on it so heavily.
Real examples are everywhere. Slack API responses can bundle users, channels, and message metadata in one payload. Stripe webhooks often include a stable event envelope with variable nested fields inside data.object. Product catalogs also fit naturally in JSON because one item might have size and color while another has dimensions and battery_life.
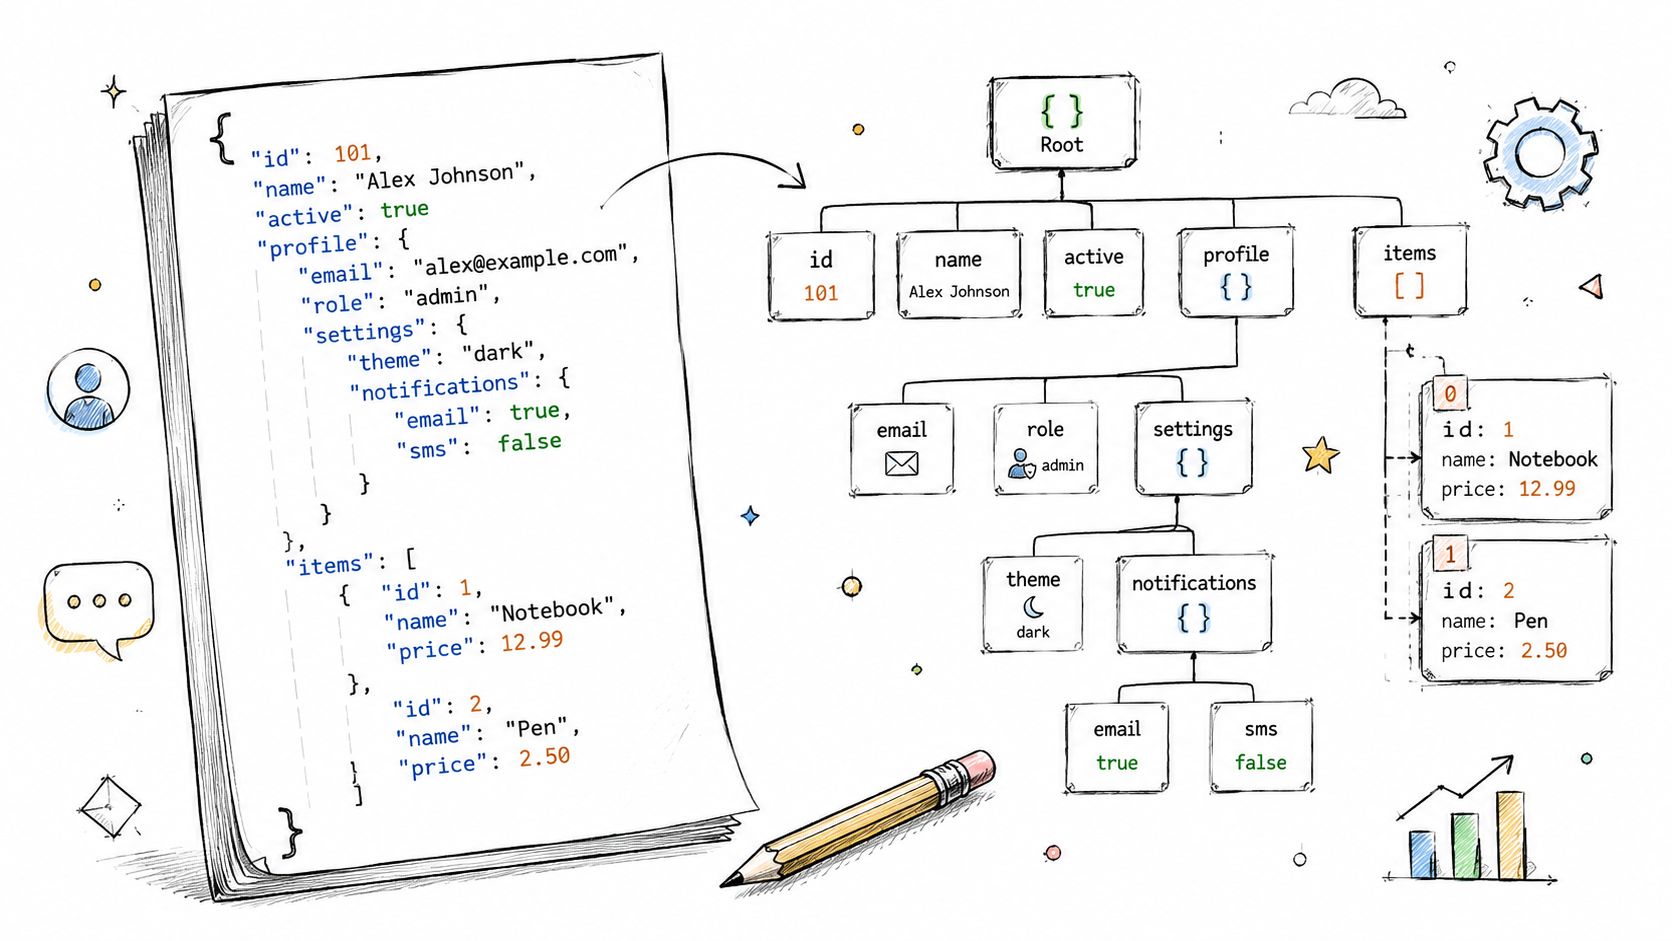
Why JSON became the default
JSON works because source systems change faster than data models. Product teams add fields. Vendors rename properties. Event payloads gain optional arrays. A rigid table breaks every time this happens. JSON doesn't.
The mistake is leaving everything nested forever. Raw JSON is fine for ingestion, but self-serve analytics suffers when every question requires custom path extraction and repeated flattening logic.
Practical rule: Store the raw payload, then publish warehouse views that expose the fields people actually filter, group, and join on.
How to work with JSON in a warehouse notebook flow
The cleanest pattern is simple. Land the raw payload in a semi-structured column, inspect it in a notebook, identify stable keys, then write flattening SQL or Python transforms that create analysis-friendly views.
A good setup usually includes:
Raw preservation: Keep the original API or webhook payload untouched for replay, debugging, and backfills.
Selective flattening: Pull out high-value fields like event type, user ID, status, and timestamps into top-level columns.
Schema monitoring: Validate common keys so analysts don't discover drift only after dashboards break.
Notebook utilities: Use Python's
jsonlibrary orjq-style transformations for ad hoc investigation before formalizing logic.
If your team is doing this repeatedly, your warehouse modeling choices matter as much as the parser. A solid approach to layered modeling, naming, and reusable transformations makes semi-structured inputs much easier to operationalize, proving the worth of data modeling best practices.
One more operational reality: JSON often becomes the bridge between spreadsheets and formal payment or banking workflows. Teams moving operational data into financial formats sometimes start from tabular exports and convert into machine-readable payloads or XML outputs to manage SEPA payments efficiently.
2. XML (Extensible Markup Language)
Why does XML keep showing up in modern data stacks long after teams say they have moved on from it? Because the systems that depend on strict message contracts, hierarchical records, and validation rules still use it heavily.
XML is a textbook example of semi-structured data. It has explicit tags and nesting, but it also allows optional elements, repeated groups, attributes, and namespace-specific extensions. The W3C describes XML as a structured markup language for documents and data exchange, which is exactly why it sits between rigid tables and free-form text in real pipelines, as defined in the W3C XML overview.
The practical point for data teams is simple. XML carries business-critical data, but it rarely arrives in a shape analysts want to query.
Where XML still shows up
XML remains common in enterprise integrations, payment and invoicing workflows, healthcare messaging, publishing feeds, and SOAP-based APIs. In these systems, the structure is deliberate. Teams use XML because they need named elements, ordered hierarchies, validation against schemas, and compatibility with older vendor platforms.
That discipline helps upstream producers. It creates friction downstream.
Namespaces complicate parsing. Attributes and child elements can represent the same business concept in different feeds. Large XML exports can be expensive to process if the ingestion job reads the whole document into memory. Analysts also run into a familiar warehouse problem. A single XML document may contain one customer, ten invoices, or hundreds of nested line items, so the path from raw payload to usable fact table is not automatic.
XML works well as an interchange format. It usually needs reshaping before it works well for analytics.
How to handle XML in a warehouse notebook workflow
The pattern that works is narrower than many teams expect. Keep the raw document, validate the parts that matter, and extract only the elements tied to reporting, joins, or downstream models.
A notebook-based workflow usually looks like this:
Validate against known structure: If the source provides an XSD or a stable contract, check it during ingestion so malformed files fail before they pollute downstream tables.
Inspect real variability: Use XPath, Python's
lxml, or ElementTree in a notebook to see which tags are stable and which appear only for edge cases.Map repeated nodes carefully: Split repeating sections such as line items, diagnoses, or payment instructions into child tables keyed back to the parent document ID.
Preserve the source document: Store the raw XML for audit trails, reprocessing, and contract disputes with upstream systems.
Publish analyst-friendly outputs: Expose typed columns and cleaned table names instead of forcing every consumer to write long XPath expressions.
One trade-off matters more than teams expect. Full normalization sounds disciplined, but it often creates dozens of low-value tables that no one queries. I have had better results starting from the business question, then extracting only the stable paths needed for that use case. If finance needs invoice totals and due dates, parse those first. If operations later needs line-level exceptions, add the child-table logic then.
For large files, streaming parsers are usually the right call. DOM-style parsing is convenient for exploration, but it breaks down on bulky exports and scheduled backfills. Use notebook exploration to identify the structure, then move production parsing into a repeatable ingestion step that can handle scale without memory issues.
A final practical note. Converting XML to JSON after ingestion can make downstream work easier, especially in warehouses with stronger JSON functions than XML support. That conversion helps with ad hoc analysis, but it should not replace source preservation. Keep the original XML whenever the document itself has legal, compliance, or operational value.
3. Log Files and Event Streams
Logs are where a lot of teams first discover the limits of tidy schemas. A web server log might always have a timestamp and status code, but the message body, attributes, and event payload can vary wildly by service, deployment, or release.
That's why logs are one of the strongest real-world examples of semi structured data. In large-scale systems such as Splunk, semi-structured data has been used to index and analyze massive heterogeneous datasets by combining fixed metadata with variable event payloads, as described in the USENIX paper on Splunk.
A quick visual overview helps if your team is newer to this pattern.
Why logs are semi-structured in practice
Application logs, clickstream events, cloud audit logs, and database query logs all share the same pattern. There's usually a stable shell such as timestamp, service, host, environment, or event name. Inside that shell, the payload shifts.
For example, an checkout_completed event may always have a user identifier and event time, but line items, discount metadata, device attributes, and campaign parameters might appear only sometimes. That's semi-structured behavior, even if the event source looks disciplined from the outside.
A better notebook pattern for log analysis
The best analysis pattern is to split logs into two layers. First, keep the raw event or message. Second, extract a consistent set of operational columns so you can filter and aggregate fast.
In practice, that means:
Core parsed columns: Timestamp, level, service, event name, request ID, and user or account key when available.
Payload retention: Keep the original message or JSON blob for debugging and exploratory queries.
Cost control: Sample noisy classes of logs when they're not analytically useful, and archive old raw data to cheaper storage.
Reusable notebooks: Build small Python helpers for regex parsing, JSON extraction, and anomaly inspection.
Teams get better results when they model logs as operational evidence first and dashboard inputs second.
What doesn't work is forcing all logs into one universal schema. Security logs, product events, and infrastructure logs serve different jobs. Give them a shared envelope, then model them separately where needed.
4. CSV and Delimited Text Files
CSV looks structured because it has rows and columns. In practice, it often isn't. Headers drift. Rows have missing cells. Quoting rules break. A field suddenly contains embedded commas or line breaks because someone exported from Excel instead of the system integration.
This is one of the most overlooked examples of semi structured data. Multiple sources explicitly call out ambiguous cases like CSV files with inconsistent rows as semi-structured in real-world usage, not just pristine examples from tutorials, as discussed in Atlan's write-up on semi-structured data.

Why CSV is often only semi-structured
Business teams export CSVs from CRMs, finance tools, survey platforms, and ecommerce systems all the time. Those files may look relational, but they usually lack enforced types, constraints, nested support, and stable contracts. One month's “amount” column is numeric. The next month it contains currency symbols and notes.
That's why CSV pipelines fail in such boring ways. Not because CSV is complex, but because everyone assumes it's simple.
The warehouse-first way to tame CSVs
The answer isn't to ban CSV. It's to treat every incoming file as untrusted until validated.
A practical loading pattern includes:
Typed staging: Load into a staging table or notebook dataframe without assuming final data types.
Strict parsing libraries: Use
pandas, DuckDB, or warehouse-native loaders instead of splitting strings manually.Schema checks: Validate headers, nullability, date parsing, and duplicate keys before publishing to downstream models.
Format conversion: Convert frequently reused CSVs into Parquet or warehouse tables once they pass validation.
I've seen more time wasted on malformed CSV imports than on some API integrations. The teams that handle this well build a repeatable intake script, publish a clean conformed table, and never let analysts query the raw upload folder directly.
5. NoSQL Document Databases (MongoDB, DynamoDB, Firebase)
Document databases are built for semi-structured workloads. That's the point. Instead of forcing every record to share one rigid table definition, they let each document carry its own fields, nested objects, and optional attributes.
This pattern shows up in SaaS products constantly. A user profile in MongoDB might include billing fields for one account, collaboration settings for another, and experiment assignments for a third. Product catalogs work the same way. A shoe and a laptop shouldn't have identical attribute sets.
Why document stores fit semi-structured workloads
MongoDB, DynamoDB, and Firebase all make it easy for product teams to move fast. You can ship new fields without a migration-heavy relational design process. That helps operational systems evolve, but it can create a mess for analytics if no one defines downstream contracts.
The common failure mode is querying the operational document store directly for business reporting. That's convenient at first and painful later.
What to export and what to leave alone
For analysis, export document snapshots or event-driven changes into the warehouse. Then flatten the recurring dimensions and measures people care about, such as account plan, country, product category, or feature flags. Leave highly irregular subdocuments available in raw form for deeper investigation.
A practical pattern looks like this:
Batch or stream into the warehouse: Use native exports or connectors rather than running ad hoc analytics against production systems.
Promote common fields: Pull frequently used keys into typed columns.
Track missingness intentionally: Optional fields are normal in document stores. Monitor them instead of pretending they don't exist.
Denormalize where useful: The analytics layer often benefits from a wider table than the operational application does.
Teams comparing relational and document-style workloads usually end up needing both. The need for both makes understanding SQL and NoSQL database queries less academic and more practical. You're not choosing a winner. You're choosing the right place to do each kind of work.
6. Markup Languages with Embedded Data (HTML, YAML, TOML)
This category gets ignored because it doesn't fit the beginner checklist. But these formats show up constantly in operational work, especially when teams scrape websites, inspect app configs, or parse developer tooling outputs.
HTML, in particular, is a classic semi-structured format alongside JSON and XML. It preserves machine-readable organization through tags and hierarchy while mixing in content that's irregular, nested, and noisy.
The ambiguous formats teams overlook
HTML pages can include product titles, prices, metadata tags, breadcrumbs, schema markup, and custom data-* attributes all in one document. YAML and TOML are less about web content and more about configuration, but they have the same analytical shape: labeled fields, nested structures, and optional sections that vary by environment or project.
These are the sources that often confuse teams during ingestion. Are they data or documents? Usually both.
The practical question isn't whether a format is “purely” semi-structured. It's whether it carries enough predictable markers to parse reliably.
Parsing strategy that actually holds up
If you need warehouse-ready analysis from these formats, parse them in layers. Extract stable metadata first. Keep content and irregular sections available separately.
That usually means:
HTML extraction: Use Beautiful Soup or similar parsers to target schema markup, canonical tags, headings, and data attributes rather than scraping raw text blindly.
YAML and TOML parsing: Treat config files as structured metadata sources, especially for deployment settings, package definitions, or feature flags.
Notebook documentation: Save parsing assumptions next to the code so another analyst can rerun the same extraction logic later.
Validation: Check for required fields before promoting extracted values into business-facing models.
What doesn't scale is one-off scraping logic hidden in someone's local script. If the extraction matters, put it in a reproducible notebook or pipeline and publish the output into the warehouse.
7. Time-Series Data and Metrics
Time-series data surprises people on lists like this because it sounds more structured than semi-structured. But in real systems, metrics rarely arrive as just a timestamp and a number. They usually arrive with tags, dimensions, labels, source metadata, and optional attributes that vary by service, environment, device, or event source.
That makes time-series one of the more practical examples of semi structured data, especially in modern observability and product analytics systems.
Why time-series data belongs on this list
Prometheus metrics, IoT sensor readings, app performance events, and internal business metrics all share the same pattern. They're anchored by time, but the dimensional context can expand or contract depending on the source. One metric point may carry region and service labels. Another may add host, pod, feature flag, or campaign context.
This is exactly the sort of flexible, hierarchical, partly standardized data shape that semi-structured systems handle well.
How to make time-series usable for analysis
The biggest mistake is storing every metric as raw event detail forever and expecting warehouse users to figure it out later. Analysts usually need a few stable views: daily aggregates, rolling windows, anomaly candidates, and drill-down paths into the underlying tagged data.
Good practice usually includes:
Time partitioning: Organize by day or month so warehouse scans stay efficient.
Dimension promotion: Pull common labels into top-level fields for grouping and filtering.
Reusable notebook functions: Standardize rolling averages, lag comparisons, and time-window summaries instead of rewriting them each time.
Materialized outputs: Publish common aggregations for dashboards while preserving raw metric detail for investigations.
If your team leans heavily on these workflows, it helps to formalize the analytical patterns rather than leaving them in ad hoc SQL snippets. A practical place to start is time series analysis in Python, especially if your warehouse workflow already includes notebooks.
8. Unstructured Text with Metadata (Emails, Documents, User-Generated Content)
Teams blur the line between unstructured and semi-structured data. The body text may be free-form, but the surrounding headers and metadata create a strong analytical scaffold.
Emails are the clearest example. They usually contain sender, recipient, subject, thread ID, timestamp, and attachment metadata plus an unstructured body. The same pattern appears in support tickets, product reviews, survey comments, and social posts with engagement metadata.

Why text with metadata is semi-structured
The useful trick is to stop arguing about whether the text itself is structured. It isn't. But the record often is.
An email archive can be filtered by sender domain, reply time, or mailbox before anyone touches the body text. A support dataset can be grouped by tag, priority, plan tier, and resolution status while still preserving the original message. That's enough structure to support serious analysis.
A practical notebook workflow for text analysis
For warehouse work, split metadata and body content deliberately. Put the fields analysts filter on into typed columns. Keep the raw text in a separate field or related table. Then use notebooks to add derived features like topic labels, keyword hits, cluster IDs, or embeddings if your stack supports them.
A strong workflow usually includes:
Metadata first: Extract sender, author, timestamp, category, language, tags, and record IDs into structured columns.
Privacy handling: Hash or redact sensitive values before wider analysis access.
Text enrichment: Run NLP pipelines for classification, search support, or thematic grouping.
Combined querying: Let people filter on metadata in SQL, then inspect or summarize the related text in notebooks.
Notebook-based analysis proves especially useful. SQL can narrow the universe. Python can handle tokenization, topic extraction, and text cleaning. If your team wants a practical bridge from warehouse tables to language-oriented workflows, natural language processing for business is the relevant next step.
Semi‑Structured Data, Comparison of 8 Examples
Data Type / Source | Implementation complexity | Resource requirements | Expected outcomes | Ideal use cases | Key advantages |
|---|---|---|---|---|---|
JSON (JavaScript Object Notation) | Low, easy parsing; nested structures can add complexity | Moderate, text-based parsing libs widely available | Flexible, fast integration for semi-structured analytics | APIs, webhooks, product/event data, ad-hoc analysis | Human-readable, widely supported, schema-flexible |
XML (Extensible Markup Language) | Medium–High, XSD, namespaces and validation add complexity | Higher, verbose format, slower parsing, validation tooling | Validated, well-documented enterprise-grade data interchange | Financial messages, healthcare records, legacy enterprise integrations | Strong schema validation, extensive tooling and standards |
Log Files & Event Streams | Medium, ingestion, parsing and normalization needed | High, high-volume storage, indexing, streaming infrastructure | Real-time monitoring, behavioral analytics, troubleshooting | Observability, clickstream, APM, event-driven analytics | Timestamped context, real-time insights, captures edge cases |
CSV & Delimited Text Files | Low, simple to generate/consume but edge cases exist | Low, compact plain text; minimal tooling required | Quick ad-hoc queries and manual inspection | Exports/imports, spreadsheet workflows, simple reports | Simple, portable, universally supported |
NoSQL Document Databases (MongoDB, DynamoDB, Firebase) | Medium, schema-less design but query/scale trade-offs | Variable, horizontal scalability; can be costly at scale | Rapid development and flexible schemas; often requires exports for analytics | User profiles, product catalogs, real-time app data | Schema flexibility, nested document support, horizontal scale |
Markup & Config (HTML, YAML, TOML) | Medium, requires specific parsers (DOM, YAML/TOML) | Low–Moderate, text parsing overhead, small files typical | Readable configs and extracted metadata for downstream analysis | Configuration management, web scraping, metadata extraction | Human-friendly syntax, good for configs and embedded data |
Time-Series Data & Metrics | Medium, partitioning and time-window logic needed | High, large volumes, retention and indexing strategies | Trend analysis, forecasting, anomaly detection | Monitoring, business metrics, IoT, financial time-series | Optimized for time-range queries, forecasting and aggregation |
Unstructured Text with Metadata (Emails, Docs, UGC) | Medium–High, requires NLP and text processing pipelines | High, storage for text and compute for NLP/ML models | Qualitative insights: sentiment, topics, intent classification | Support tickets, reviews, emails, social media analysis | Rich contextual insights, enables NLP-driven segmentation and analysis |
From Chaos to Clarity: Your Strategy for Semi-Structured Data
What do data teams do when the warehouse is full of useful data that no one can query reliably yet?
The answer is rarely another round of heavy modeling up front. Semi-structured data changes the order of operations. Teams get better results when they preserve the raw payload, expose the fields people need first, and turn repeated parsing logic into shared warehouse views or notebook workflows. That is how JSON events, XML exports, application logs, uploaded CSVs, and text records move from awkward inputs to trusted analysis assets.
This shift reflects how modern systems produce data. APIs emit nested objects. SaaS platforms export records with optional fields. Event pipelines capture payloads that change over time. Cloud data warehouses now support native handling for nested and semi-structured types, which makes it practical to query raw records before every edge case is fully normalized. Snowflake, for example, documents direct support for semi-structured data through types such as VARIANT, OBJECT, and ARRAY, plus SQL functions for extraction and transformation: Snowflake semi-structured data documentation.
For data teams, the operating model should be simple and disciplined:
Land raw data unchanged.
Keep raw and curated layers separate.
Promote high-value fields into typed columns.
Use notebooks to inspect anomalies, test parsing logic, and write the cleaned result back to the warehouse.
Standardize the transformations that answer recurring business questions.
That middle layer matters because both extremes create problems. Full flattening strips out context that analysts later need, such as nested attributes, arrays, or changing schemas. Leaving everything raw pushes parsing work onto every downstream user, which turns simple analysis into repetitive cleanup.
I have seen the pattern work best when teams treat notebooks as the workshop, not the final destination. Analysts use Python and SQL to inspect malformed records, compare schema versions, and test extraction logic against real edge cases. Once the logic stabilizes, they publish a view or table that others can trust. That keeps experimentation close to the data without turning production reporting into a collection of one-off scripts.
A notebook-based layer on top of the warehouse can help here. Querio is one option in that category. It supports Python notebook workflows on warehouse data, which fits the iterative querying, parsing, and transformation work that semi-structured analysis usually requires.
The practical starting point is small. Pick one source that creates recurring friction, often JSON events or support data. Define the raw table, identify the fields that matter for one decision, write parsing logic in a notebook, and publish a clean view with documented assumptions. Repeat that pattern a few times and semi-structured data stops feeling chaotic. It becomes part of the normal analytics workflow.
Querio helps teams analyze messy warehouse data with notebook-based workflows and AI coding agents, so analysts, product teams, and business users can move from raw semi-structured inputs to usable models faster. If you want a practical way to explore and operationalize these formats, take a look at Querio.

