Master Data Modeling Programs & Advanced Paradigms
Master data modeling programs from fundamentals to advanced paradigms. Discover top tools & how new notebook systems are transforming data work.
https://www.youtube.com/watch?v=CUR6rKrIEGc
published
Outrank AI
data modeling programs, data modeling tools, data architecture, startup analytics, querio
e99fb0fa-2eb2-4a69-b793-82a07c705f54

Your company probably has three versions of revenue, two definitions of an active user, and one analyst who gets pinged every time a leader asks a basic question.
The data sits everywhere. Product events live in one system. Billing data lives in another. CRM fields were renamed twice. Customer success exports a spreadsheet every Monday because nobody trusts the dashboard. The warehouse exists, but it feels more like a storage locker than an operating system.
That’s when teams start looking into data modeling programs. Not because they suddenly love diagrams, but because chaos has become expensive. Every ad hoc query takes too long. Every board deck starts with a metrics debate. Every new dashboard creates one more fragile interpretation of the business.
Data modeling has been trying to solve this problem for decades. Foundational programs like Genstat, SAS, and SPSS emerged between 1968 and the early 1970s and changed how structured data could be handled in practice, laying groundwork that still shapes modern analytics. SAS’s successor footprint is still huge, with over 20 million users worldwide reported for 2023 in this history of statistical computing. That history matters because it explains why so many older data workflows feel formal, centralized, and rigid.
Startups rarely have the luxury to work that way.
They need standards, but they also need speed. They need enough structure to stop metric drift, but not so much process that every schema decision turns into a committee exercise. This is the current conversation around data modeling programs today. Not whether modeling matters. It does. The question is how much modeling to do, when to do it, and which parts can wait until the business needs them.
Your Data Is Chaos What Now
A familiar startup pattern looks like this.
Sales closes deals in a CRM. Product tracks engagement in an event pipeline. Finance keeps the billing truth in a separate system. Support data is half structured, half notes. Marketing adds campaign data from several platforms. Then leadership asks a simple question like, “Which customer segments upgrade fastest after onboarding?”
Nobody can answer it cleanly.
The data team pulls exports, joins inconsistent IDs, patches missing values, and sends a CSV with caveats. A week later, someone asks the same question with a slightly different date range, and the whole process starts over. At that point, the problem isn’t reporting. It’s structure.
When the warehouse becomes a junk drawer
Most fast-growing teams don’t start with a clean model. They start with urgency. Ship the app. Instrument the event. Sync the tool. Load the table. That’s rational early on, but the result is usually a warehouse full of tables that reflect source systems rather than business concepts.
You end up with records that answer “where did this data come from?” but not “how should the company use it?” Those are different questions.
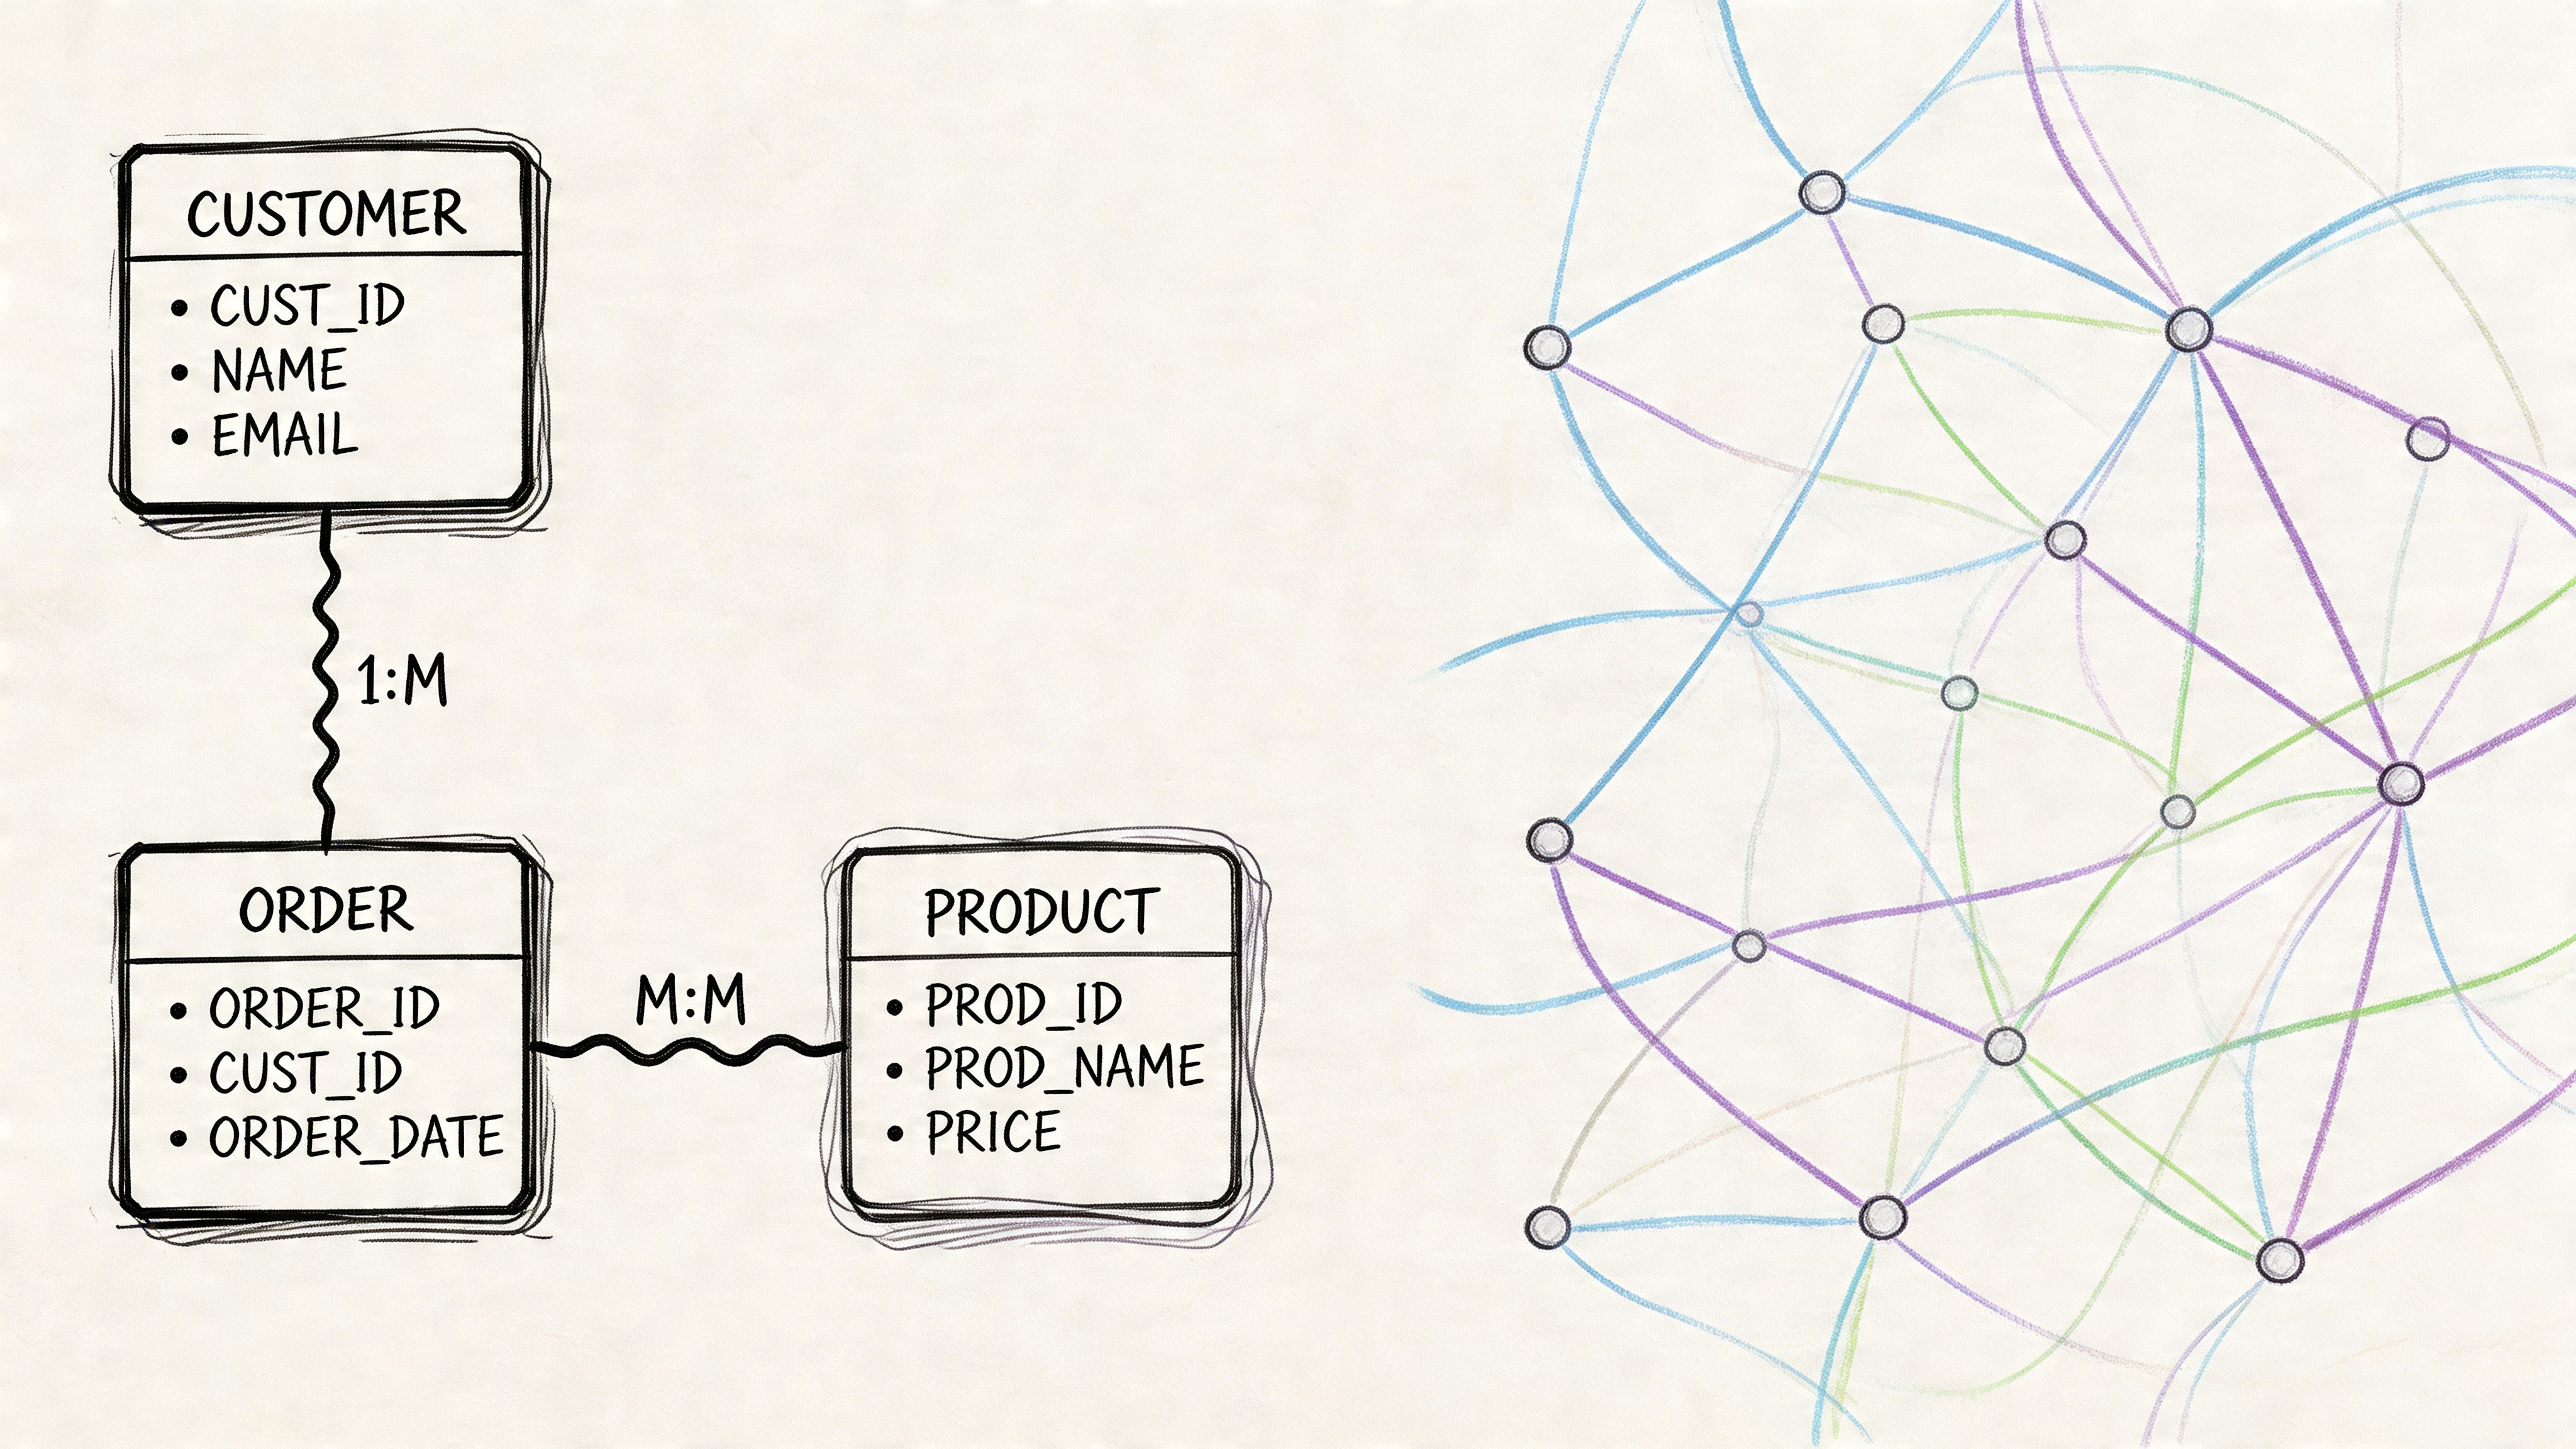
Data modeling is the discipline that bridges that gap. It turns raw system outputs into something people can reason about. Customer, subscription, invoice, activation event, account owner. These aren’t just table names. They’re shared business objects with rules, definitions, and relationships.
Practical rule: If every important metric still depends on one person remembering which tables to join, you don’t have a data access problem. You have a modeling problem.
Order first, polish later
The mistake many teams make is assuming data modeling means months of upfront architecture work. It doesn’t have to. Good modeling starts with reducing ambiguity in the questions people ask most often.
That might mean standardizing event names. It might mean creating one trusted customer grain. It might mean documenting why one revenue table should drive reporting while another should not. Before you buy software or redraw schemas, fix the recurring confusion.
If your source data is already messy, clean-up work comes before elegance. This guide on how to clean up data is a useful companion because no model survives bad source assumptions for long.
The Three Layers of Data Modeling Explained
Most arguments about modeling happen because people are talking about different layers of the same problem.
An executive says, “We need a customer model.” An analyst thinks about definitions. An engineer thinks about tables. A platform lead thinks about partitioning, indexes, and storage. They’re not disagreeing. They’re working at different altitudes.
The clearest way to understand data modeling programs is to separate the work into conceptual, logical, and physical models.
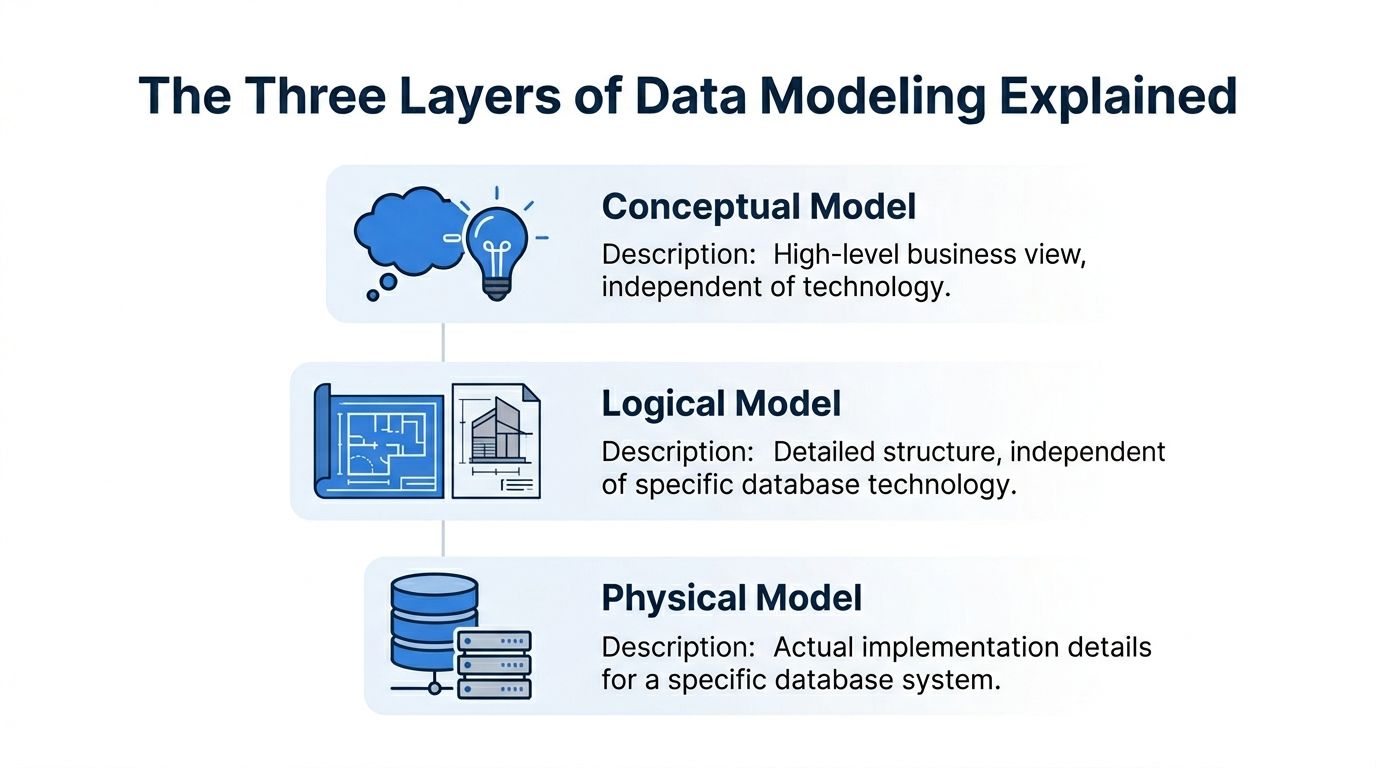
Conceptual model
Think of this as the architect’s sketch for a house.
You’re not choosing pipe materials or electrical layouts yet. You’re deciding what the house is for and what rooms it needs. In data terms, the conceptual model captures the major business entities and how they relate. Customer. Order. Subscription. Product. Account manager.
This layer is for alignment. It helps business and technical teams agree on what exists in the business and what matters.
A good conceptual model answers questions like:
What are the core entities: Which business objects should exist regardless of system boundaries?
How do they relate: Does a customer own many subscriptions, or does an account map to many customers?
What language should everyone use: Are “workspace,” “account,” and “organization” the same thing or not?
At this point, teams prevent vocabulary drift. If you skip it, every downstream artifact inherits ambiguity.
Logical model
Now you move from sketch to blueprint.
The logical model defines the structure in more detail, but it still stays independent of a specific database platform. You identify attributes, relationships, keys, and cardinality. You decide whether one thing is optional, many-to-many, slowly changing, or derived.
If the conceptual model says a business has “customers” and “subscriptions,” the logical model says what qualifies as each, how they connect, and what fields matter.
A strong logical model usually covers:
Entities and attributes such as customer_id, signup_date, plan_type
Relationships such as one account having many subscriptions
Business rules such as whether a canceled subscription remains analytically active for retention reporting
Normalization choices to reduce duplication before implementation concerns enter
This is the layer where disagreements become useful. Teams are forced to confront edge cases before they become production confusion.
A logical model should be stable enough to survive tool changes, but flexible enough to reflect changing business rules.
Physical model
The physical model is the contractor’s build plan.
Here you commit to a specific database system and make implementation choices. Table names, column types, indexes, partitions, clustering, constraints, and generated SQL all live here. At this stage, performance, cost, and platform limitations start shaping the design.
A physical model answers practical questions:
Question | Example of a physical decision |
|---|---|
How is the table stored | Partition by event_date |
What data types are used | Numeric for amount, timestamp for event time |
How are joins supported | Surrogate keys or natural keys |
How is query speed improved | Denormalized reporting tables or materialized views |
This is also where teams often confuse implementation with design. They model around today’s BI tool, or around one dashboard, and then call it architecture. That usually creates brittle systems.
Why the three layers matter in practice
When startups move fast, they often collapse all three layers into one SQL transformation. That’s understandable, but it causes trouble later. Business definitions get buried inside dbt models or dashboard logic. Engineers optimize storage before anyone has agreed on meaning. Analysts reverse-engineer intent from table names.
The cleanest workflows keep the layers distinct, even if the artifacts are lightweight.
If you’re working toward shared definitions across reports, metrics, and exploration tools, a semantic layer becomes the bridge between logical business meaning and physical implementation. That’s often where modern teams regain consistency without forcing every user to understand warehouse internals.
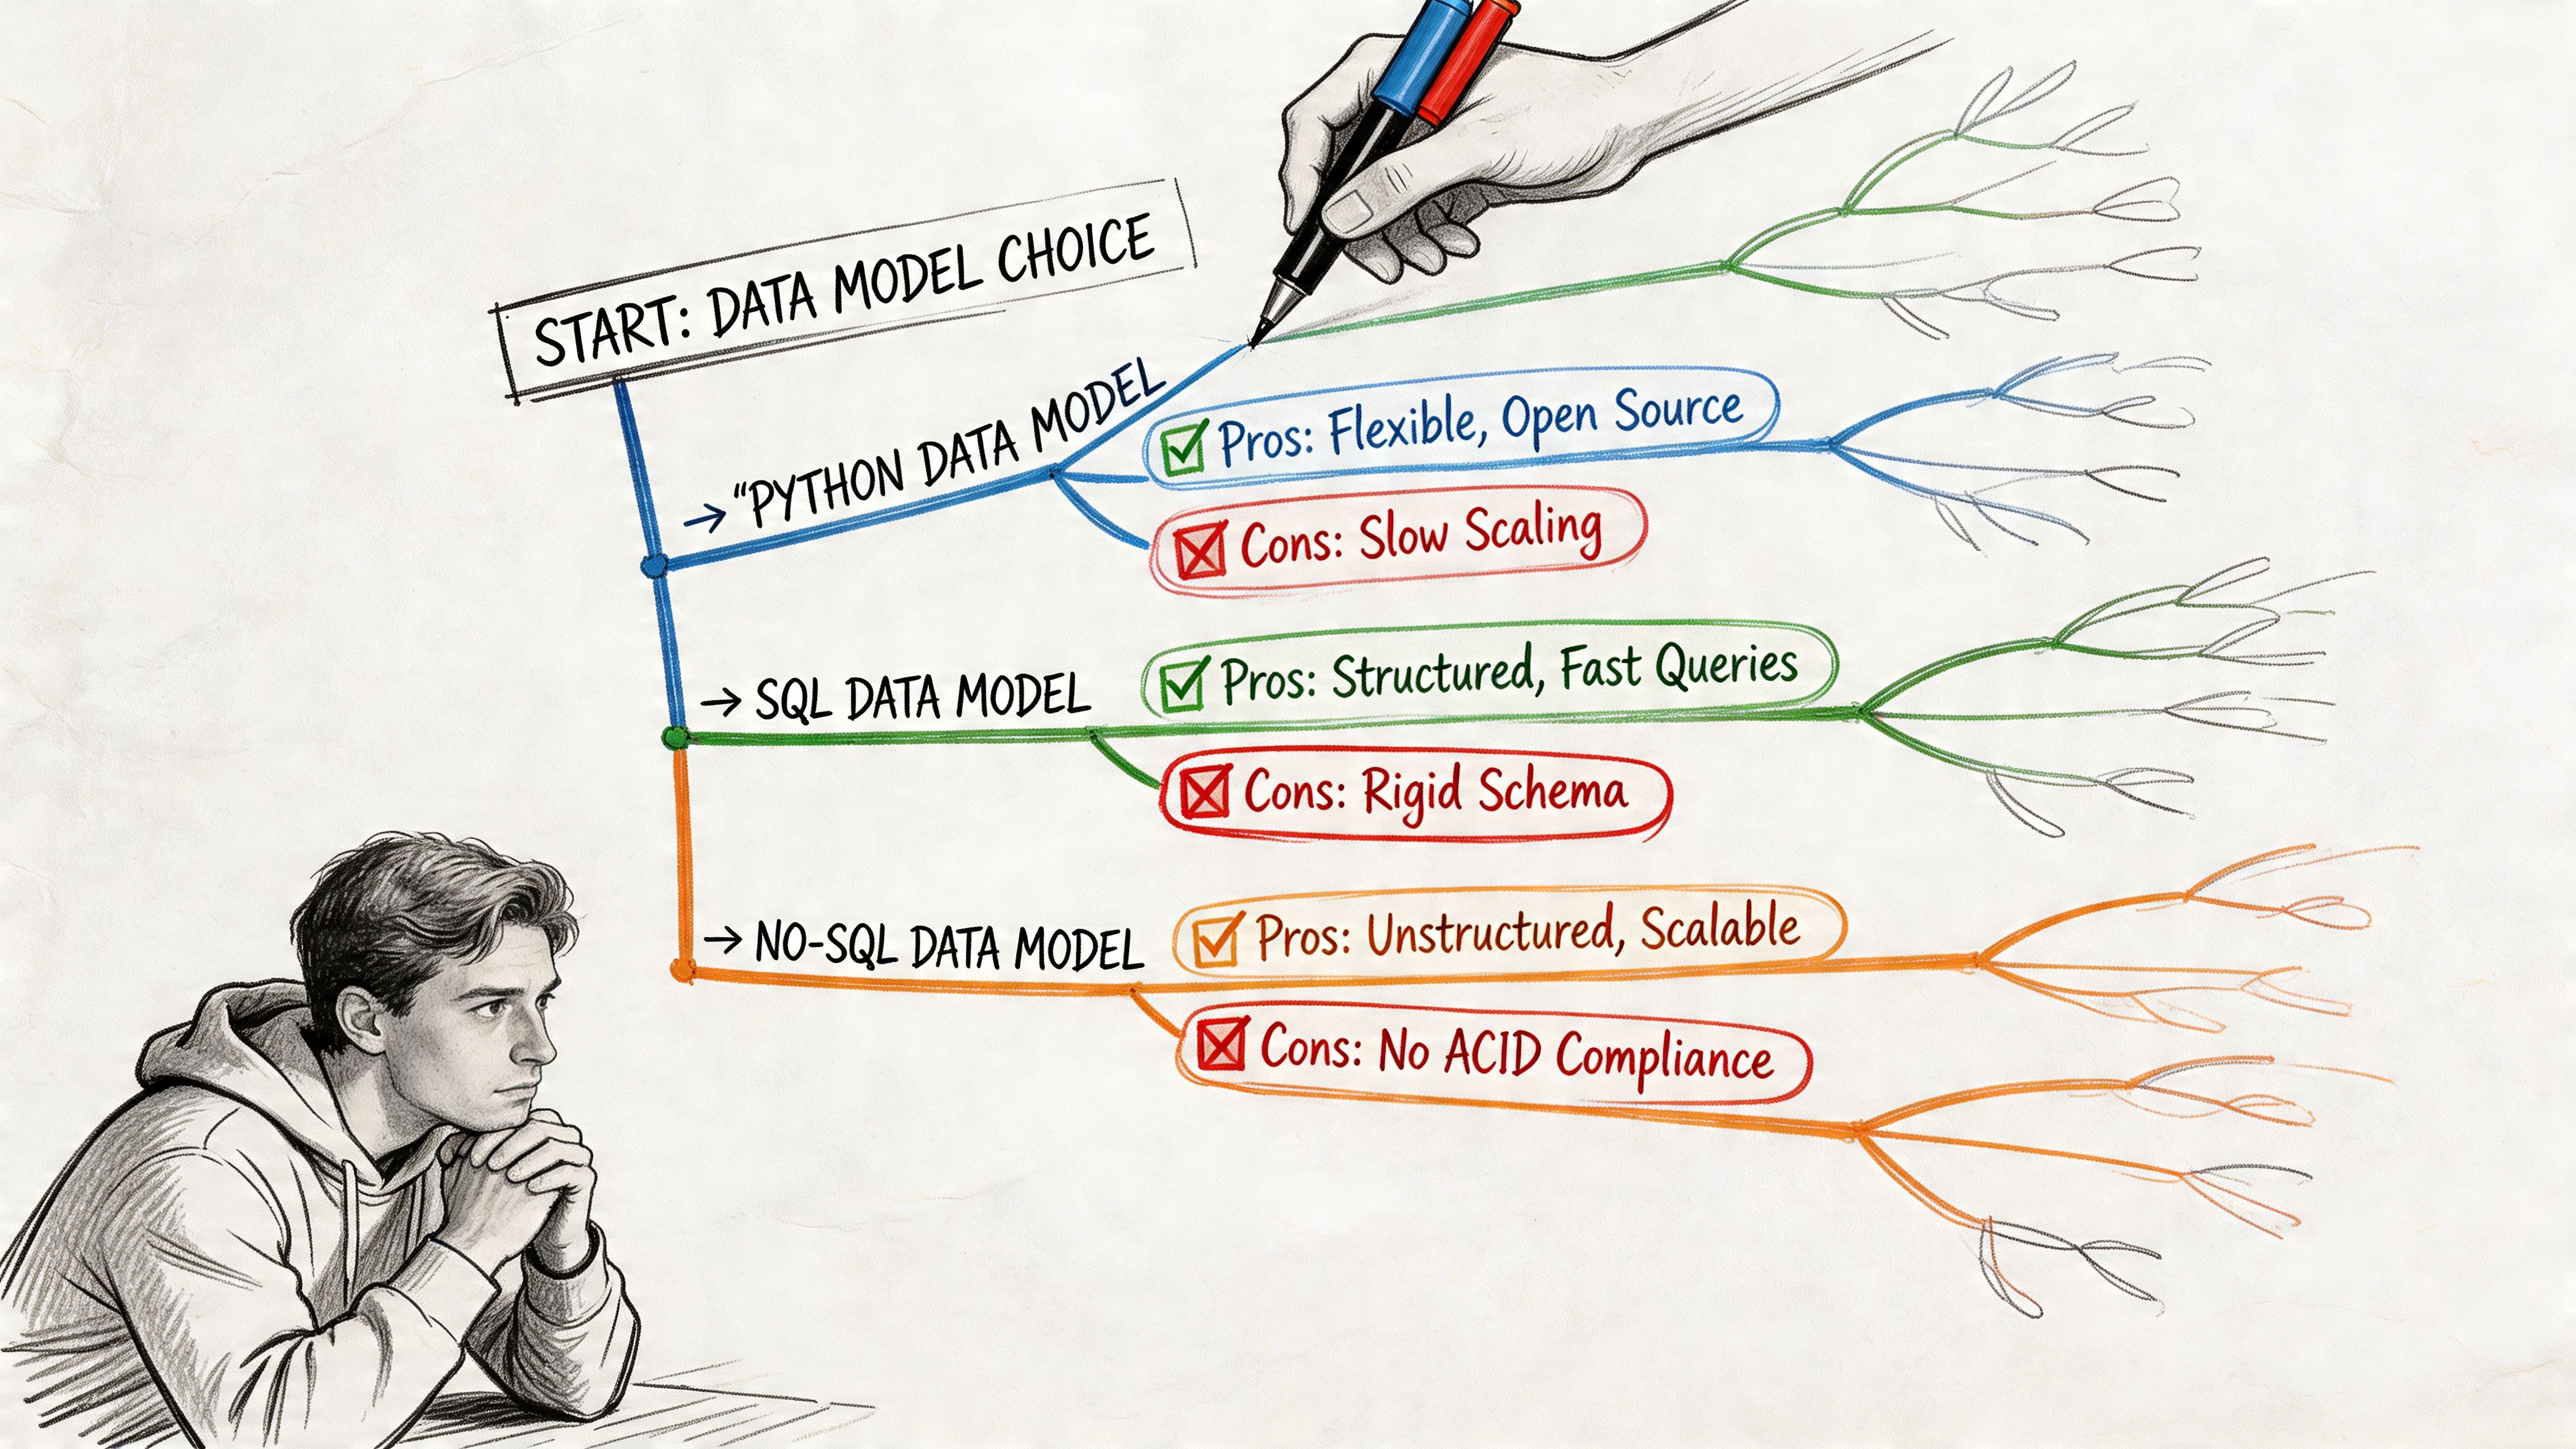
Choosing Your Blueprint Common Modeling Paradigms
Once the three layers are clear, the next decision is architectural style, prompting teams to usually ask which model they should build.
There isn’t one universal answer. Different approaches optimize for different constraints. Some favor fast analytics. Others favor auditability. Others try to unify many systems under one canonical structure. The right choice depends less on doctrine and more on your operating reality.
The larger database world still rests on the relational model proposed by Edgar F. Codd in 1970, which became the foundation for over 80% of enterprise databases according to this history of data modeling. Later approaches such as Kimball dimensional modeling in the 1990s and Data Vault in the 2000s built on that foundation for different business goals.
The short version
Paradigm | Primary Goal | Best For |
|---|---|---|
Dimensional Modeling | Fast, intuitive analytics | BI dashboards, reporting, business users |
Data Vault | Auditability and scalable historical tracking | Complex enterprises, regulated environments, multi-source ingestion |
Canonical Data Modeling | Shared enterprise-wide meaning | Organizations trying to unify concepts across many systems |
Dimensional modeling for speed
Dimensional modeling is the workhorse of analytics teams because it makes data easier to query and easier to explain. Facts capture measurable events. Dimensions provide descriptive context. A star schema gives people a stable mental model.
I think of it as the meal kit of warehouse design. Much of the prep work is done. Analysts can move fast because the structure anticipates common reporting questions.
It works especially well when you need:
Fast dashboard delivery: Revenue by segment, retention by cohort, pipeline by rep
Business-friendly querying: Clear fact tables and familiar dimensions reduce confusion
Reliable metric definitions: Teams can standardize common aggregations in predictable places
The cost is that dimensional models are opinionated. They embed assumptions about the questions people will ask. When those assumptions fit, the model feels elegant. When they don’t, teams start adding exceptions, bridge tables, and awkward transformations.
If you’re modeling campaign influence or customer journey reporting, even seemingly simple use cases can get complicated. Marketing teams dealing with paths and conversion credit often need more nuance than a flat reporting table can offer. In that context, understanding multi-touch attribution models is useful because it shows how quickly “just build a dashboard” becomes a modeling problem about time, sequence, and competing definitions of influence.
A practical starting point for many analytics teams is the star schema approach to data modeling. It’s often the fastest route to trusted reporting.
Data Vault for historical truth
Data Vault solves a different problem.
Instead of optimizing for analyst simplicity first, it optimizes for traceability, extensibility, and ingestion from many changing systems. Hubs represent business keys. Links capture relationships. Satellites store descriptive context and historical change.
That structure can feel heavy to a startup. It usually is. But if your business needs a durable record of how entities changed over time, or if many upstream systems mutate independently, Data Vault gives you a disciplined way to preserve history without rebuilding the model every quarter.
Use it when:
source systems change often
auditability matters
ingestion breadth is growing faster than reporting standardization
Avoid it if your immediate problem is “leaders need clean weekly reporting and the team is overloaded.” Data Vault can absolutely support analytics, but it rarely feels lightweight at the beginning.
The best Data Vault implementations are built by teams who know why they need one. The worst are built by teams who wanted enterprise credibility more than practical usability.
Canonical models for shared meaning
Canonical data modeling tries to create one common representation of business entities across systems. In theory, this is appealing. Every team aligns to one definition of customer, order, product, or asset.
In practice, canonical models are useful and difficult.
They’re useful because duplicated definitions create long-term friction. They’re difficult because system-specific realities don’t disappear just because leadership wants one source of truth. Product, finance, support, and operations may all use the same word differently for legitimate reasons.
Canonical models work best when the company is old enough, broad enough, and cross-functional enough that inconsistent concepts are causing operational damage. They work poorly when the business model itself is still changing every few months.
What actually works at a startup
For most fast-growing companies, the winning pattern isn’t ideological purity. It’s selective use.
A startup might use dimensional models for board metrics and operational dashboards, preserve some raw history for future backfill and audit needs, and maintain a thin canonical layer only for the most important shared entities. That hybrid approach usually reflects reality better than picking one single approach and forcing everything into it.
A Tour of Modern Data Modeling Software
The software category is broader than many teams expect. Some tools are built for formal enterprise modeling. Some are really diagramming environments with enough database awareness to be useful. Others sit closer to analysis and query workflows than classic architecture work.
What matters isn’t the vendor list by itself. It’s what the tool helps your team do consistently.

What traditional modeling tools are built to handle
The classic enterprise tools are ER/Studio and erwin Data Modeler. They exist for teams that need visual modeling, governance, database-specific implementation support, and change management across many systems.
Their value comes from a few concrete jobs:
Forward engineering: Generate DDL from the model so implementation follows design
Reverse engineering: Pull structure out of an existing database and document it visually
Model reconciliation: Compare intended and actual schemas, then flag drift
Standards enforcement: Keep naming conventions, metadata, and design rules consistent
According to this overview of data modeling tools, ER/Studio’s reconciliation capabilities can prevent up to 30 to 50% of common schema drift issues, and erwin’s version comparison workflow can cut model maintenance time by 40% in larger organizations.
That’s real value if you run multiple teams, many environments, and tightly controlled production releases. It’s less compelling if your main issue is that nobody knows which events define activation.
Different classes of tools solve different problems
Not every team needs a heavyweight model repository. A more useful way to evaluate data modeling programs is by category.
Tool category | What it helps with | Typical fit |
|---|---|---|
Enterprise modelers | Governance, DDL generation, lineage, reconciliation | Large data teams, regulated workflows |
Diagramming tools | Shared visuals, lightweight collaboration, architecture discussion | Product and engineering alignment |
Warehouse-native analysis tools | Querying, exploratory joins, practical metric work | Lean analytics and startup teams |
If your team mainly needs clearer visual communication across engineering and analytics, a guide to best diagramming tools can help narrow the lightweight options before you jump into a full modeling suite.
Where modern workflows differ
The old assumption was that data modeling happened first, and analysis happened later. Modern stacks blur that line. Teams often discover the right structure by querying live warehouse data, validating assumptions with stakeholders, and only then hardening repeated logic.
That shift matters. It means some of the most useful software today doesn’t look like classic data modeling software at all. It may combine SQL, notebooks, reusable definitions, and lightweight semantic abstractions in the same working environment.
For teams that want to analyze and shape data in one place, SQL forward data analysis tools that query, model, and visualize together reflect that newer pattern better than traditional ERD-first workflows.
A short demo makes that shift easier to see in practice.
What these programs don’t solve on their own
No tool fixes unclear ownership, weak definitions, or poor source data. Teams sometimes buy an advanced modeler when the actual problem is organizational. If finance and product still disagree on what counts as expansion revenue, a diagram won’t save you.
Good software helps after you’ve identified the recurring ambiguity. It doesn’t replace that thinking.
How to Select the Right Program for Your Team
The wrong way to choose a modeling tool is to start with a feature matrix.
The right way is to start with your bottleneck. Organizations aren’t choosing between abstract ideals. They’re choosing which pain they’re willing to tolerate for the next year. Slow delivery. Weak governance. Limited self-service. Fragile definitions. Expensive rework later.
Start with the team you actually have
A startup with strong SQL analysts and one data engineer shouldn’t buy for a future architecture team that doesn’t exist yet. Likewise, a company with platform engineers, governance requirements, and multiple production databases shouldn’t pretend a whiteboard and notebook workflow will be enough forever.
Ask these questions first:
Who builds and maintains the models: Analysts, analytics engineers, data platform engineers, or a mixed group?
How do people consume data: Dashboards, ad hoc SQL, notebooks, embedded analytics, or operational workflows?
Where does confusion show up most often: Definitions, joins, source freshness, naming, or schema changes?
What breaks when the company grows: Reporting trust, release safety, warehouse performance, or onboarding time?
The answer usually points toward a category of solution faster than any vendor demo will.
Speed versus governance is the real trade-off
Early-stage teams should bias toward speed, but not chaos. That means picking the smallest amount of modeling discipline that creates shared trust. Define important grains. Standardize the handful of core business entities. Build enough naming consistency that people stop reinventing the same joins.
Scaling teams need more than that. Once multiple analysts, engineers, and business units are producing downstream assets, governance stops being optional. You need versioning, review workflows, documented ownership, and some protection against schema drift.
Choose the tool that makes your current failure mode harder, not the one that looks most impressive in procurement.
A practical selection filter
Use a decision lens like this:
If your issue is repeated metric confusion, prioritize semantic consistency and reusable business definitions.
If your issue is production drift across many databases, prioritize reconciliation, reverse engineering, and controlled deployment support.
If your issue is slow answer time for changing business questions, prioritize flexible analysis environments over rigid upfront design.
If your issue is cross-team communication, prioritize clear visual modeling and lightweight collaboration.
Match the tool to your company stage
A seed or Series A startup usually benefits from lighter structure. The company is still discovering its business model, and over-modeling creates drag. Keep the core entities clean, preserve enough raw data to rework assumptions later, and avoid locking every reporting decision into heavy architecture.
A later-stage startup or mid-market company needs a more deliberate stack. At that point, inconsistent definitions start spilling into finance, customer conversations, planning, and product prioritization. The cost of ambiguity rises. More formal data modeling programs start paying back because rework becomes more expensive than discipline.
The point isn’t to “graduate” into complexity for its own sake. The point is to align your tooling with the cost of being wrong.
The New Frontier Beyond Rigid Modeling
A lot of data modeling advice still assumes your team can stop, understand every source, define the correct abstractions, and then implement the right model before serious analysis begins.
That’s not how most startups operate.
Real data arrives half-documented. IDs don’t line up cleanly. Business rules change mid-quarter. Two systems both claim to be the source of truth, and both are wrong in different ways. Tutorials usually hide that mess by using clean examples. Production work doesn’t.
A strong critique of traditional practice is that real implementations involve data spread across multiple systems with gaps and inconsistencies, making rigid upfront modeling a bottleneck. That same critique also notes the contrarian reality that skipping some upfront modeling can accelerate startups, especially now that affordable cloud compute makes iterative exploration more feasible, as argued in this discussion of real-world modeling challenges.
Why teams break the old rules
The old rules came from a world where compute was expensive, storage was constrained, and centralized control was easier to justify. Many of those constraints still matter, but not in the same way.
Today, teams often get more value from answering the question this week than from perfecting the schema this month. That changes the cost-benefit analysis.
Teams break strict modeling rules when:
Questions change faster than schemas: Product and growth teams need exploration, not just fixed dashboards
Source systems are unstable: Building a polished model over shifting inputs creates churn
The data team is overloaded: Every request routed through a small central team turns them into a bottleneck
Python and notebooks are part of the workflow: Analysts and engineers can inspect, transform, and test ideas directly against warehouse data
That doesn’t mean structure is dead. It means structure becomes iterative.
What flexible modeling looks like in practice
Flexible modeling usually means keeping some layers lightweight until repeated use justifies hardening them.
You might start with exploratory joins in notebooks. Then standardize the joins that recur. Then promote the stable logic into governed models or reusable definitions. That sequence is often healthier than forcing every data source into a fully normalized target before anyone knows what the business will ask next.
The key is to distinguish between:
Needs immediate structure | Can stay flexible longer |
|---|---|
Board metrics | Exploratory product questions |
Finance definitions | One-off operational analysis |
Customer-facing reporting logic | Early hypothesis testing |
Shared entity keys | Experimental derived features |
That split is where modern notebook-based systems become important. Instead of requiring a perfect model upfront, they let teams work directly on the warehouse, inspect assumptions, and shape structure as usage patterns emerge.
Why this changes the role of the data team
In older setups, the data team often functions as a gatekeeper. Business users ask questions. Analysts translate. Engineers maintain the pipelines. Everyone waits.
In a more flexible environment, the data team acts more like infrastructure stewards. They define critical shared objects, keep the warehouse usable, and support self-service on top of it. That’s a better use of scarce expertise.
One modern option in this category is Querio, which uses AI coding agents on the warehouse with a file system and Python notebook approach so users can query, analyze, and build on company data without waiting for a traditional BI workflow. That kind of setup doesn’t eliminate modeling. It shifts more of it closer to query time, where teams can test assumptions before they freeze them into durable architecture.
Don’t confuse skipping premature structure with abandoning standards. Mature teams still define the critical few things that everyone depends on.
Modeling Data for Speed and Clarity
The useful way to think about data modeling isn’t as a fixed doctrine. It’s a spectrum of choices.
At one end, you have formal enterprise discipline. Conceptual, logical, and physical models are clearly separated. Governance is strong. Tooling is structured. Approaches like dimensional modeling and Data Vault exist for good reasons, and in the right environment they solve real problems cleanly.
At the other end, you have highly agile teams working directly in the warehouse, using notebooks, SQL, and lightweight semantic conventions to answer questions before they harden patterns. That approach also exists for good reasons. It reflects how startups learn.
The best teams know when to move along that spectrum.
They use established rules where precision matters most. Shared business entities. Executive metrics. Financial reporting. Customer-facing definitions. They relax those rules where exploration matters more. New product questions. Early instrumentation. Ad hoc operational analysis. Experimental feature work.
That’s the fundamental lesson behind modern data modeling programs. They’re not just software for drawing schemas. They’re part of a broader decision about how your company balances clarity, control, and speed.
If you’re advising a growing startup, push for enough structure that people trust the answers. But don’t force so much structure that nobody can ask new questions quickly. The goal isn’t theoretical perfection. The goal is a data system your team can effectively use.
If your data team is stuck answering the same questions by hand, Querio is worth a look. It puts AI coding agents directly on your warehouse and supports Python notebook workflows so teams can explore, query, and build self-service analytics without routing every request through analysts.

