Business Intelligence in Retail: A Modern Guide for 2026
Unlock growth with business intelligence in retail. This guide covers KPIs, use cases, and the shift from dashboards to modern, self-serve analytics.
https://www.youtube.com/watch?v=NARrRbFKHeI
published
Outrank AI
business intelligence in retail, retail analytics, self-service bi, data warehouse, retail kpis
2c8d77a6-96b1-446b-9e22-3995e92241cf

Every retail leadership team I talk to has the same complaint in different words. They have POS data, Shopify data, return data, loyalty data, paid media data, warehouse data, and enough dashboards to fill a weekly exec review. But when someone asks a basic operating question, nobody can answer it quickly with confidence.
Why did conversion drop in two regions last weekend? Which SKUs are dragging margin because of markdown pressure? Is the stock problem a demand problem, a replenishment problem, or a data freshness problem? The company has data everywhere and clarity nowhere.
That gap is getting harder to ignore. In retail, 87% of retailers already employ AI in at least one business area, and 60% plan to increase investments, yet only 9% of employees in most organizations use BI tools beyond spreadsheets according to Strategy's retail analytics and BI trends coverage. Retailers aren't short on systems. They're short on analytical access.
This is the business intelligence in retail problem. It isn't just about buying a dashboard tool. It's about building a system that turns operational data into decisions that merchants, operators, finance leaders, and store teams can use.
If you're evaluating your current setup, it helps to look at how analytics fits into the broader Retail and E-commerce industry, where customer expectations, channel complexity, and inventory risk collide every day.
Introduction The Retail Data Dilemma
A mid-market retailer usually hits the same wall at roughly the same moment. Growth creates more systems. More systems create more reporting logic. Then someone hires analysts to stitch the picture together, and the analysts become the only people who know where the truth lives.
At first, that feels manageable. A few dashboards in Looker, some exports from NetSuite, a spreadsheet that finance trusts, another spreadsheet that merchandising trusts, and a weekly meeting where everyone debates whose number is right. Then the business adds stores, expands categories, opens another channel, and the reporting model breaks under its own weight.
When data volume outpaces decision speed
Retail creates operational questions faster than organizations can effectively model them. Promotions change by the week. Assortment shifts by location. Returns alter margin after the sale. Store traffic, ad spend, and fulfillment performance all move together, but often sit in different systems.
The problem isn't lack of information. The problem is fragmentation plus dependency. Business users depend on analysts for every new cut of data, and analysts depend on brittle pipelines, undocumented business logic, or dashboard models that were designed for last quarter's questions.
Practical rule: If your merchants still ask analysts for CSV exports to do their real work, your BI stack isn't self-serve.
Why this matters now
Retail has always been an operations game. What's changed is the speed of decision cycles. Leaders can no longer wait days for a report rewrite just to understand why sell-through changed or whether a pricing move is working.
Business intelligence in retail should shorten the path from question to action. Done well, it gives operators a common layer for sales, inventory, customer, and margin decisions. Done poorly, it becomes a presentation layer that looks polished but slows everyone down.
The difference comes down to architecture, ownership, and how much flexibility the stack gives the people closest to the business.
Deconstructing Business Intelligence for Retail
Many define BI too narrowly. They think it means dashboards, filters, and a weekly KPI email. That's the output, not the system.
A better way to think about business intelligence in retail is through a kitchen analogy. Raw ingredients on a counter aren't dinner. They're just inputs. Retail data works the same way.
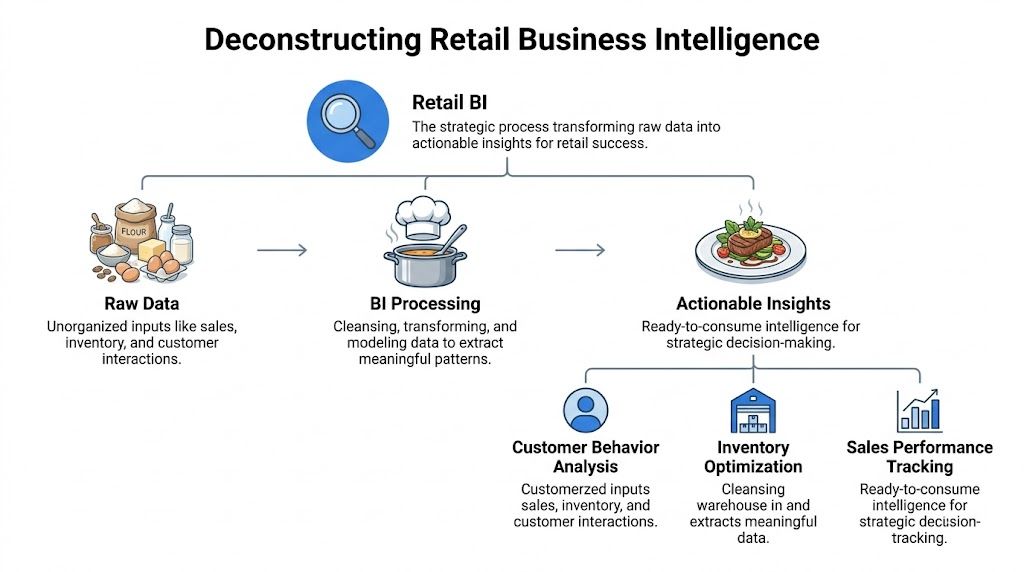
Raw ingredients are not a meal
Retailers collect data from POS systems, ecommerce platforms, ERP tools, WMS platforms, loyalty systems, returns workflows, and marketing channels. In raw form, that data is messy. Product identifiers don't line up. Time zones differ. Returns may appear in one system long after the original sale appears in another.
That's the ingredients stage. Valuable, but unusable without preparation.
A lot of BI frustration starts here. Teams expect a reporting tool to fix source chaos. It won't. A dashboard can only expose the quality of the data beneath it.
Mise en place happens in the warehouse
Good kitchens prep before service. BI teams need the same discipline. Data gets loaded into a warehouse, shaped into reliable models, and documented so the business can use consistent definitions. Gross sales, net sales, sell-through, inventory on hand, and promotional margin need one agreed meaning.
This is the layer where retail businesses create a real operating model. They join transaction facts to product hierarchies, store attributes, calendar logic, and customer entities. They decide how returns affect revenue. They define what counts as in stock. They align channels into one commercial view.
For teams working through fulfillment and store-to-door complexity, adjacent reading on analytics in logistics can help frame how operational data should connect to merchandising and inventory decisions instead of living in a separate silo.
The actual cooking is analysis
Once the prep work is solid, analysis can happen fast. A merchant can compare item performance across regions. Finance can isolate margin erosion by category. Operations can spot stores with recurring stock anomalies. Marketing can tie campaign activity to basket behavior.
That analysis shouldn't be trapped inside a rigid dashboard model. Retail questions change too often for that. Teams need a system that supports both curated reporting and flexible exploration.
Good BI doesn't just answer known questions. It lets teams investigate new ones without filing a ticket.
Plating is the presentation layer
Dashboards, notebooks, scorecards, alerts, and reports all matter. But they're the final layer, not the foundation. A polished executive dashboard is useful only if the data model under it is trustworthy and the business can move from summary to detail without waiting on an analyst.
That distinction matters because many retailers buy software for the plating while neglecting the kitchen. The result is attractive reporting with weak operational value.
Five High-Impact Retail BI Use Cases
The fastest way to judge whether a BI stack is working is simple. Look at the decisions it changes. If the system can't improve daily retail operations, it's reporting theater.
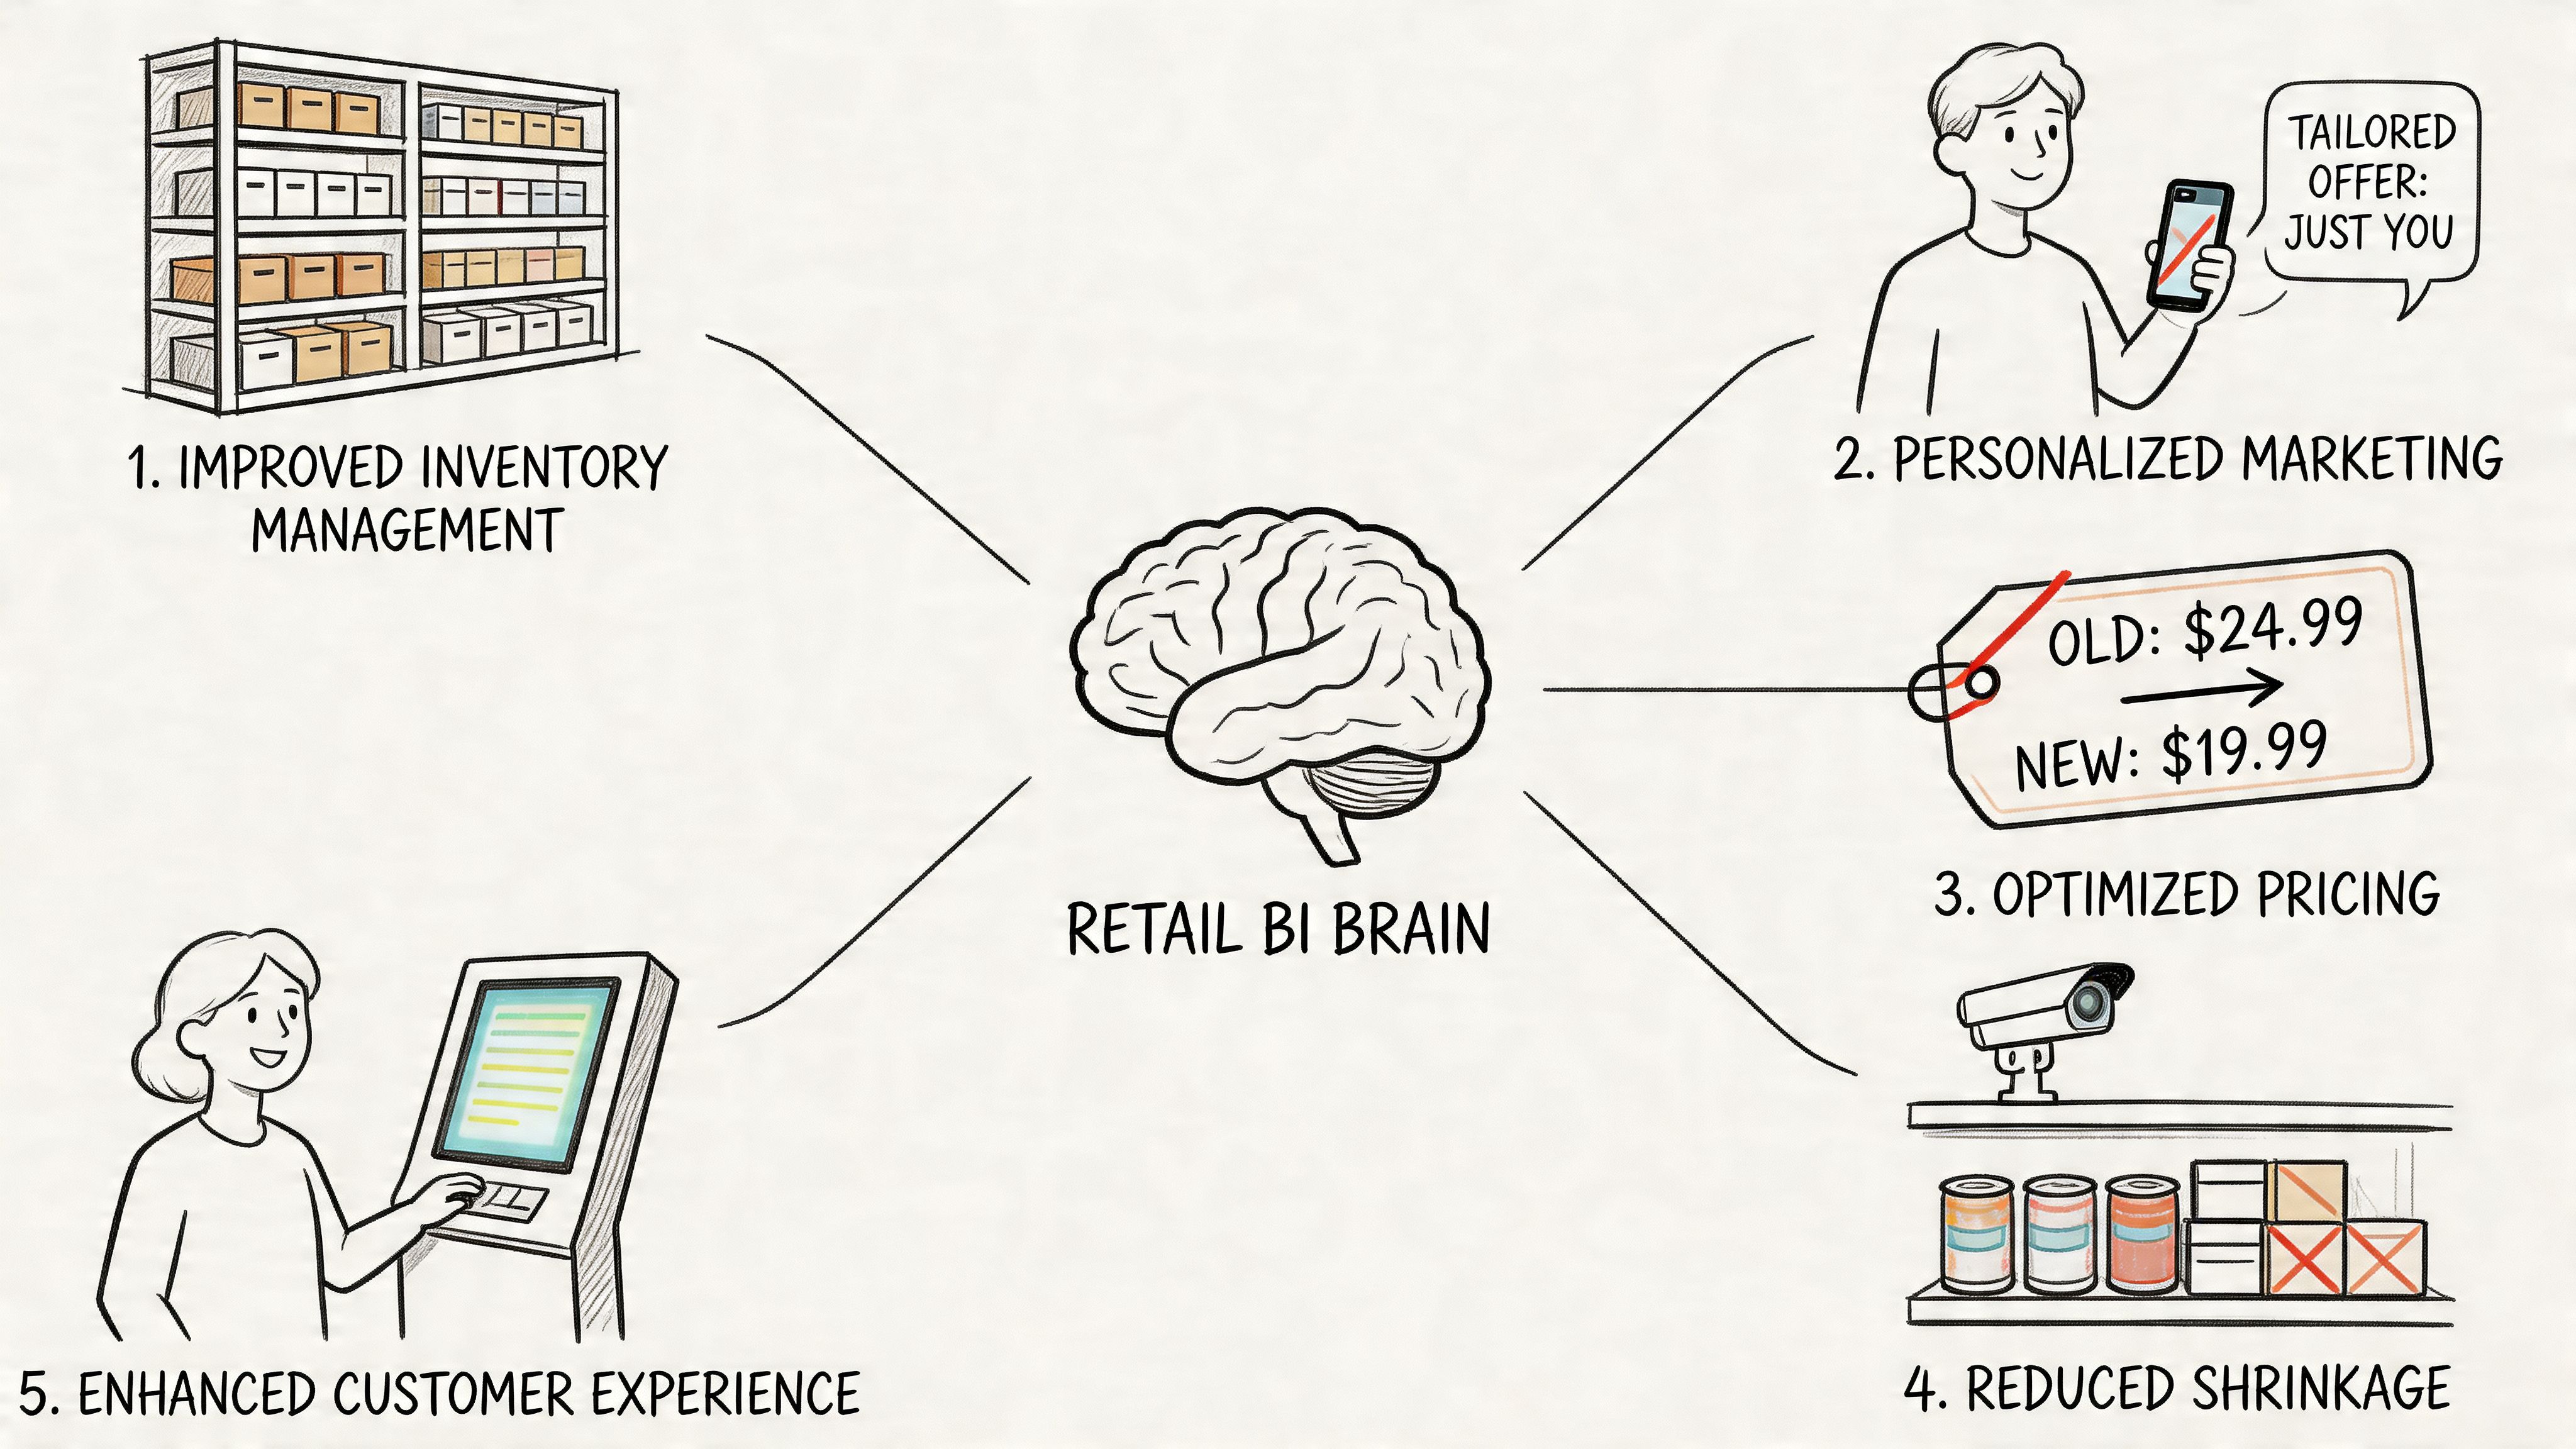
Inventory management that prevents both overstock and dead space
Before BI matures, inventory decisions often rely on lagging reports and merchant intuition. Teams know they have too much stock somewhere and not enough somewhere else, but they can't pinpoint where the imbalance starts. They react with markdowns, transfers, and emergency replenishment.
After a solid BI implementation, inventory becomes a monitored system instead of a guessing game. Operators can see stock position by store, channel, category, and SKU. They can trace whether weak sell-through is caused by poor placement, pricing, replenishment timing, or local demand mismatch.
The practical shift is that teams stop managing inventory at the chain average. They manage it locally.
Demand forecasting that actually feeds operations
Forecasting is where retail BI starts producing significant operational advantages. When demand models are integrated into BI workflows, teams don't just get a forecast number. They get a way to compare plan versus actual, isolate misses, and adjust quickly.
According to SPD Technology's retail analytics breakdown, advanced demand forecasting models integrated with BI tools can enable a 20-30% reduction in inventory levels while improving on-shelf availability to over 95%, as demonstrated by Target's implementation.
That matters because forecasting isn't a forecasting team's problem. It's a merchandising problem, a finance problem, and a customer experience problem. If the forecast is wrong, the business pays for it in excess inventory, stockouts, rushed logistics, or missed sales.
Teams looking for a more tactical view can also study this guide on hybrid BI for inventory management, which gets into how flexible analytics improves planning loops.
Dynamic pricing that responds to conditions, not gut feel
Pricing decisions often happen in bursts. A promo underperforms, margin gets tight, or a category leader changes list price, and suddenly everyone wants a pricing readout. Legacy reporting usually gives a delayed answer, and by the time the dashboard is updated, the window to act has narrowed.
Modern BI changes that by combining sales velocity, margin movement, inventory exposure, and store or channel performance in one place. The goal isn't constant price movement for its own sake. It's faster visibility into where pricing is helping, where it's hiding weak demand, and where markdown strategy is training customers to wait.
In practice, the best pricing analysis isn't a static chart. It's a workflow where merchants can test assumptions, compare cohorts, and see downstream effects.
Merchandising optimization that works at the store level
Chain-wide averages hide retail problems. One category can look healthy overall while several stores are carrying the wrong depth, the wrong size curve, or the wrong assortment mix.
BI gives merchants a way to break that illusion. They can compare product performance by location, seasonality, margin band, and promotional context. They can spot stores where display space doesn't match demand. They can identify products with healthy sales but poor margin contribution, or products with healthy margin but weak movement.
This is also where store operations and merchandising need a shared language. Merchants need to know what sold. Operators need to know why the floor didn't convert.
Customer analytics that goes beyond campaign reporting
Retailers don't need more top-line channel reports. They need to understand how customers behave across touchpoints. Which cohorts return without discounts? Which segments buy across categories? Which promotions pull demand forward rather than create incremental value?
For digital teams, integrating web and marketing activity into the same analytical environment as store and transaction data is the difference between channel reporting and customer insight. A connector layer such as Google Analytics mcp can be useful when you're trying to bring ecommerce behavior into the same decision surface as merchandising and revenue data.
The strongest retail teams don't treat customer analytics as a marketing function. They use it to shape assortment, pricing, loyalty, and inventory decisions.
What these use cases have in common
Each of these use cases starts with the same before state. Data lives in separate systems. Business users rely on analysts. Decisions happen after the fact.
Each reaches the same after state when BI is designed well:
Shared definitions: Sales, stock, margin, and customer metrics mean the same thing across teams.
Operational access: Merchants, operators, and finance leaders can explore answers directly.
Local action: Teams can move from chain view to store, channel, or SKU detail without rebuilding the whole report.
Faster correction: Problems surface while there's still time to change the outcome.
That's the practical test for business intelligence in retail. It should change how the company runs, not just how the company reviews performance.
The Retail Metrics That Move the Needle
Retail teams often drown in metrics and still miss the handful that are essential. A dashboard with dozens of charts feels thorough, but if it doesn't guide action, it's clutter.
The most useful retail BI environments focus attention on a small set of operating metrics that connect inventory, margin, and sales quality. According to Datawiz's review of retail BI use cases, retail BI dashboards tracking core KPIs like Inventory Turnover with a target of 6-8x per year and GMROI above 1.2 can drive a 15-25% uplift in gross margins through real-time anomaly detection and localized optimization.
Inventory turnover
Inventory turnover tells you whether stock is moving with enough speed to justify the capital tied up in it. In retail, this is one of the cleanest signals of operational health because it reveals whether planning, pricing, allocation, and replenishment are working together.
A chain-level turnover number is useful for finance. A category-level and store-level view is what operators need. When turnover drops below your acceptable range, don't start with markdowns. First isolate whether the issue is assortment, size depth, forecast quality, local demand mismatch, or stale stock concentration.
GMROI
GMROI matters because it combines margin and inventory productivity. A product can look healthy on margin alone while still being a poor use of inventory dollars if it sits too long. That makes GMROI one of the best filters for deciding what deserves more space, more depth, or less attention.
The operational move here is straightforward. Review GMROI alongside inventory age and replenishment behavior. If margin is respectable but productivity is poor, the stock strategy is likely the problem.
Operator note: Margin without movement is not a win. In retail, dollars trapped in slow stock crowd out better bets.
Sell-through rate
Sell-through helps merchants understand whether an item is earning its place during the window that matters. It is especially useful for seasonal goods, trend-sensitive categories, and promotional items where timing matters almost as much as margin.
A weak sell-through rate isn't automatically a product problem. It can signal a placement issue, an inventory depth problem, poor launch timing, or a pricing mismatch. Teams that only monitor final sales miss the chance to intervene early.
Using KPI ranges instead of isolated numbers
The mistake many companies make is treating KPIs as scorecards instead of triggers. A modern BI setup should make every core metric actionable:
When turnover softens: Review aged inventory, transfer opportunities, and replenishment settings.
When GMROI weakens: Reassess assortment depth, margin mix, and promotional intensity.
When sell-through lags: Check launch timing, localization, placement quality, and stock availability.
When metrics diverge by store: Compare execution, demographics, and regional demand patterns.
For a more detailed breakdown of how retail teams operationalize these measures, this guide to key performance indicators for retail industry is a practical reference.
What good metric design looks like
The best KPI layer has three qualities.
First, it uses definitions the business agrees on. Second, it allows drill-down from executive summary to store or SKU detail. Third, it tells users what changed, where, and whether intervention is needed.
Metrics shouldn't just decorate a dashboard. They should route attention.
Architecting a Modern Retail Data Stack
Retail analytics gets easier once the architecture is boring in the right places. Source data flows in predictably. Modeling happens in one central environment. Business users work from a shared foundation rather than competing exports.
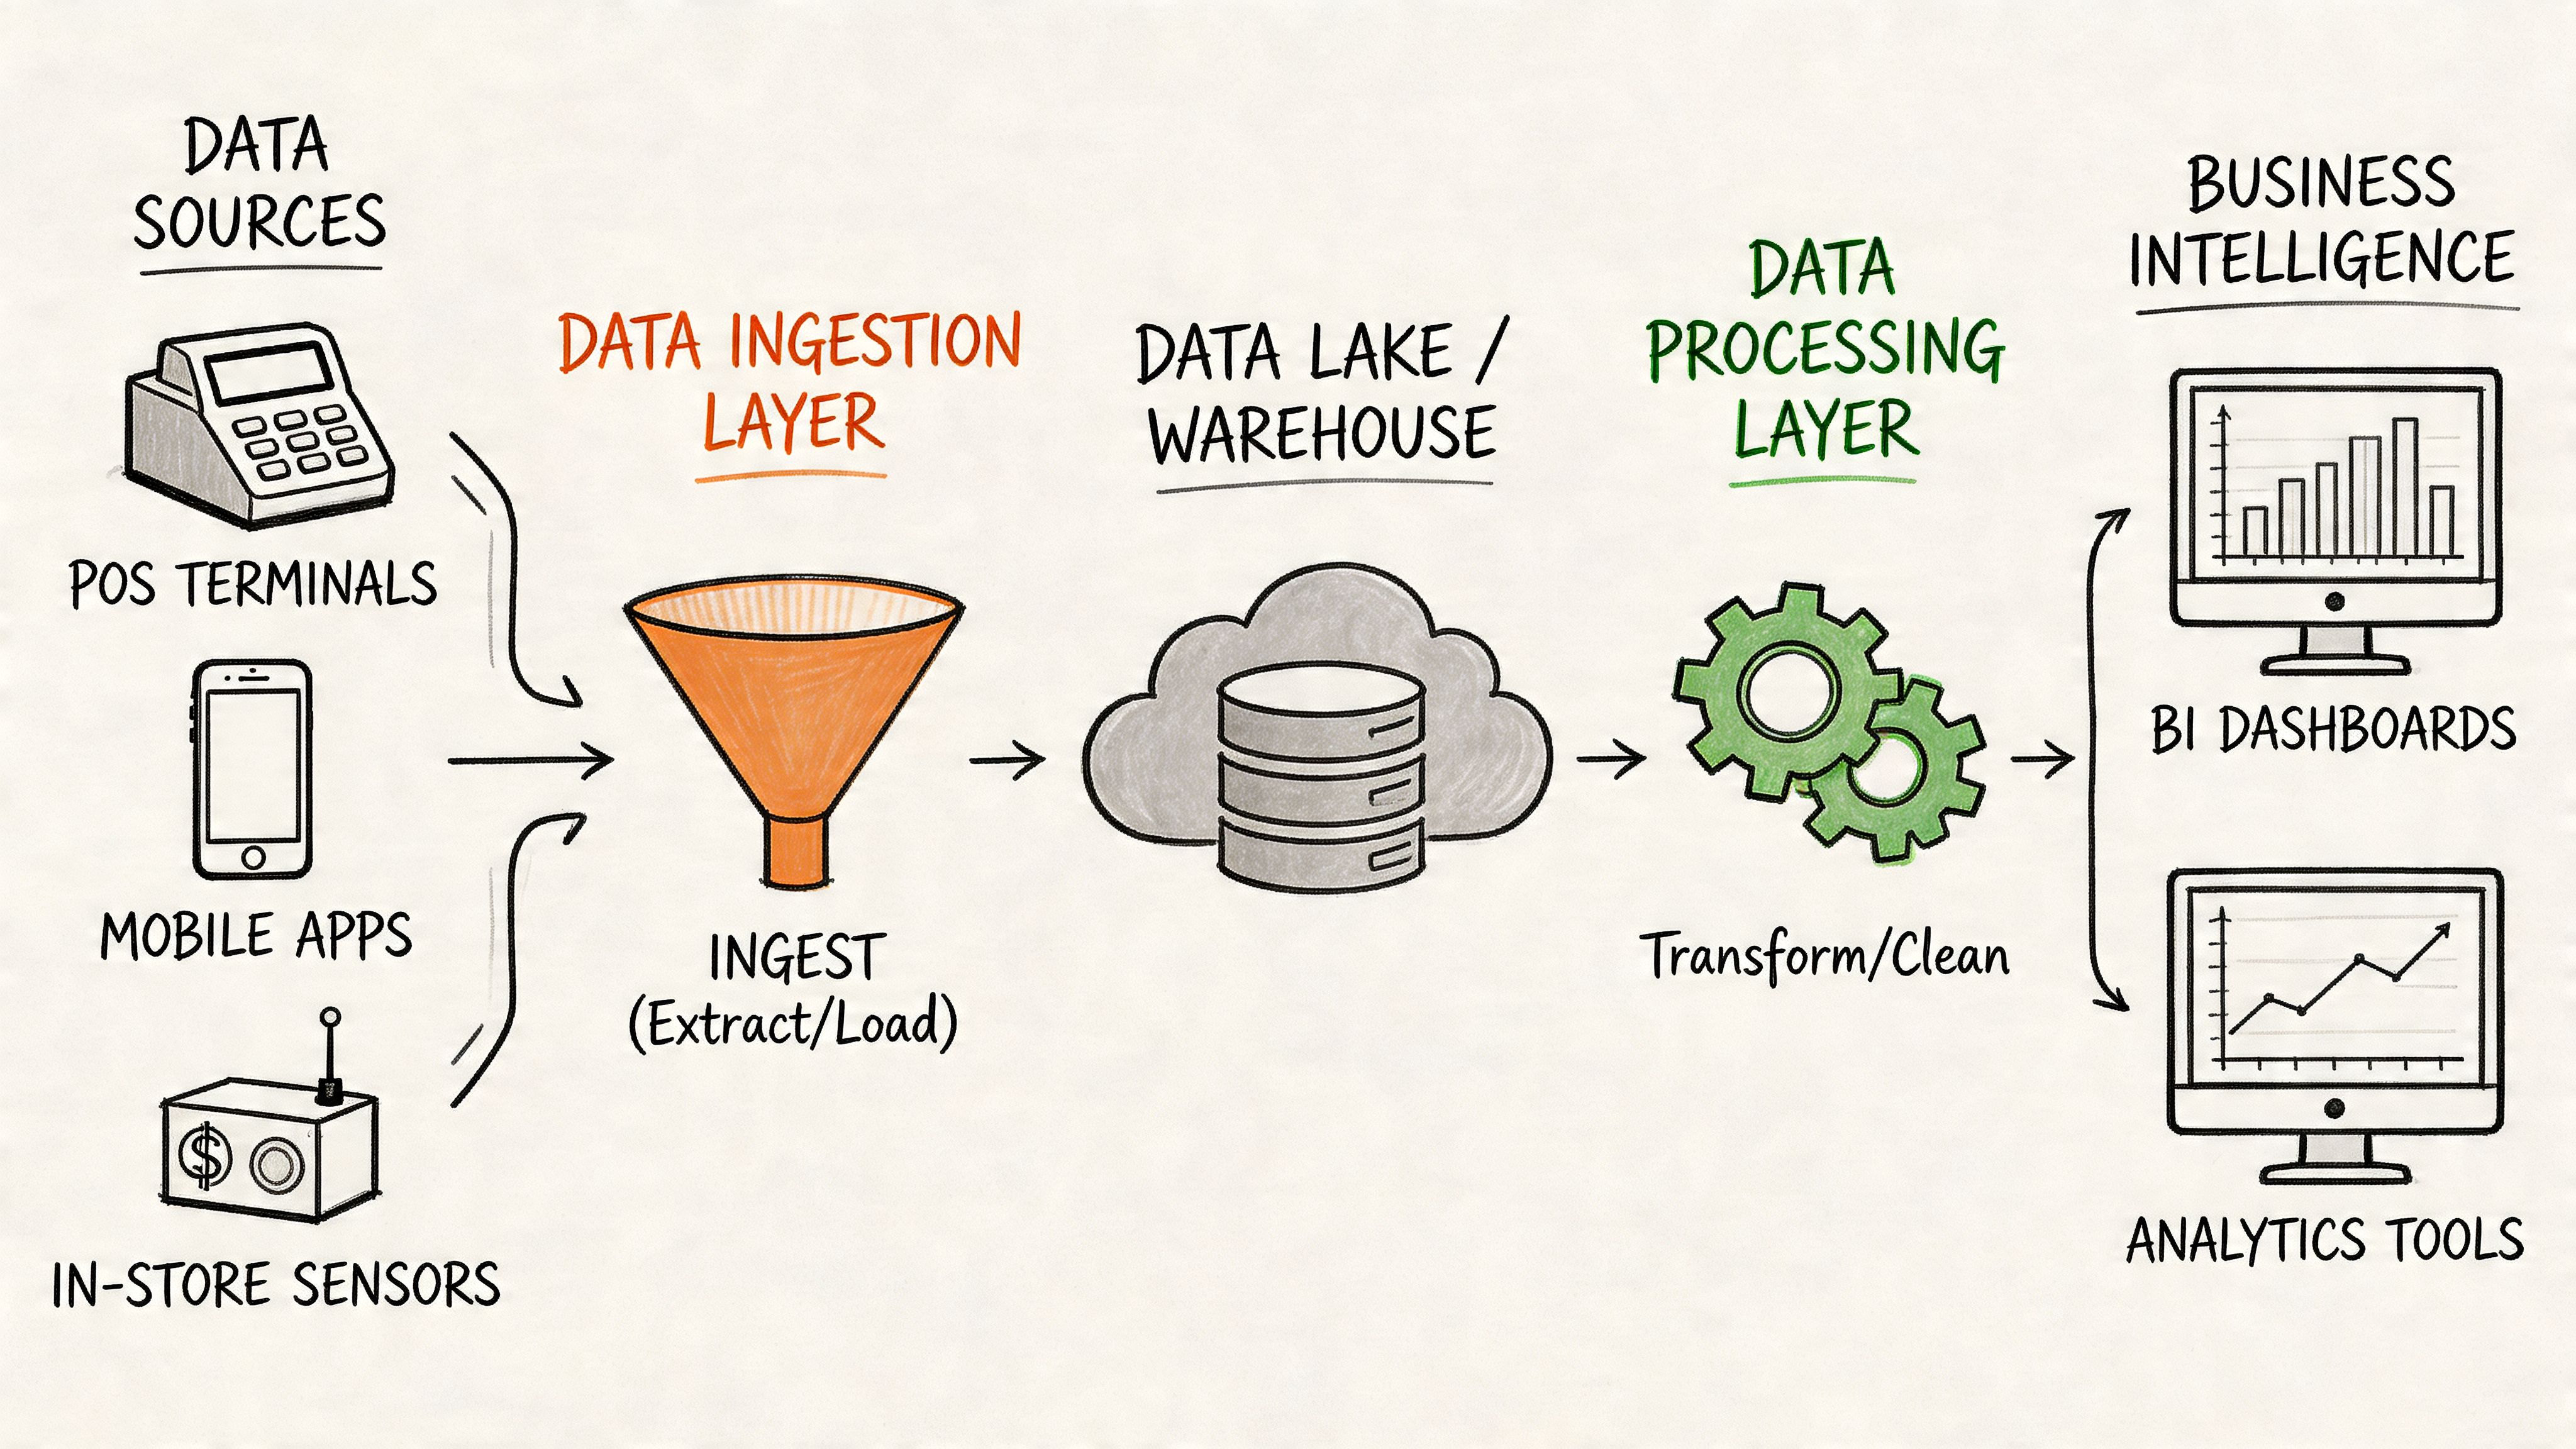
Start with the systems that create retail truth
Most retail stacks pull from a familiar set of systems. POS creates transaction truth. Ecommerce platforms record digital behavior and order activity. ERP systems hold financial and product structure. WMS tools handle stock movement and fulfillment. CRM or loyalty platforms carry customer attributes and engagement history.
The mistake is letting each team build reporting from its own source. That creates parallel logic and endless reconciliation. A modern stack starts by centralizing these inputs in a warehouse such as Snowflake, BigQuery, or Redshift.
ELT beats scattered transformation logic
In fast-growing retail companies, transformation logic often ends up in too many places. Some business rules live in SQL scripts. Some live inside a BI modeling layer. Some live in spreadsheets that nobody admits are production-critical.
ELT fixes that by loading raw data into the warehouse first, then transforming it there in a visible, governed way. That makes debugging easier and version control possible. It also means business logic isn't trapped inside one reporting tool.
If your team is debating design choices, this primer on data warehouse architectures is a useful framework for discussing trade-offs between centralization, performance, and flexibility.
The warehouse is the product
This is the shift many teams miss. The warehouse isn't just storage. It's the analytical product your company runs on. Product dimensions, store hierarchies, promotion mappings, return logic, and inventory states should all be modeled there with enough care that downstream analysis becomes simple.
A useful retail warehouse usually includes:
Core fact tables: Transactions, orders, returns, inventory snapshots, fulfillment events.
Shared dimensions: Product, store, calendar, customer, channel, vendor.
Business definitions: Net sales logic, promotion handling, stock status, margin rules.
Access patterns: Curated marts for common use cases plus room for ad hoc exploration.
The BI layer should sit on top, not hold everything together
Traditional stacks put too much responsibility on the BI tool. They expect it to model the data, secure access, define metrics, and deliver every answer. That works for a while, then the semantic layer becomes the bottleneck.
A healthier architecture treats the BI layer as one interface, not the whole system. Dashboards still matter. So do notebooks, ad hoc SQL, embedded analytics, and alerting workflows. But they all sit on top of the same warehouse-native foundation.
A visual walkthrough can help if you're aligning technical and business stakeholders on the same blueprint:
What to optimize for when choosing tools
Tool selection matters less than architecture, but some criteria are non-negotiable.
Choose openness: Your data model shouldn't be trapped inside one vendor's interface.
Choose direct warehouse access: The warehouse should remain the system of record for analysis.
Choose flexibility: Retail questions change fast. The stack has to support new analysis without expensive rework.
Choose maintainability: If only two people understand the reporting logic, the system is fragile.
A modern data stack doesn't remove complexity from retail. It puts complexity where teams can manage it.
Beyond the Dashboard Why Your BI Strategy Is Failing
A lot of retail BI projects fail even when the dashboards look good. The reports launch. Leaders get their weekly KPI views. A few power users can use the tool effectively. But six months later, the business still waits on analysts for every new question.
That isn't a tooling bug. It's a design failure.
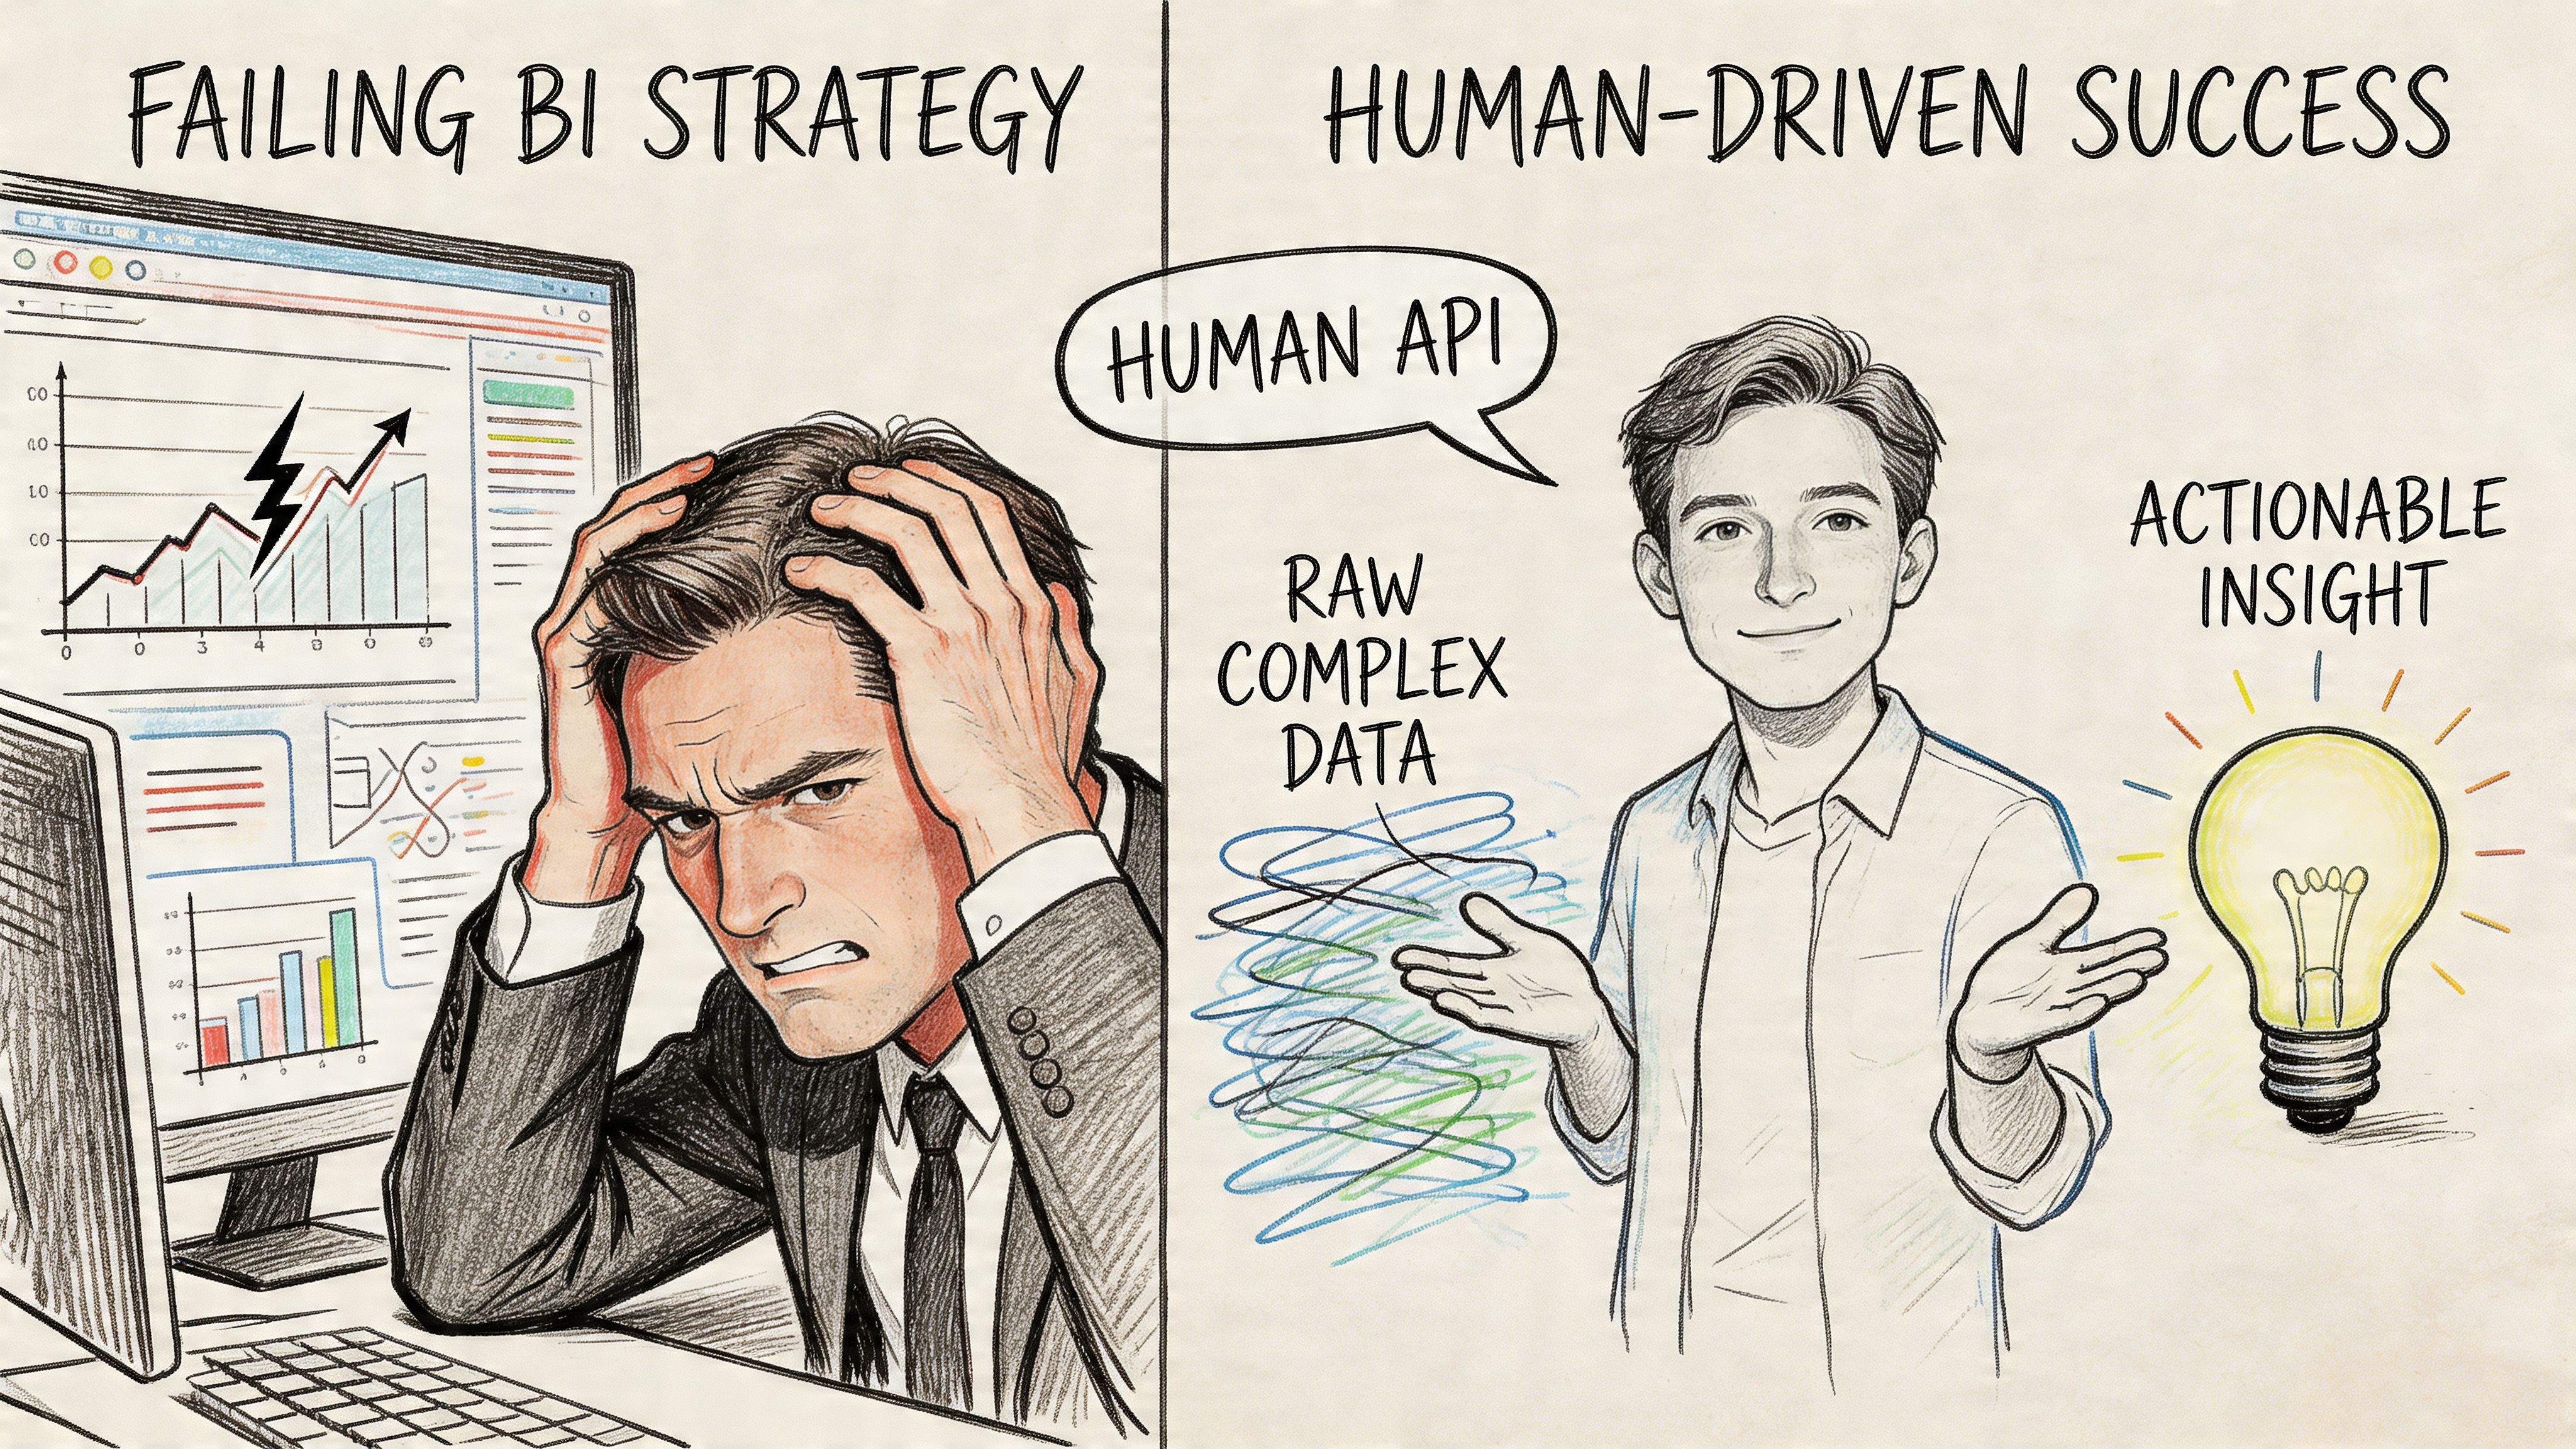
The human API problem
In many mid-market retailers, the data team becomes a service desk for the business. A merchant needs a new product cut. Finance wants margin restated after returns. Operations asks for stock visibility by store cluster. Marketing wants campaign analysis tied to customer cohorts.
None of these questions are unusual. The problem is that business users can't answer them themselves. So they submit requests to analysts, who queue work, clarify logic, edit SQL, rebuild dashboard tiles, and send exports back.
That workflow creates what many teams informally call the human API. The data team becomes the interface through which every question must pass.
According to TruRating's discussion of BI challenges in retail, this bottleneck is especially painful for mid-market retailers. The same analysis notes that high setup costs and complexity in enterprise BI tools contribute to project failure rates around 40% due to poor data integration and skills gaps.
Why dashboard-first tools often stall out
Dashboard-first BI tools promise self-service, but they usually deliver controlled consumption. Users can filter what already exists. They often can't ask a new question unless someone changes the model, adds a field, or rebuilds the dashboard structure.
That's not enough for retail. A merchant doesn't always know the exact question in advance. They need to follow the trail. They may start with category underperformance, then narrow to a region, then a subcategory, then a store cluster, then a pack size, then a promo window. Static reporting breaks under that kind of exploration.
Here are the failure modes I see most often:
Model rigidity: The semantic layer reflects last month's reporting priorities, not today's operating questions.
Integration drag: POS, ERP, ecommerce, and inventory systems don't reconcile cleanly, so teams distrust the outputs.
Skill concentration: A small group understands the joins, business logic, and dashboard dependencies.
Ticket dependency: Users can consume dashboards but can't create analysis independently.
Adoption illusion: Leadership sees dashboard usage and assumes the business is data-driven, while real work still happens in spreadsheets.
If users export dashboard data into Excel to finish the analysis, the dashboard wasn't the product. It was just the starting point.
Comparing BI approaches
Attribute | Traditional Dashboard-First BI | Modern Warehouse-Native BI |
|---|---|---|
Data access | Filtered through predefined dashboards and semantic models | Directly connected to the warehouse with flexible exploration paths |
Speed to new questions | Slows down when users need new fields or revised models | Faster because teams can work from shared warehouse data without rebuilding the whole interface |
Role of analysts | Analysts act as report builders and ticket responders | Analysts focus more on modeling, governance, and enabling self-service |
Change management | Every change risks breaking dashboard logic | Changes are easier to manage when core logic lives in the warehouse |
Fit for mid-market retail | Often heavy to implement and maintain | Better suited to fast-changing operational questions |
The hidden cost is organizational, not just technical
BI failure isn't only about software spend. It's about what the organization becomes while trying to use the software. Merchants stop asking questions because reporting takes too long. Analysts optimize for ticket throughput instead of strategic work. Finance and operations build side systems because they don't trust central reporting.
The result is a stack that produces charts without providing actionable insight.
If you're seeing those symptoms, it's worth reviewing the broader hidden costs of traditional BI platforms, especially the way maintenance burden compounds as the business adds channels, stores, and stakeholders.
What actually works better
Retail teams need a different division of labor. Data teams should build trusted models, access controls, and reusable infrastructure. Business users should be able to explore, question, and iterate without waiting in line.
That means moving beyond the idea that BI equals dashboards. Dashboards are one artifact. They are not the operating system.
Embracing the Warehouse-Native Future of Retail BI
The practical alternative is a warehouse-native model where analysis happens directly on top of the central data foundation. Instead of forcing every question through a dashboard builder, the company gives users multiple ways to work with data while keeping governance in one place.
That changes the role of the data team. They stop spending most of their time answering repeated requests. They spend more time designing reliable models, documenting business logic, and enabling controlled self-service for everyone else.
Why notebooks matter alongside dashboards
Dashboards are good at distributing known metrics. They are weaker at investigation. Notebooks, especially Python-based workflows connected to the warehouse, support the messier reality of retail analysis. Users can test a hypothesis, enrich a dataset, compare scenarios, and preserve the logic for reuse.
Retail questions rarely stay fixed. A stockout review turns into a forecast review. A campaign readout turns into a cohort analysis. A markdown review turns into a localization problem. Flexible environments handle those pivots far better than rigid dashboard trees.
What leadership should look for
If you're evaluating business intelligence in retail for the next phase of growth, ask direct questions.
Can business users answer new questions without opening a ticket?
Does core logic live in the warehouse or inside a vendor-specific reporting layer?
Can technical and non-technical users work in the same environment at different depths?
Will the stack get more useful as the company adds stores, channels, and complexity, or more fragile?
Retail BI should feel like an internal capability, not a queue.
The shift that matters
The strongest modern stacks don't eliminate dashboards. They demote dashboards from being the center of the universe. The center becomes the warehouse, the shared logic, and the ability to explore safely without rebuilding reporting every week.
That's the shift worth making. From static answers to flexible investigation. From analyst dependency to managed self-service. From BI as a reporting surface to BI as decision infrastructure.
If your team is stuck with overloaded analysts, brittle dashboards, and slow answers to basic retail questions, Querio is built for that exact problem. It deploys AI coding agents directly on your data warehouse and uses a file-system approach with custom Python notebooks so both technical and non-technical users can query, analyze, and build on company data without waiting on the data team. For mid-market retailers that have outgrown legacy BI, it's a practical way to turn the data team from a human API into the builders of real self-service analytics.

