Your First Data Management System a Practical Guide
Learn what a data management system is and how to choose the right one. This guide covers types, components, and modern alternatives for startups.
https://www.youtube.com/watch?v=lgCNTuLBMK4
published
Outrank AI
data management system, data architecture, business intelligence, data analytics, querio
48ac25e3-4807-4592-8d69-25bad6a7b738

You're probably dealing with this already. Revenue lives in Stripe. Pipeline lives in HubSpot. Product usage sits in Postgres. Finance has a spreadsheet that doesn't quite match the dashboard. Someone on the team asks a simple question like “What's our expansion revenue by customer segment?” and the answer turns into a Slack thread, a CSV export, and two people arguing over whose number is right.
That's the point where most founders realize they don't have a reporting problem. They have a data management system problem.
The pressure gets worse as the company grows. One industry source reports that data is growing at 48.7% annually according to HEC Paris on effective data management. More apps, more customers, more events, more files, more versions of the truth. If your team is still stitching answers together manually, speed starts to fall just when the business needs faster decisions.
A lot of teams respond by buying another dashboard tool. That rarely fixes the root issue. If your sources are fragmented, your definitions are loose, and ownership is unclear, the dashboard displays organized confusion. The objective is to connect systems, define rules, and make data usable by people who need answers now, not next week.
That's why breaking down silos matters before you worry about prettier charts. This practical guide builds from that reality, and if siloed systems are already slowing your team down, this short piece on breaking down data silos is a useful companion.
Table of Contents
From Data Chaos to Clarity
A startup can look data-mature from the outside while feeling chaotic on the inside. The sales team has a clean CRM. Finance has monthly exports. Product has event logs. Support has ticket data. Each system works well enough on its own, but no one can answer cross-functional questions without pulling data by hand.
That's how a company becomes data-rich but insight-poor. You can collect almost everything, yet still struggle to answer basic questions with confidence. Founders feel this first in meetings where numbers don't line up, then in planning cycles where every forecast gets debated because no one trusts the inputs.
The operational cost isn't just time. It's hesitation. When teams don't trust the data, they delay launches, second-guess hiring plans, and over-rely on gut calls. In an early-stage business, that kind of friction compounds quickly.
A useful test is simple. If a recurring business question still depends on one person cleaning spreadsheets, you don't yet have a real system.
A proper data management system changes the job from “collecting reports” to “running the company with shared facts.” It gives you a repeatable way to move data from source systems into a governed environment where definitions are consistent, access is controlled, and analysis doesn't restart from scratch every Monday.
This isn't only a large enterprise concern. Startups feel the pain earlier because the same few people are carrying operations, analytics, and planning all at once. When the company is small, poor data habits stay hidden. Once growth picks up, they show up as reporting bottlenecks, broken handoffs, and endless metric debates.
What Is a Data Management System Really
Most definitions are too narrow. They describe a data management system as software for storing and organizing data. That's incomplete, and for a growing business, it's misleading.
A modern data management system is the operating model that turns scattered raw information into something your team can trust and use. IBM describes modern data management as more than storage. It combines collection, integration, governance, metadata management, security, and lifecycle controls, often across architectures like data warehouses, data lakes, or lakehouses with data fabric capabilities, as explained in IBM's overview of data management.
A library beats a warehouse of unlabeled boxes
Think of your company's data like books.
A disorganized business stores those books in piles across different rooms. One team labels by customer. Another labels by month. A third keeps private notes in a spreadsheet. The books exist, but finding the right one is slow, and two people can read the same title and come away with different interpretations.
A strong data management system works more like a library. It doesn't just hold books. It catalogs them, tracks where they came from, defines who can access them, and helps people find the right version fast. The catalog is often more valuable than the shelf itself.
That's why startups often underestimate metadata. Metadata is the context that tells people what a table means, how a metric is defined, when a pipeline last ran, and whether the result is safe to use. Without it, data might be present but still unusable.
For teams building a more mature foundation, this overview of enterprise data management is helpful because it frames the problem as coordination and trust, not just tooling.
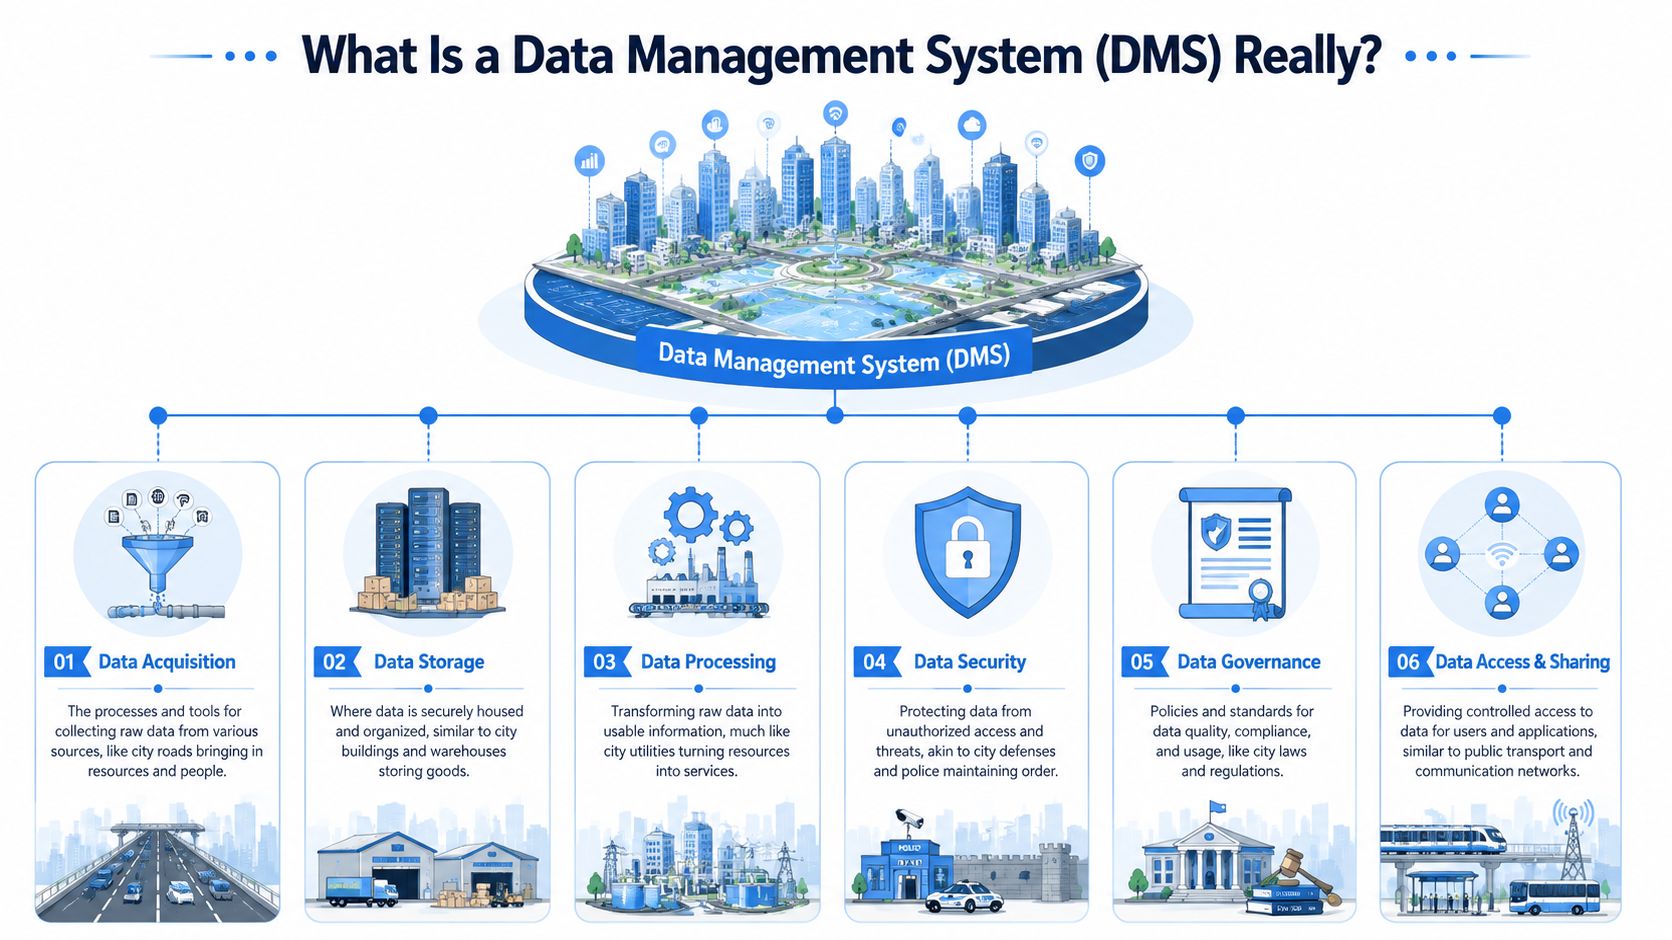
The parts that matter in practice
You don't need every enterprise feature on day one. You do need the core functions to be explicit.
Collection and ingestion matter because data starts in many places. Stripe, HubSpot, your app database, support systems, billing exports, and file uploads all produce different shapes of information.
Integration is the work of making those sources usable together. During integration, teams map customer IDs, align product names, reconcile dates, and decide which system owns which field.
Storage gives data a home built for analysis. In practice, that usually means a warehouse, lake, or lakehouse rather than leaving analytics logic trapped inside SaaS tools.
Governance sets rules. Who owns the definition of active customer? Which revenue table is approved for board reporting? What data should be restricted?
Security and access control make sure people can use data without exposing the wrong information to the wrong audience.
Lifecycle management handles the less glamorous questions. How long should data be retained? What gets archived? What gets deleted? What should be monitored for drift?
Practical rule: If your reporting depends on tribal knowledge, your data management system is underbuilt.
There's also a historical reason so many teams reach for the idea of a trusted master record. The rise of master data management, or MDM, established the goal of maintaining a single authoritative view of core entities like customers, suppliers, products, and assets. That shift helped move data management from a storage concern into a business operating layer.
Key Data Architectures and System Types
When founders hear “data management system,” they often assume there's one standard stack. There isn't. The term covers several architectural patterns, each built to solve a different business problem.
The mistake is choosing an architecture because it sounds modern instead of because it fits the company's workflow. A warehouse, a lake, a lakehouse, and an operational database can all be part of the same environment, but they don't do the same job.
What each architecture is trying to optimize
The simplest way to compare architectures is to ask what kind of discipline they impose.
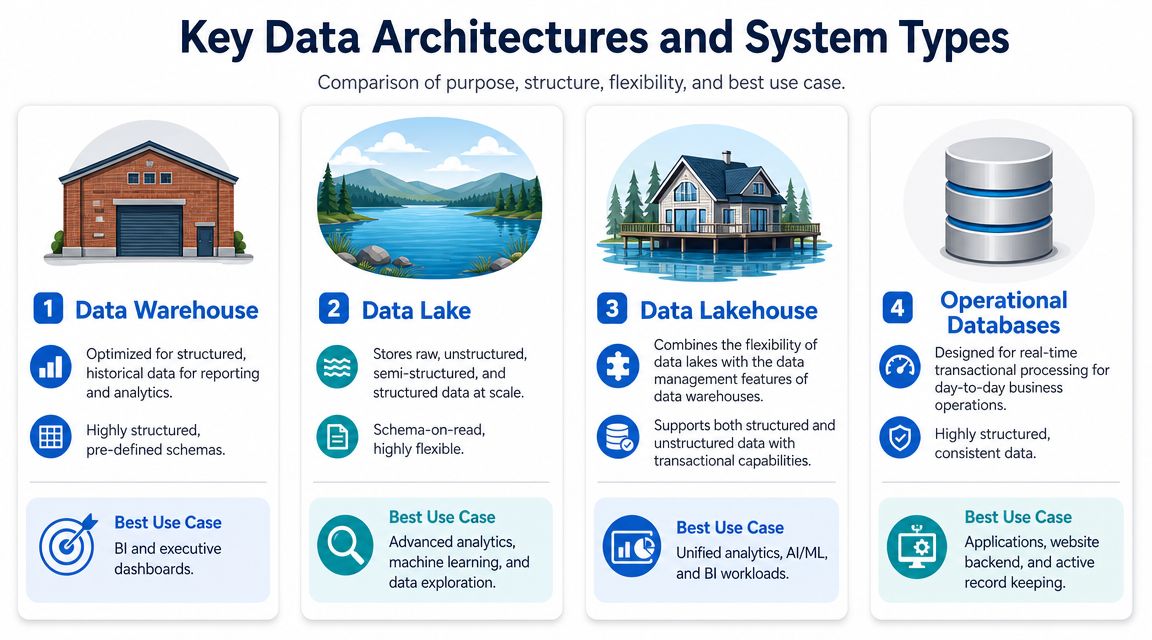
Architecture | What it's good at | Where it struggles |
|---|---|---|
Data warehouse | Clean, structured analytics and recurring reporting | Less flexible for raw or highly varied data |
Data lake | Storing large volumes of raw structured and unstructured data | Can become a dumping ground if governance is weak |
Data lakehouse | Combining warehouse-style control with lake-style flexibility | Still requires clear operating rules to stay usable |
Operational database | Running day-to-day application transactions | Not designed to be the main analytics layer |
A data warehouse is usually the safest starting point for a startup that needs reliable reporting. It favors structure. That means more upfront modeling, but it also means the finance number and the growth number are more likely to reconcile.
A data lake gives you flexibility. Teams often use it when they need to retain raw files, logs, documents, or semi-structured events without forcing everything into a strict schema first. The risk is familiar. If you keep pouring things into a lake without standards, you get storage, not insight.
A lakehouse tries to bridge that gap. It aims to support both broad data types and stronger management features in one environment. For many growing businesses, it's attractive because it reduces the split between exploratory work and structured reporting.
If you want a deeper look at how these patterns fit together, this guide to data warehouse architectures lays out the tradeoffs clearly.
System types serve different jobs
Architecture describes how data is organized. System type describes what the system is built to do.
A good example is the difference between transactional and analytical workloads. Your application database is built to process day-to-day operations. It records a signup, a payment, a status change, or a support update quickly and consistently. An analytical system is built for questions that scan across many records, such as churn by cohort or revenue by region.
That distinction matters because founders often ask their transactional systems to act like analytics platforms. The result is slow queries, fragile dashboards, and engineering teams that don't want anyone touching production data.
Use operational systems to run the business in real time. Use analytical systems to understand how the business is performing over time.
There's also a historical lesson here from MDM. A foundational milestone in modern data management was using master data management to create a more authoritative view across core business entities. Independent industry reporting notes that organizations using MDM software have seen up to a 20% increase in data accuracy and a 15% improvement in organizational efficiency, according to Semarchy's discussion of MDM statistics. The takeaway isn't that every startup needs a heavy MDM program. It's that consistency across key entities has real operational value.
How to Evaluate a System for Your Business
Organizations often misstep when evaluating platforms. They compare feature grids, watch polished demos, and ask whether the tool can connect to their CRM. Those questions matter, but they don't get to the heart of whether the system will still work when the business gets more complex.
A better evaluation starts with friction. Where does your team wait for answers today? Which reports break each month? Which decisions get delayed because people don't trust the numbers?
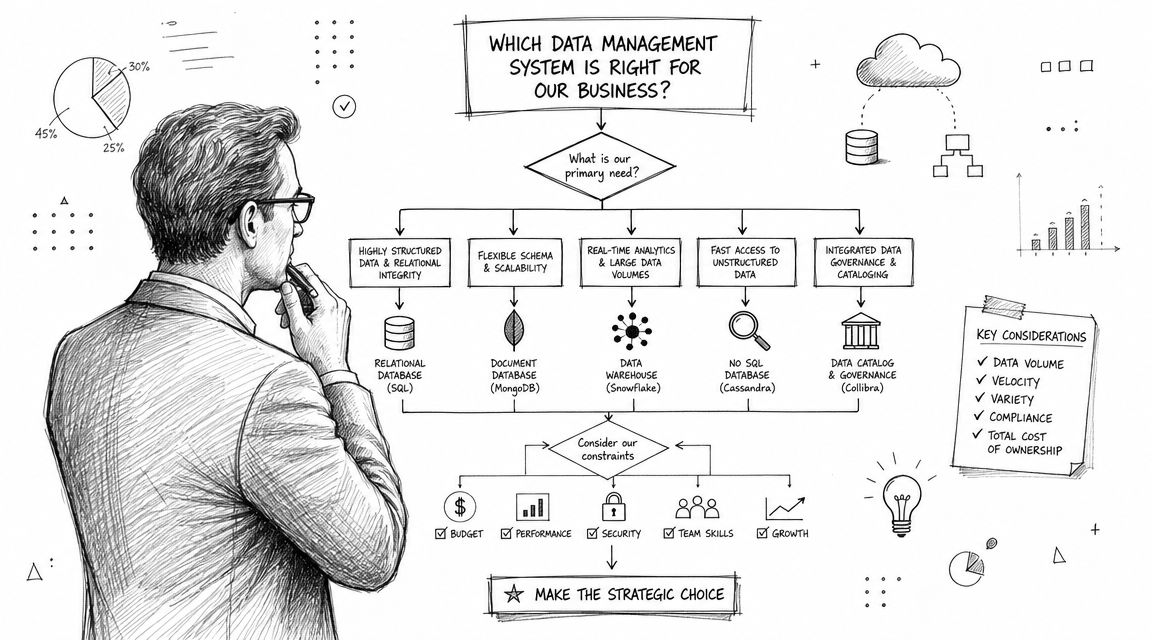
Start with decision speed not feature lists
For a startup or mid-market company, the right system is usually the one that reduces dependency on a few technical gatekeepers without sacrificing control.
Look for these signs of fit:
Integration reality. Can it connect cleanly to the systems you already use, including product databases, finance tools, CRM data, and file-based inputs?
Modeling discipline. Does it support shared definitions so revenue, churn, activation, and usage metrics don't drift by team?
Usability across roles. Can product, finance, and operations teams answer common questions without filing a ticket every time?
Governance without paralysis. Can the data team set standards and access controls without turning every request into a committee decision?
Scalability of process. As sources and users grow, does the workload become more repeatable or more chaotic?
One decision founders often underestimate is whether to assemble their own stack or adopt a more opinionated solution. This breakdown of buy versus build in analytics infrastructure is useful because it frames the tradeoff around maintenance burden and flexibility, not just purchase price.
Questions that reveal long term fit
One underserved issue is unstructured data. A lot of teams ask only how they'll store files and make them searchable. That's too narrow. The more valuable question is how the system will make messy content governable and usable for analytics, AI, and policy management across environments, as discussed in this analysis of unstructured data management solutions.
That changes the evaluation conversation. Instead of “Where do we put documents, transcripts, and logs?” ask:
Can we apply policy and ownership to this data?
Can we connect it to structured business context like customer, account, or transaction?
Can we use it without creating yet another silo?
A few more questions expose whether a vendor is selling storage or an actual operating system for data:
What happens when schema changes upstream?
How does the system show lineage and ownership?
Can non-technical users work safely without hidden spreadsheet logic?
How easy is it to move logic into version-controlled workflows?
What breaks first when the company adds new teams, markets, or products?
A short walkthrough can help you stress-test your thinking before purchase.
The strongest buying decision usually feels less exciting than founders expect. It doesn't promise magic. It gives your team a stable place to centralize logic, govern access, and evolve without rebuilding the whole stack every six months.
Common Implementation Pitfalls and Best Practices
Most failed data projects don't fail because the company chose the wrong database. They fail because the team tried to solve every problem at once, or because they treated data quality as cleanup work for later.
Where teams go wrong
A common pattern looks like this. Leadership asks for a single source of truth. The team starts ingesting everything. Definitions stay fuzzy because everyone is in a rush. By the time dashboards appear, users find conflicting fields, undocumented logic, and stale tables.
Another mistake is buying a platform before agreeing on operating rules. If sales defines customer one way, finance defines it another way, and product uses a third version, no software layer can fix that on its own.
Teams also underinvest in monitoring. They assume pipelines are correct until a quarterly review exposes a broken join or duplicate records that have been flowing downstream for weeks.
Strong implementations treat bad data like an operational incident, not an analytics inconvenience.
If you need a visual reference for ownership, rules, and controls, these visuals for data governance strategies are useful because they make abstract governance choices easier to discuss across technical and business teams.
What strong implementations do differently
The most effective design choice is to treat data management as a closed-loop system. SAP emphasizes the importance of ingesting data, validating quality, enforcing governance, monitoring health, and feeding issues into remediation workflows so inconsistent data doesn't spread downstream, as outlined in SAP's explanation of data management.
That principle changes implementation behavior:
Start with one high-value workflow. Revenue reporting, product activation, or customer health are better starting points than “all company data.”
Define ownership early. Someone should own metric definitions, table quality, and access decisions.
Automate checks close to ingestion. Catching issues upstream is cheaper than explaining broken dashboards later.
Document decisions where people work. A metric isn't governed if the definition only lives in one analyst's head.
Review drift regularly. Teams change, systems change, and business terms change. Your system has to absorb that without collapsing.
The practical goal isn't perfection. It's a system that gets more trustworthy as people use it.
Beyond Traditional BI The Modern Alternative
A lot of founders are taught to aim for a single source of truth and assume a traditional BI layer will deliver it. In practice, that setup often becomes rigid. Central models take too long to update, business definitions drift across teams, and analysts become the human translation layer between executives and the warehouse.
That's not only a tooling problem. It's an operating model problem.
Why the single source of truth often breaks down
The ideal often fails because businesses don't stand still. Teams launch new products, rename segments, add regions, merge systems, and revise metrics. Rivery's practitioner guidance argues that the “single source of truth” model often breaks down because of integration problems, business-context drift, and weak data contracts, and that fast-growing companies usually need a more well-governed, contract-driven system than a perfectly centralized one, as described in Rivery's review of data management challenges.
That's a useful correction. Founders don't need one mystical table that solves all ambiguity. They need a system where definitions are explicit, changes are controlled, and analysis can evolve without breaking trust.
Traditional BI tools often struggle here because they sit above the warehouse and accumulate business logic inside dashboards, semantic layers, and analyst-maintained models. Over time, the reporting layer becomes its own silo. People ask for a new cut of the data, and the queue starts again.
Here's where a code-driven, warehouse-native approach becomes more pragmatic. Instead of pushing logic into scattered dashboards, teams keep data work closer to the warehouse itself. Analysis runs on the live warehouse. Logic can live in version-controlled notebooks or files. Reuse becomes easier because transformations, definitions, and investigations are visible and reproducible.
Traditional BI vs warehouse native thinking
This is the practical difference.
Aspect | Traditional BI (Looker, ThoughtSpot) | Warehouse-Native (Querio) |
|---|---|---|
Where logic lives | Often split across BI models, dashboards, and analyst workflows | Closer to the warehouse in reusable files or notebooks |
Change management | Can become dependent on dashboard owners and BI specialists | Easier to manage with code review and version control habits |
Self-service | Users often get answers through curated dashboards or analyst support | Users can explore live warehouse data through a governed interface |
Reproducibility | Logic may be hard to trace if it's spread across many assets | Analysis is easier to inspect and rerun when stored as code |
Team bottlenecks | Analysts often mediate new questions | Data teams can focus more on infrastructure and standards |
Fit for fast-changing businesses | Can feel rigid when definitions shift often | Better suited to iterative modeling and changing business context |
This doesn't mean dashboards disappear. Executives still need recurring views. Teams still need shared metrics. The shift is where the system places flexibility. In a warehouse-native setup, the warehouse is not just where data sits. It's where governed analysis happens.
That model also connects better to newer AI workflows. If you're feeding retrieval systems, internal assistants, or search tools with business data, you need governed access to current context, not copies trapped in separate BI silos. For teams exploring that direction, a tool like Web Scraping API for RAG can be relevant when you need external web data to feed retrieval-based workflows alongside your internal warehouse context.
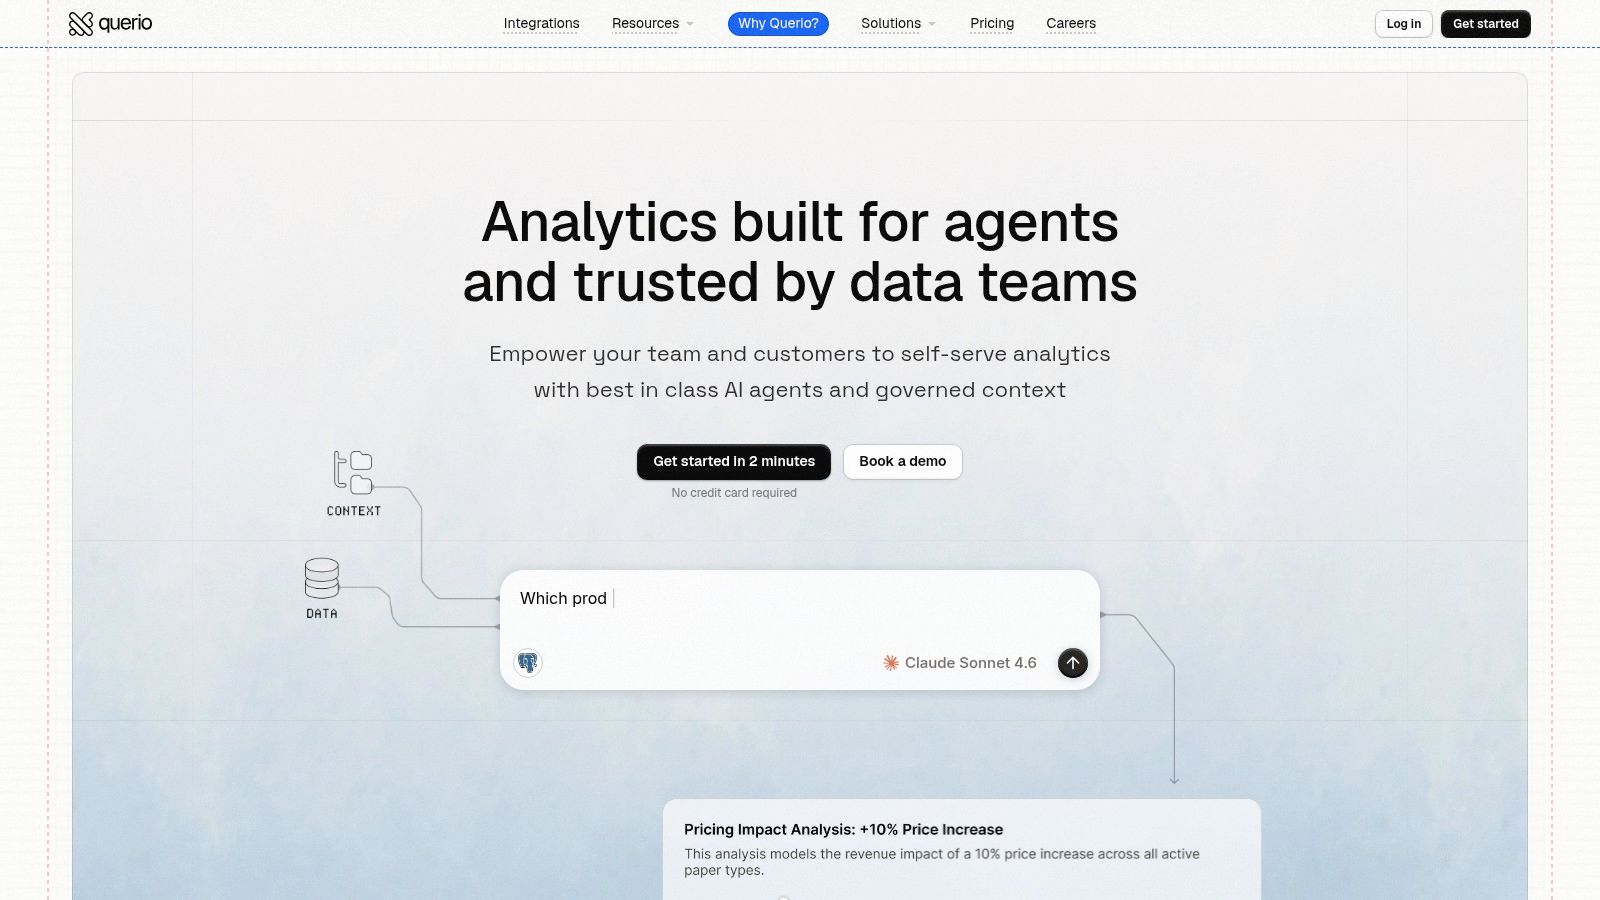
One example of this warehouse-native model is Querio, which deploys AI coding agents directly on the warehouse and uses a file-system approach with Python notebooks so both technical and non-technical users can query and analyze company data without relying on a traditional BI queue. That matters most for mid-market teams whose analysts are overloaded and whose business logic changes too fast for dashboard-first workflows.
The broader point is simpler. A modern data management system for an agile company shouldn't stop at storage, governance, and reporting. It should reduce analyst bottlenecks, keep logic close to the data, and let the business ask better questions without rebuilding its stack every quarter.
If your team is stuck between messy self-serve spreadsheets and overloaded analysts, Querio is worth a look. It gives companies a warehouse-native way to query live data, work in reusable notebook-style files, and turn the data team from a reporting bottleneck into the group that maintains scalable self-service infrastructure.

