Guide
Data Discovery Tools: A Guide to Finding Hidden Insights
Explore what data discovery tools are, how they work, and key features to look for. This guide helps you choose the right solution to unlock insights faster.
A product lead needs one number before a roadmap review. A marketing manager wants to know which signup channel converts to retained users. A founder asks a simple question in Slack and gets the same answer every data team gives when demand outruns capacity: “We'll add it to the queue.”
That queue is the problem. Not SQL. Not dashboards. Not even a lack of data. The problem is that too many companies still treat analytics like a service desk. Business teams ask. Analysts translate. Engineers patch pipelines. Everyone waits.
That model breaks fastest in startups and mid-market companies because decisions move faster than reporting cycles. By the time someone updates the dashboard, the question has changed. That's why data discovery tools matter. They shift data access from ticket-based retrieval to self-service exploration, so teams can find, understand, and work with data without needing a specialist for every request.
The category is growing for a reason. The global data discovery market is projected to grow from USD 15.6 billion in 2025 to USD 68.8 billion by 2035 at a 16% CAGR, reflecting rising demand for tools that let business users find insights without deep technical expertise, according to Market.us research on the data discovery market.
This shows up well beyond finance or growth analytics. People teams run into the same bottleneck when they try to answer workforce questions across recruiting, performance, and retention. If you want a grounded example of how operational decision-making changes when teams can access and interpret workforce data, this guide on what is people analytics is worth reading.
The deeper shift is organizational. Data teams shouldn't operate as a human API. They should build the environment that lets everyone else move faster. That's the difference between shipping reports and fixing the actual bottleneck, which is the same argument behind stop being the data team bottleneck.
Table of Contents
- Introduction Beyond the Overwhelmed Data Team
- What Are Data Discovery Tools Really
- Core Capabilities of Modern Data Discovery
- Comparing Data Discovery Approaches
- How to Evaluate and Choose the Right Tool
- Bridging the Gap with a Notebook-First Approach
- Implementation Best Practices for Success
Introduction Beyond the Overwhelmed Data Team
Many teams don't realize they have a data discovery problem. They think they have a staffing problem.
A backlog makes it feel like the answer is hiring another analyst, adding another BI engineer, or buying another dashboarding layer. Sometimes that helps for a quarter. Then request volume rises again, definitions drift again, and leaders still can't get a trustworthy answer without waiting.
The hidden cost is decision latency. Product teams delay experiments because they can't inspect user behavior fast enough. Revenue teams keep debating channel quality because no one can drill past a summary chart. Executives start making judgment calls where a simple exploration of the underlying data would've settled the question in minutes.
Teams rarely need “more dashboards.” They need a faster path from question to evidence.
That's where data discovery tools earn their keep. At their best, they don't just expose tables and field names. They help people find the right dataset, understand what it means, trace where it came from, and explore it without filing a request.
In practice, that changes the operating model. Analysts spend less time on repetitive extraction work and more time on modeling, experimentation, and decision support. Business users stop depending on stale reporting for every new question. Leaders stop treating analytics as a queue to manage.
The companies that get this right usually make one mindset change first. They stop asking, “How do we answer more tickets?” and start asking, “How do we make fewer tickets necessary?”
What Are Data Discovery Tools Really
A lot of software gets labeled as “discovery.” That's part of the confusion.
The easiest way to understand data discovery tools is to compare them with an old library system. Traditional data management often works like a card catalog. Information exists, but you need to know where to look, how it was filed, and often who to ask for help. Modern data discovery should feel more like a search engine for company data. You ask a question, find relevant assets, inspect context, and keep exploring.
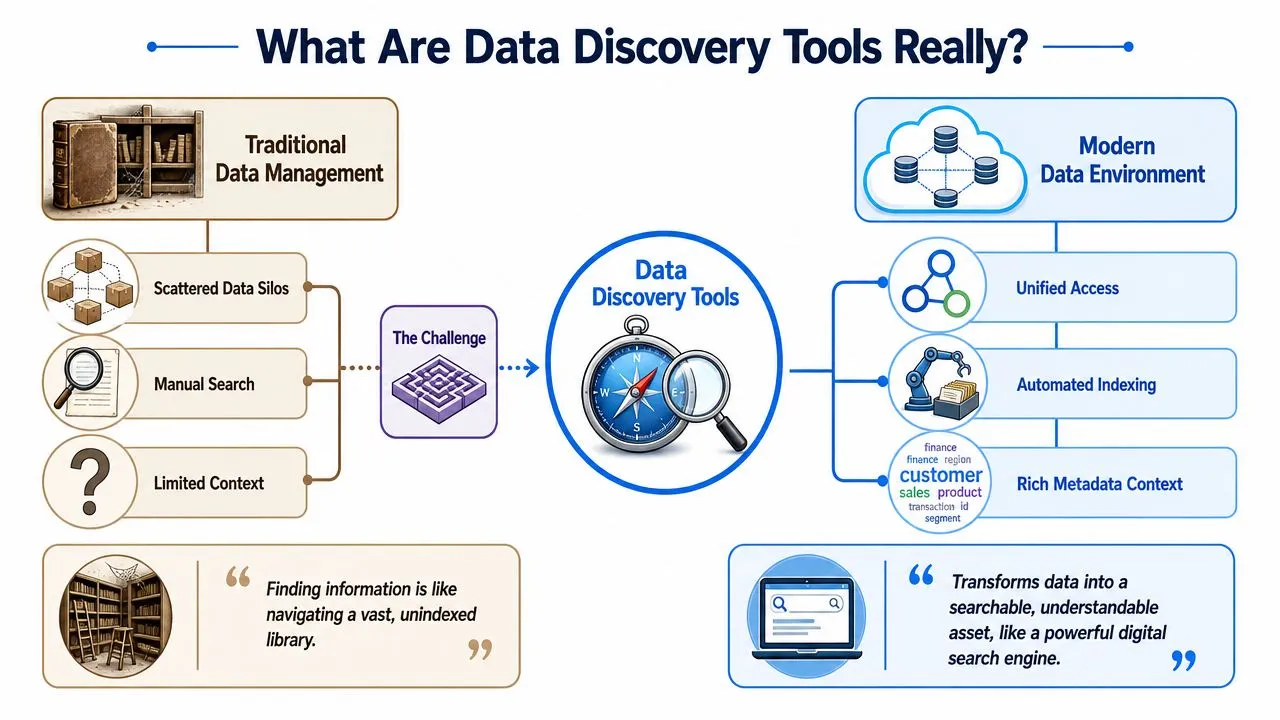
From card catalog to search engine
Traditional BI tools were built around a different contract. An analyst or analytics engineer models the data, defines the metrics, and publishes dashboards. That works well for recurring reporting. It works poorly when a user asks an unplanned question like:
- Why did activation drop for one segment but not another?
- Which events define meaningful engagement for this product line?
- Is this metric based on billing date, usage date, or booking date?
A dashboard can display answers that were anticipated. Discovery starts when the question wasn't anticipated.
That's why good data discovery tools combine search, context, metadata, and exploration. They don't assume the user already knows which schema matters or which dashboard owner to message. They reduce the friction between “I need to know” and “I can verify it myself.”
If you're hiring for this kind of environment, the work also shifts. The role becomes less about manually producing every answer and more about designing systems, definitions, and workflows others can use. This breakdown of data scientist roles is a useful reminder that many teams still overload data specialists with retrieval tasks that software should handle.
Why this category keeps expanding
The category keeps growing because data volume, data sources, and user expectations keep growing with it. In North America, the market was valued at USD 1.62 billion in 2023, and that scale has been driven by strong enterprise adoption of analytics platforms from vendors such as Tableau, Microsoft, and Oracle, which increasingly include discovery features, according to Market Research Future's data discovery market analysis.
That detail matters because many companies first encounter discovery inside a familiar BI product. Then they hit the limits.
A dashboard tells you what someone already decided to publish. Discovery helps you find what no one packaged yet.
That distinction is also helpful when comparing broader analytics tooling categories. If you want a practical framing of where discovery fits relative to reporting, querying, and analysis workflows, what are data analysis tools definitions examples and use cases is a good companion read.
Core Capabilities of Modern Data Discovery
The best data discovery tools do three jobs at once. They make data easier to find. They make it easier to trust. And they make it easier to use without forcing every question through an analyst.
A tool that only does search isn't enough. A tool that only does visualization isn't enough either. Modern teams need a system that connects metadata, lineage, permissions, and actual exploration.
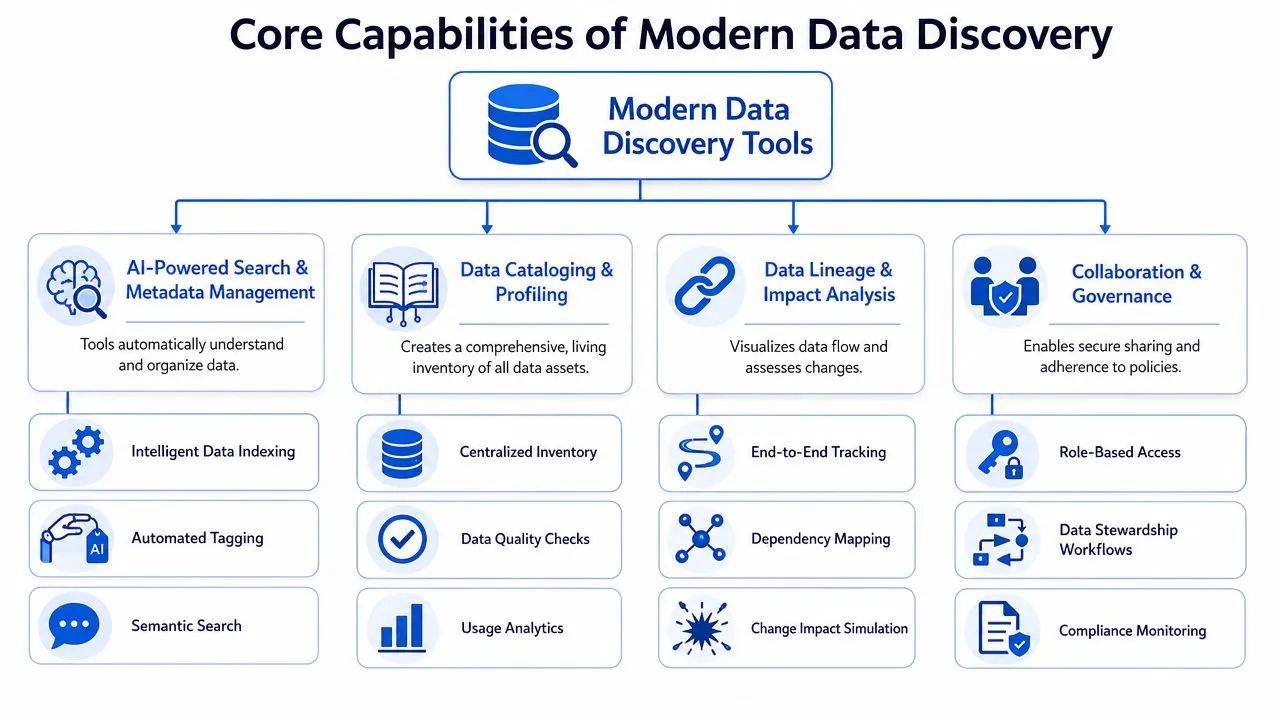
AI makes data findable and trustworthy
The strongest shift in this category is the move from static cataloging to AI-assisted understanding. Modern tools use AI and large language models to automate lineage tracking and data mapping, making discovery results up to 10 times faster than manual research, according to data.world's comparison of data discovery tools.
That speed matters, but trust matters more. A search bar is only useful if the result comes with enough context to answer three questions quickly:
- What is this dataset
- Where did it come from
- Should I rely on it for this decision
Without lineage and metadata, users still end up in Slack asking the same questions they asked before. The tool changed. The dependency didn't.
A useful discovery layer should surface field definitions, ownership, upstream sources, and obvious caveats. If a metric changed because the underlying logic changed, users should be able to see that path instead of guessing.
Exploration has to work for more than analysts
Discovery also fails when it only serves one user type.
Business users need search, filtering, previews, and plain-language paths into the data. Analysts need enough depth to move beyond a preview into real investigation. Engineers need to understand dependencies and source reliability. A lot of tools handle one of those personas well and leave the others half-served.
Here's the practical standard I use:
- For business users: They should be able to locate a relevant dataset, understand its purpose, and answer a first-order question without writing code.
- For analysts: They should be able to move from discovery into transformation, validation, and deeper analysis without exporting into a fragmented workflow.
- For engineers and governance owners: They should be able to trace impact, inspect quality signals, and control access without bolting on separate systems.
A visual interface helps. It just shouldn't become a ceiling.
This is also why a lot of “self-service analytics” rollouts disappoint. Teams equate self-service with charts. But real self-service means the user can start with a question and keep going until they reach a defensible answer.
Before the video below, it's worth holding one principle in mind: discovery has to shorten the path from question to verified context, not just make the interface friendlier.
Governance decides whether self service scales
The final capability is the one teams postpone until it becomes a problem. Governance.
If discovery is open but undefined, people find conflicting datasets and lose trust. If governance is too rigid, nobody can explore. The right balance is operational: enough access control and lineage to protect the system, enough flexibility for real questions.
Practical rule: If users can discover data but can't tell which version is trusted, you haven't delivered self service. You've delivered searchable confusion.
That's why the better platforms treat governance as part of discovery, not as a separate compliance layer added later. Permissions, data sensitivity, ownership, and integration with BI or governance tools all shape whether adoption expands or stalls.
Comparing Data Discovery Approaches
For teams, the choice isn't typically between “good” and “bad” tools. They choose between mismatched operating models.
The market usually falls into three practical approaches. Traditional BI platforms with some discovery features. Dedicated visual discovery platforms. Notebook-based environments that combine discovery with direct analytical work. Each can work. Each also fails in predictable ways.
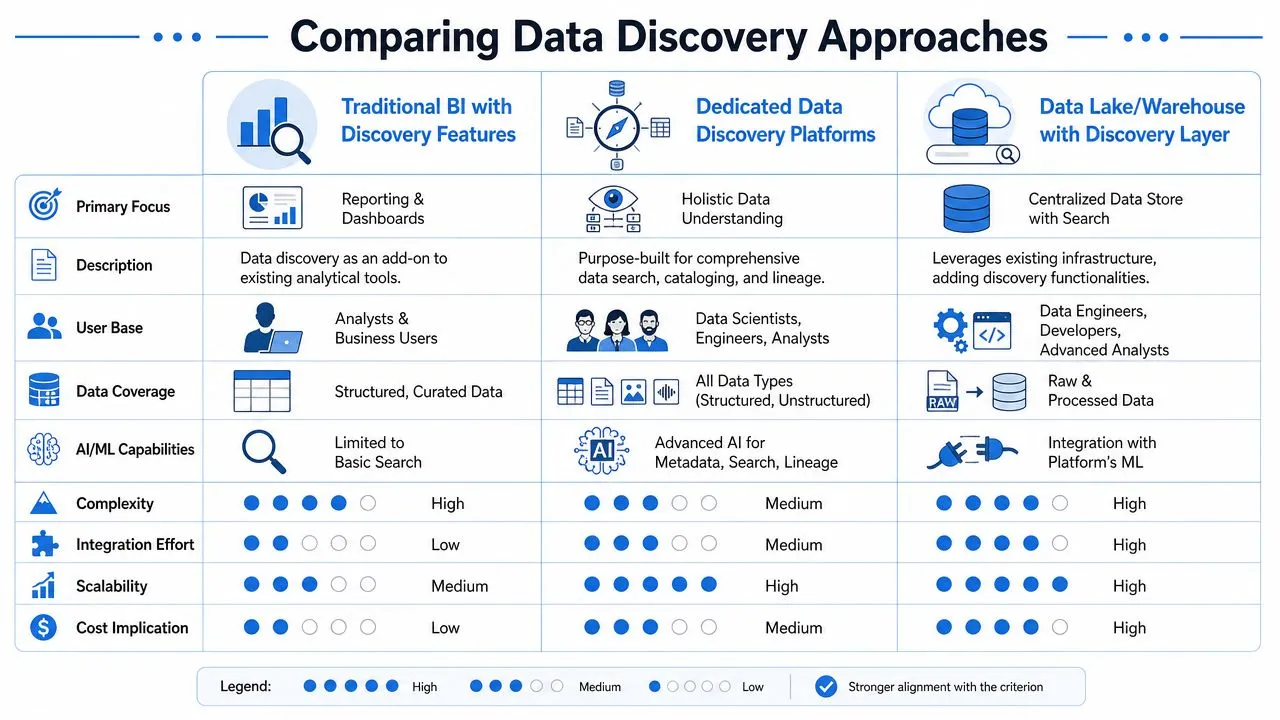
Traditional BI with discovery features
Tools like Tableau, Looker, and Microsoft Power BI are strong when the company needs standardized reporting. They give teams a governed layer of metrics and a familiar place to consume information.
Their weakness is that most exploration still happens inside predefined models and views. Once the user's question falls outside the dashboard designer's assumptions, the experience gets awkward. You either duplicate logic, create one-off reports, or fall back to asking an analyst.
This approach is best when the business mostly needs repeatable reporting and limited ad hoc analysis.
Dedicated visual discovery platforms
Products in this group focus more directly on search, interactive exploration, and data understanding. They usually do a better job than classic BI at helping users start from a question instead of a dashboard.
The trade-off is depth. Visual interfaces are excellent for fast slicing, pattern spotting, and lightweight investigation. They're less comfortable when the work turns into custom logic, iterative modeling, or reusable analytical workflows. At that point, teams often bounce between the discovery tool, SQL editors, notebooks, and spreadsheets.
That fragmentation is exactly where a lot of “modern analytics” stacks still break.
Notebook based discovery platforms
Notebook-first platforms take a different view. They don't assume that discovery and analysis should happen in separate systems. They treat search, context, code, and outputs as part of the same workspace.
That makes them especially useful for fast-moving product, growth, and data teams that need both accessibility and depth. A business user can begin with a template or guided prompt. An analyst can inspect the generated logic, refine it, and turn it into a reusable asset. An engineer can keep governance closer to the underlying warehouse instead of rebuilding logic in every dashboard.
If you're weighing interface-led exploration against more flexible workflows, SQL vs AI-driven data exploration is a useful way to frame the decision.
Data Discovery Approaches Compared
| Approach | Primary User | Best For | Key Limitation |
|---|---|---|---|
| Traditional BI with discovery features | Business users and analysts | Standardized reporting and shared dashboards | Struggles with unplanned questions and deeper custom analysis |
| Dedicated visual discovery platforms | Analysts, business users, some data teams | Fast ad hoc exploration through search and visuals | Can become shallow when teams need code-level flexibility |
| Notebook-based platforms | Analysts, data teams, technical and semi-technical business users | Exploration that moves directly into custom analysis and reusable workflows | Requires better workflow design and enablement than a pure dashboard tool |
The wrong tool usually doesn't fail because it lacks features. It fails because it assumes the wrong way of working.
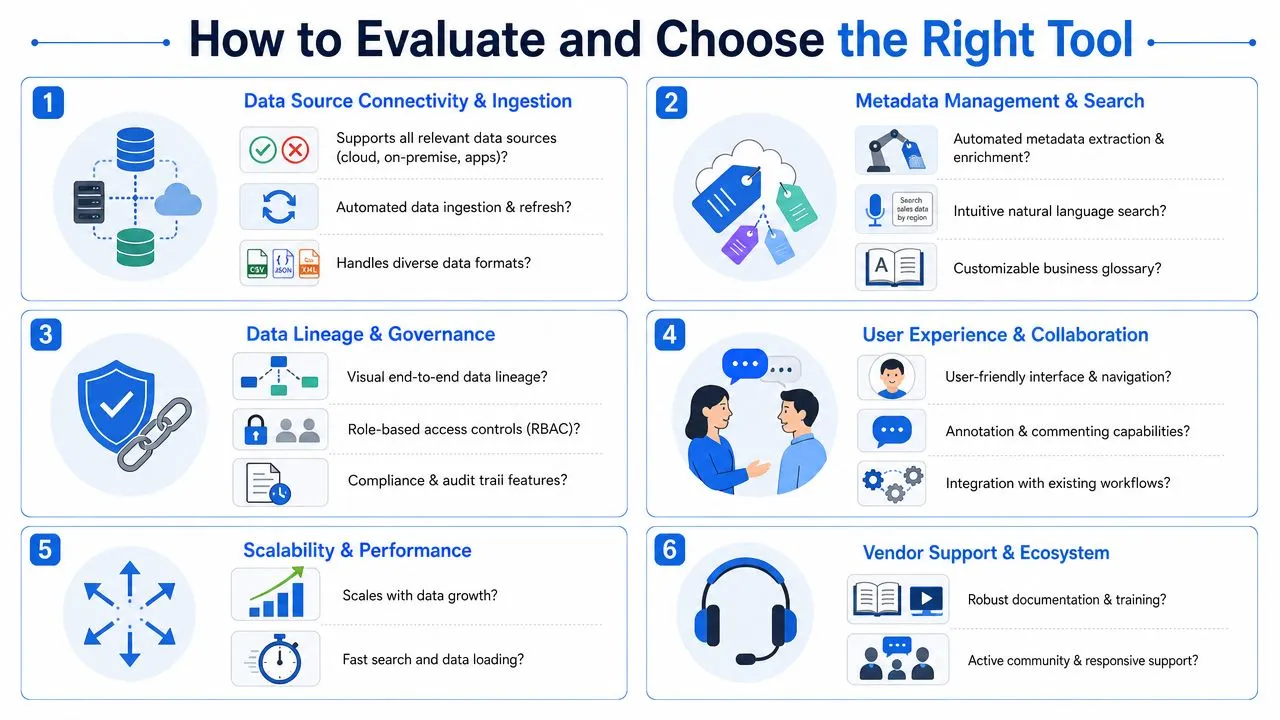
How to Evaluate and Choose the Right Tool
Vendor demos make almost every product look capable. The hard part is separating a smooth interface from a tool your team will still rely on six months later.
A practical evaluation starts with one question: can this tool reduce dependency on the data team without creating a mess in governance, definitions, and security? If the answer is no, it's not solving the problem.
Questions that expose the real fit
One benchmark is clear: effective platforms need five critical technical capabilities to produce measurable ROI. Those are cloud, hybrid, and on-prem interoperability; automated PII detection; visual lineage mapping; role-based access control; and smooth integration with BI and governance tools, according to OvalEdge's guide to data discovery tools.
That list is useful because it translates marketing language into things you can test.
Ask vendors questions like these:
- Can it connect to the systems we already use: If your warehouse, SaaS tools, and operational databases live in different environments, discovery can't stop at one layer.
- How does it detect sensitive data: “Security” is vague. Ask how PII is identified, tagged, and controlled.
- Can users see lineage visually: If a metric changes, can a business user or analyst trace where that change came from?
- What access model does it support: Role-based access sounds standard until you need to enforce it across multiple teams and use cases.
- Does it fit the rest of the stack: Discovery should connect cleanly to BI, governance, and workflows already in place.
One useful way to sharpen your evaluation thinking is to look outside the category. This piece on selecting thematic analysis software is about qualitative research tooling, but the decision logic is familiar: adoption depends on fit with real workflows, not just feature breadth.
What to test in a proof of concept
Don't run a proof of concept on a clean demo dataset. Use one business question that currently causes friction. Something like a retention question that spans product events, billing data, and CRM attributes. Then see what happens.
Look for these signals:
- Time to first useful answer: How quickly can a non-technical or semi-technical user get to a trustworthy starting point?
- Context quality: Are ownership, definitions, and lineage visible where the work happens?
- Workflow continuity: Does the user have to jump across too many tools to keep going?
- Governance under pressure: Can the team move quickly without exposing the wrong data or creating metric drift?
A weak tool looks polished in a demo and brittle in real use. A strong one holds up when the question gets messy.
Bridging the Gap with a Notebook-First Approach
The gap in this market isn't hard to describe. Visual BI is often too rigid. Pure discovery interfaces are often too shallow. Raw notebook environments are often too technical for broad adoption.
That leaves a lot of teams stuck with a split workflow. Business users search in one place. Analysts validate in another. Engineers productionize in a third. Every handoff adds delay and room for interpretation.
Why visual only self service runs out of road
This is the limitation many teams feel but don't name clearly. Visual self-service works well until the question requires custom logic, intermediate calculations, or reusable analysis beyond drag-and-drop patterns.
At that point, the tool often reveals its real assumption: that serious analytical work happens somewhere else.
Analyses of tool selection often skip this trade-off, even though file-system-based approaches using Python notebooks can reduce analyst wait times by up to 80% and support a new self-service model, as described in Secuvy's discussion of data discovery tool evaluation.
Why notebooks change the operating model
A notebook-first approach works because it closes the distance between discovery and execution. The same environment can support guided access for non-technical users and deeper custom work for analysts and engineers.
That matters operationally. Instead of the data team answering every question directly, they can create templates, approved logic, reusable notebooks, and governed paths into warehouse data. The business team gets faster answers. The data team keeps control where it matters.
One example in this category is Querio, which uses a file-system approach with custom Python notebooks so teams can explore warehouse data without relying entirely on dashboards or analyst queues. That model is close to the broader argument in notebook-first BI stack data engineers hate dashboards.
The real upgrade isn't replacing one interface with another. It's replacing ticket-based analytics with shared analytical infrastructure.
A notebook-first model won't fit every company. If your needs are mostly recurring executive reporting, classic BI may be enough. But if your teams regularly move from question to custom analysis, this approach is much closer to how modern work happens.
Implementation Best Practices for Success
Tool choice matters less than rollout discipline.
Start with one high-friction use case and make it visible. Don't launch discovery as a broad platform initiative with vague goals. Pick a workflow where people already feel the pain, such as product funnel analysis or cross-functional growth reporting, and prove that teams can answer those questions faster with less analyst intervention.
Then protect the quality layer early:
- Define trusted starting points: Give users approved datasets, clear owners, and business definitions.
- Train for exploration, not just clicks: People need to learn how to validate, not just how to search.
- Measure operating change: Look for reduced queue dependence, faster decision cycles, and better reuse of shared logic.
- Keep the data team in an enablement role: They should design guardrails, not become the fallback for every unresolved question.
The companies that get value from data discovery tools don't treat them like another reporting product. They use them to redesign how questions get answered.
If your team is stuck between slow BI workflows and overly technical notebook setups, Querio is worth a look. It uses AI coding agents on top of your data warehouse and a notebook-first, file-system approach so technical and non-technical teams can explore live data in the same environment, with the data team focused on enablement instead of ticket triage.