Business Intelligence
What’s the best way to introduce self-service analytics in an organization?
Implementing self-service analytics can enhance decision-making by empowering teams to analyze data efficiently, ensuring data quality and user engagement.
Self-service analytics tools empower teams to analyze and act on data without relying on IT, speeding up decision-making and improving efficiency. To implement it effectively:
Assess readiness: Review current data usage, identify bottlenecks, and ensure data quality.
Set goals: Define measurable targets like adoption rates and time-to-insight.
Engage stakeholders: Involve decision-makers, data teams, and end-users early.
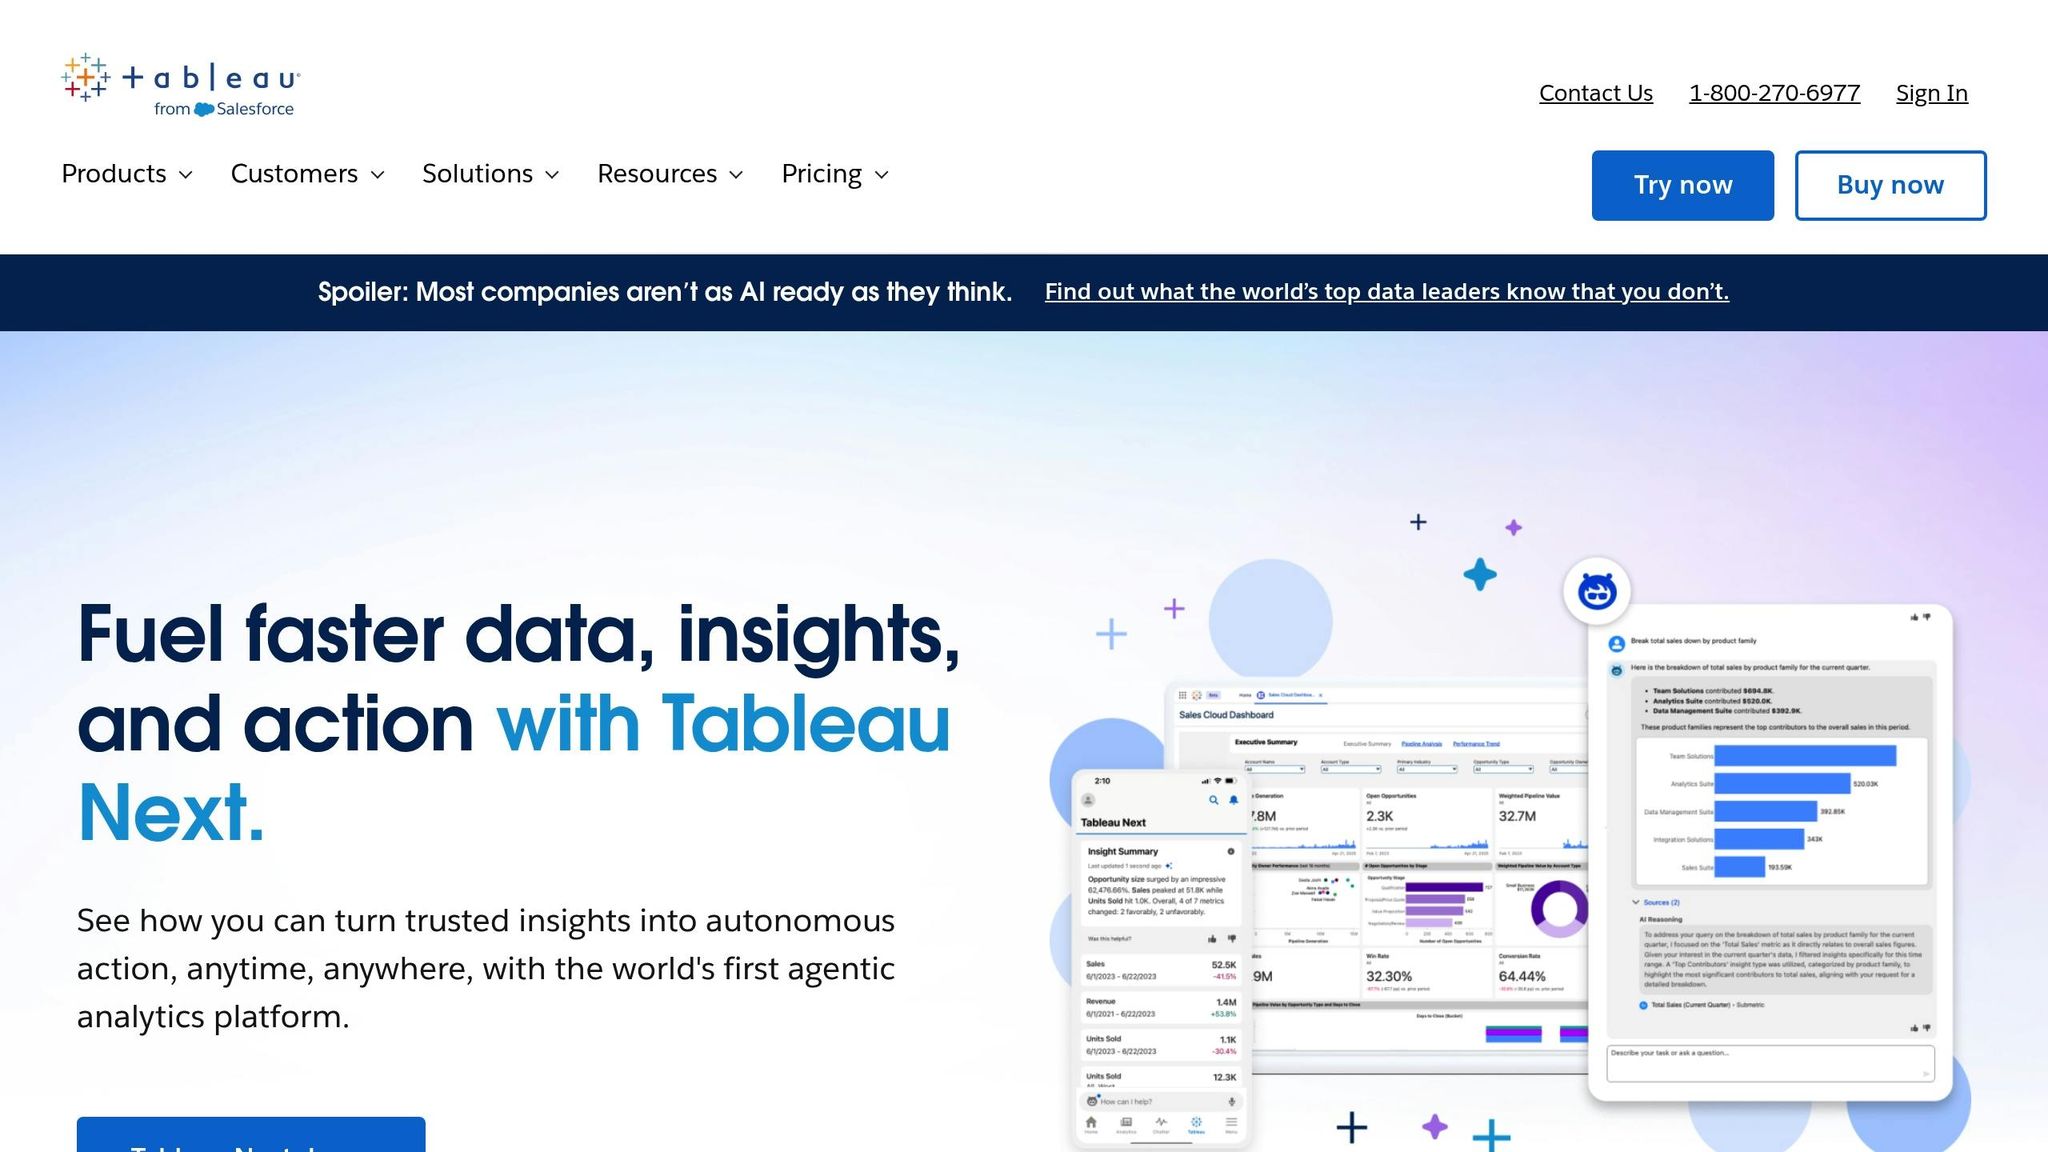
Choose the right platform: Look for essential features of modern business intelligence tools like natural-language querying, live data connections, and strong governance.
Establish governance: Implement role-based access controls and a centralized business glossary.
Train users: Offer tailored onboarding, mentorship, and ongoing support.
Monitor and scale: Collect feedback, track results, and expand infrastructure as adoption grows.
Real-world examples show organizations cutting report generation time by 50% and reducing IT support requests by up to 60%. By focusing on clear goals, user training, and continuous improvement, self-service analytics can transform how teams make decisions.
Implement a Self-Service Analytics Framework | Tableau
Assess Readiness and Set Clear Goals
Before diving into self-service analytics, take a step back to evaluate your organization's current data practices and set clear, measurable goals. This groundwork is essential for a smooth rollout and helps avoid common challenges that could sidetrack your efforts.
Review Current Data Usage and Challenges
Start by analyzing how your teams currently interact with data. Are there bottlenecks or inefficiencies holding them back? Identifying these pain points can reveal where self-service analytics can make the biggest impact.
Take a detailed look at your data processes. Document how data requests are made, who handles them, and how long responses typically take. Talk to key team members to understand their data needs and frustrations. For instance, does your marketing team wait days for campaign performance reports? Are your sales managers struggling to access real-time pipeline updates? Pinpointing these issues is crucial.
"Self-service analytics empowers business users to generate reports, visualizations, and analyses easier and faster, helping them respond more effectively to changing conditions." - Mike Chen, Content Strategist, Oracle [2]
Next, assess the quality and governance of your data. Even the best analytics tools can falter if your data sources are unreliable or poorly documented. A data catalog that outlines available sources, their quality, and ownership can help users trust and effectively use the data.
This thorough review pays off. A well-executed self-service analytics program can cut the time needed to generate key business reports by 50% [1]. For example, in March 2023, a healthcare provider reduced patient wait time reporting by 30% by leveraging existing EHR data. They achieved this by training staff on new analytics tools and implementing strict data governance policies to maintain quality and compliance [3].
Once you’ve mapped out your current practices, it’s time to define clear goals that will guide your initiative.
Set Measurable Success Targets
Defining specific, measurable goals ensures your self-service analytics initiative stays on track and delivers value.
Focus on metrics that align with your business priorities. For example:
Adoption rates show how many users are actively using the tools.
Time to insight measures how quickly users can generate reports.
Decision-making efficiency evaluates whether teams are making faster, better-informed decisions.
Companies that establish clear goals often see 50% faster time to insight and a significant drop in analytics request backlogs [4]. These gains lead to quicker responses to market shifts and reduced pressure on IT teams by empowering teams with data-driven insights.
"Defining what success looks like for your self-service analytics initiative is crucial. Specific metrics will help you measure progress and demonstrate value to stakeholders." - Mike Chen, Content Strategist, Oracle [2]
Start with small, impactful projects that deliver quick wins. For instance, a retail chain achieved 92% adoption of its analytics tools by hosting weekly "Data Coffee Hours", where users could collaborate and share knowledge. This initiative also cut basic IT support requests by 30% within six months [5].
Set realistic timelines for achieving your goals. While it’s important to show early progress, rushing can lead to poor user experiences and low adoption. Consider piloting the program in one department before rolling it out across the organization.
With your goals in place, the next step is to identify key stakeholders who will drive the initiative forward.
Find Key Stakeholders and User Groups
A successful self-service analytics program requires collaboration across multiple teams. Engaging the right stakeholders early ensures the solution meets your organization’s needs and avoids potential roadblocks.
Key groups to involve include:
Decision-makers: They define business objectives and secure funding.
Data teams: They manage data quality, governance, and technical support.
End-users: Teams like marketing, sales, and finance provide feedback on usability and essential features - they’re the ones who will rely on the tools daily.
"Establishing a successful self-service analytics program requires precise planning and implementation." - Boomi [1]
Host workshops with these groups to gather input and align on goals before implementation. These sessions can surface valuable insights and address concerns upfront.
Clearly define roles for each stakeholder group. Decision-makers should focus on strategy and resource allocation. Data teams handle technical setup and governance. End-users participate in testing, provide feedback, and act as champions within their teams.
Finally, remember that building a culture of data literacy is just as important as the technology itself. Users need to feel confident interpreting and applying the insights they generate. This shift takes time and requires ongoing support from all stakeholders. By fostering collaboration and data literacy, your self-service analytics program will directly support your organization’s strategic goals.
Select the Right Self-Service Analytics Platform
Picking the right self-service analytics platform is a game-changer for your team’s ability to access and act on reliable data. The platform you choose directly impacts how quickly your organization can turn insights into action. The key is finding a solution that combines powerful features with an easy-to-use interface.
Here’s what to look for in a platform that empowers users while keeping your data secure.
Must-Have Platform Features
A good platform should eliminate technical barriers while ensuring data remains accurate and secure. One essential feature is natural-language querying, which allows users to ask questions in plain English. This simplifies the learning process and encourages adoption, especially for non-technical teams.
Another critical feature is live connections to your existing data warehouses. Platforms that connect directly to systems like Snowflake, BigQuery, or Postgres let users work with up-to-date information without creating data silos or relying on costly data duplication processes. This setup ensures real-time access while preserving data integrity.
AI-driven query generation is another game-changer. Instead of navigating complex interfaces, users can type straightforward questions like, “What were our top-performing products last month?” and get accurate visualizations in seconds.
To maintain consistency and trust in your data, look for platforms with robust governance tools. A semantic layer is especially helpful - it allows data teams to define business logic, table relationships, and metrics in one place. This ensures everyone uses the same definitions, reducing the risk of conflicting reports.
Lastly, consider platforms with unlimited viewer access. This pricing model makes it easier to share insights across your organization without worrying about escalating costs as more people join. It’s a great way to encourage widespread analytics adoption.
For example, Querio offers AI-powered natural-language querying and real-time connections to data warehouses. Users can quickly generate charts and insights, while data teams maintain control through a centralized context layer that governs metrics and business definitions.
Check Governance and Security Options
Strong governance and security features are non-negotiable when it comes to self-service analytics. Role-based access controls help ensure that users only see data relevant to their roles, striking the right balance between access and security.
Platforms with SOC 2 Type II compliance demonstrate a commitment to safeguarding data. This certification involves rigorous security protocols and regular third-party audits, making it essential for organizations handling sensitive information like customer or financial data.
Another important feature is read-only database connections, which allow users to analyze data without risking changes to the original source. This approach protects your data while giving users the access they need.
Reliability is also key - look for platforms that guarantee 99.9% uptime or higher. Analytics tools are often mission-critical, so service level agreements should include clear remedies and compensation for any prolonged downtime.
Plan for Growth and Budget
Your analytics platform should be able to grow with your organization without forcing costly migrations or overhauls. Look for transparent pricing models that make it easy to predict costs as your usage scales. Avoid platforms with hidden fees tied to data volume, queries, or additional features.
A scalable architecture is equally important. The system should handle increased user activity and larger data volumes without performance issues. Cloud-native platforms often excel in scalability compared to on-premises options.
When evaluating costs, think beyond licensing fees. Consider the total cost of ownership, including implementation, training, ongoing support, and any potential integration expenses. Some platforms may require significant customization or professional services, so factor these into your decision.
Flexibility is another key consideration. Platforms with deployment options - whether cloud-based, on-premises, or hybrid - can meet varying organizational needs, particularly for those with regulatory or data sovereignty concerns.
Lastly, check the platform’s integration capabilities. It should connect seamlessly with your existing data sources, business tools, and workflows, avoiding the creation of new silos.
Querio provides a great example of transparent pricing. At $14,000 annually for its core platform with unlimited viewer users, it offers predictable costs while encouraging widespread adoption. Add-ons like dashboards and extra database connections are clearly priced, making scaling straightforward.
To reduce risks and build internal support, look for vendors that offer pilot programs or proof-of-concept opportunities. These allow you to test the platform with real data and workflows before committing, helping you identify any potential challenges early on.
Set Up Governance and Drive User Adoption
Strong governance is the backbone of any successful analytics program. It not only prevents issues like conflicting reports and data trust problems but also encourages user adoption through tailored training and a shift in mindset. The goal is to strike a balance: give users the freedom to explore data while ensuring its security and reliability.
Create Governance Rules
Start by implementing role-based access controls and creating a centralized business glossary. This ensures everyone has secure and consistent access to data while aligning on key metrics like "customer acquisition cost", "monthly recurring revenue", and "churn rate." When these terms are defined in one place, teams avoid misinterpretations that can lead to errors.
Transparency is another critical piece. Tools for data lineage tracking can show the origins and transformations of data, making it easier to build trust and troubleshoot issues. Many modern platforms even offer automated lineage tools that map data flows without requiring manual documentation.
You might also consider forming a Center of Excellence (CoE) to oversee your analytics program. A CoE typically includes members from IT, business units, and data teams who collaborate on governance policies, training, and best practices. Organizations using a federated model, where IT and business users share responsibility for data management, often report higher adoption rates and better-quality data. This approach provides secure access while giving users the autonomy they need.
Concrete examples highlight the impact of robust governance. For instance, in October 2025, Block (formerly Square) conducted an audit of their Looker dashboards, linking each one to a specific business owner. This effort improved discoverability and boosted confidence in their analytics tools. Similarly, Microsoft’s 2025 Power BI update introduced a "Govern" tab, centralizing dataset ownership and certification details. This feature has made it easier for IT teams to monitor compliance and maintain trust in analytics.
"Governance isn't bureaucracy; it's what allows analytics to grow safely. Think of it as a seatbelt for data - something that doesn't slow you down, but protects you as you accelerate."
Iteration Insights [6]
It's worth noting that 93% of users with self-service BI systems cite governance as a major concern. This underscores the need for frameworks that prioritize data integrity and trust.
Design Training and Onboarding
Effective training makes all the difference. Tailor learning experiences to specific roles - for example, sales managers might focus on pipeline metrics, while marketing teams dive into campaign performance and lead generation analytics.
A phased onboarding process works best. Start with the basics, like navigation and simple queries, before moving on to more complex tasks like creating custom visualizations or setting up alerts. This gradual approach prevents users from feeling overwhelmed.
Pairing experienced users with newcomers through mentorship can provide real-time guidance and practical tips. Additionally, creating communities of practice - such as Slack channels, lunch-and-learn sessions, or monthly meetups - encourages collaboration and shared learning.
Don’t stop at initial training. Offer ongoing learning opportunities, like monthly reviews to introduce new features, share success stories, and address common challenges. Build a library of resources, including video tutorials, quick-reference guides, and FAQs, so users can find help whenever they need it.
Organizations that prioritize comprehensive training often see a significant boost in analytics usage. In fact, 30% of users report improved decision-making when supported by strong training programs [7]. These efforts create a foundation for a data-focused environment where collaboration and leadership drive adoption.
Build a Data-Focused Culture
Governance and training are essential, but fostering a culture that values data is equally important. Executive sponsorship plays a key role here. Leaders can set the tone by referencing data in meetings, requesting analytics support, and celebrating wins tied to data-driven decisions.
Sharing success stories is another way to inspire adoption. Highlight how teams have used analytics to solve problems, uncover opportunities, or streamline processes. A monthly newsletter or presentation can showcase these achievements and make the benefits of self-service analytics clear.
Collaboration between IT and business teams is vital. IT ensures tools and governance policies are practical, while business users provide feedback on data quality and functionality. This partnership ensures that governance remains user-friendly and effective.
It’s also important to acknowledge that many employees feel overwhelmed by data. Creating a supportive environment - where questions are encouraged and mistakes are seen as learning opportunities - can help ease this anxiety.
Consider the example of a retail company that, in March 2023, implemented a self-service analytics platform. The initiative, backed by a thorough training program and clear governance policies, led to a 40% increase in data-driven decision-making across departments. Improved collaboration and faster insights were the result [9]. However, only 27% of executives say their analytics projects yield actionable insights, emphasizing the need for proper implementation strategies [9].
"Without strong data governance, self-service data analytics will fail."
Regular feedback is essential for continuous improvement. Surveys, user roundtables, and usage analytics can help refine your approach as your organization evolves. When governance, training, and culture align, self-service analytics becomes a powerful tool - empowering teams while safeguarding data integrity and security.
Maintain Success and Scale Up
Getting your self-service analytics program off the ground is just the beginning. Keeping it running smoothly - and scaling it as your organization grows - requires constant attention to user needs, infrastructure upgrades, and tracking measurable outcomes. If you treat implementation as a one-and-done task, you risk seeing adoption rates stagnate or even decline. The key is to use feedback to drive ongoing improvements and ensure your infrastructure can keep up with increasing demands.
Collect Feedback and Make Improvements
To keep your self-service analytics program thriving, you need to listen to your users. Regularly collecting feedback helps pinpoint issues before they become major roadblocks. By monitoring usage data, you can spot trends: Are certain features being ignored? Are users struggling with specific tools? These insights help you prioritize updates and training efforts.
Take Medtronic, for example. In March 2025, they introduced a robust feedback system for their analytics platform. The results? A 40% jump in user engagement and a 25% drop in support tickets related to analytics queries. John Smith, their Data Analytics Manager, highlighted how user input played a crucial role in refining the platform. This case shows how structured feedback collection can lead to meaningful improvements.
To make feedback a regular part of your process, establish multiple channels such as:
Monthly user surveys
Real-time reporting tools like Slack
Quarterly roundtables where advanced users share their experiences
Use this feedback to update training materials, keeping them relevant and effective. This not only reduces the load on support teams but also boosts user confidence.
"Self-service analytics only works when it's supported by a culture of continuous feedback and improvement." - Pat Ross, Sales Engineer at Analytics8 [2]
Organizations that embrace feedback loops in their analytics processes often see a 30% boost in user satisfaction and engagement [2]. AI-driven self-serve analytics tools also open new doors for feedback collection. For instance, natural language query features can reveal user goals and highlight areas where the platform might fall short [8].
Expand Infrastructure and Support
As more people adopt your analytics tools, your infrastructure needs to grow with them. This means focusing on data architecture, governance strategies, and support systems. A single source of truth for your data is critical - conflicting data sources can erode trust and derail progress.
In October 2023, Datadog scaled its analytics tools to support 5,000 employees. By creating a unified data source and user-friendly tools, they slashed ad hoc data requests from 50–75 per week to just 5–10. This freed up the data team to tackle more strategic projects [11].
Virgin Atlantic offers another example. By integrating their data into a single platform, they cut the time it took for commercial teams to access insights from weeks to just hours. This change improved decision-making and operational efficiency across the board [12].
To keep things running smoothly, map out your data architecture. Clearly separate centrally managed content from self-service content to avoid bottlenecks and optimize governance [10]. Embedding analytics into tools employees already use, like Microsoft Teams, can also make insights more accessible. This reduces the strain on data teams and encourages regular use [12].
Track Long-Term Results
Measuring the impact of your self-service analytics program is essential for long-term success. Keep an eye on both quantitative and qualitative metrics. Track how different teams and departments are using the tools, monitor business outcomes tied to analytics, and calculate cost savings from reduced manual reporting and improved efficiency.
Consider Verizon’s success in March 2024. By adopting a new self-service model, they increased their call deflection rate to 85%, saving over $1 million annually in their contact center [14]. While this example is from customer service, it highlights the financial benefits of a well-executed self-service initiative.
High satisfaction with self-service tools often leads to better user retention, showing a strong link between effectiveness and continued adoption [15].
"Continuous monitoring and analysis of self-service performance metrics can provide valuable insights into customer behavior, identify areas for improvement, and guide optimization efforts." - Profit.co [13]
Data shows that 67% of users prefer self-service options over contacting support agents, emphasizing the need to maintain effective self-service resources [14]. Regularly measuring performance ensures your program stays aligned with user needs while delivering real business value.
Benchmarking against industry standards can also provide a useful perspective. It helps you see how your program stacks up against others and identify areas for growth.
The secret to long-term success? Treat self-service analytics as a living, evolving initiative. By collecting feedback, scaling infrastructure strategically, and consistently tracking results, you’ll build a solid foundation for sustained impact. These efforts will not only strengthen your analytics program but also embed a data-driven mindset across your organization.
Conclusion
Bringing self-service analytics into your organization isn’t just about deploying new software; it’s about careful planning, building the right technology framework, and fostering a data-driven workplace culture. The journey starts by evaluating your current data environment and setting clear goals that align with your business priorities. From there, choosing a platform that combines ease of use with strong governance features is essential for sustainable success.
The benefits are hard to ignore. Nearly half of finance executives see self-service data and analytics as a way to boost employee productivity [16]. Additionally, organizations using these tools report decision-making processes that are 30% faster and a reduction in IT support tickets by 40–60% [1].
"Self-service analytics empowers business users to generate reports, visualizations, and analyses easier and faster, helping them respond more effectively to changing conditions."
– Mike Chen, Content Strategist, Oracle [2]
This kind of value highlights the importance of good governance and a strong data-driven culture. Establishing clear data access policies, security measures, and quality standards creates a safe environment for exploration and innovation. When paired with focused training and a culture encouraging curiosity, employees can confidently use data to inform decisions without compromising its integrity.
Emerging AI-powered tools like Querio are also making analytics more accessible. Features like natural language querying and automated visualizations simplify data analysis, freeing teams to focus on extracting meaningful insights.
"Empowering your teams to analyze data, uncover insights, and make data-driven decisions is the key to unlocking your company's full potential."
– Emilia Korczynska, Head of Marketing, Userpilot [5]
These insights emphasize the importance of treating self-service analytics as a dynamic, ongoing initiative. Long-term success relies on regular user feedback, infrastructure scaling, and adapting to evolving needs. By staying responsive and continually improving, organizations lay the groundwork for smarter decisions and the agility to tackle future challenges.
The roadmap is clear: evaluate your data landscape, select the right tools, invest in your team, and commit to constant growth. With these steps, self-service analytics transforms from a technical upgrade into a powerful advantage, enabling every team member to drive success through data.
FAQs
How can an organization evaluate if it’s ready to implement self-service analytics?
To gauge whether your organization is ready for self-service analytics, start by examining three critical areas: technical infrastructure, data quality, and team capabilities. First, ensure your systems can support the increased demand for data access. Next, confirm that your data is accurate, well-structured, and reliable. Finally, evaluate whether your teams have the skills - or access to training - they need to effectively use analytics tools.
Another key consideration is your organization's mindset. For self-service analytics to succeed, it’s essential to cultivate a culture that embraces data-driven decision-making. Employees should feel confident and empowered to explore data while using it responsibly. Tackling these elements early on will pave the way for a smoother rollout and greater adoption across your teams.
What should I look for in a self-service analytics platform?
When picking a self-service analytics platform, prioritize features that make accessing and analyzing data straightforward, secure, and efficient. Seek out platforms with user-friendly interfaces that let anyone, regardless of skill level, explore data effortlessly. Tools for data preparation - like cleaning and organizing - are essential, along with customizable visualizations to craft clear and impactful reports.
Also, consider features like secure sharing options for team collaboration, governance controls to safeguard sensitive information, and mobile access for insights anytime, anywhere. Platforms that include built-in help and support resources can make the adoption process smoother for your entire team.
How can organizations balance data security with easy access to self-service analytics tools?
To ensure data remains both secure and accessible, organizations need a strong governance framework that protects sensitive information while keeping it practical for use. A good starting point is to clearly define data ownership and assign responsibilities, which helps maintain accountability across the board.
Next, consider implementing a centralized data catalog. This tool standardizes definitions and makes information easy to locate and interpret, minimizing confusion and reducing the risk of misuse.
Role-based access controls are another key element. By restricting access to only the data each user needs, you can limit exposure and maintain tighter security. It's also essential to regularly review and update security protocols to stay ahead of potential threats. Finally, ongoing training for your team is a must - educating them on best practices ensures they know how to handle data securely and responsibly.
Related Blog Posts


