Business Intelligence
Best no code BI platform for non-technical business users 2025
Explore the top no-code BI platforms for 2025 that empower non-technical users to easily analyze data and make informed business decisions.

Looking for the best no-code BI platform in 2025? Here’s what you need to know:
No-code BI platforms are transforming how businesses analyze data, making it accessible for non-technical teams. These tools simplify data visualization, reporting, and decision-making without requiring coding skills.
Top Picks for 2025:
- Querio: AI-driven with natural-language querying, live data connections (e.g., Snowflake, BigQuery), and drag-and-drop dashboards. Free plan; Core is $2,499/month.
- Platform X: Advanced analytics with pre-built dashboards and seamless integration via Panoply. Features Microsoft Power BI tools.
- Platform Y: Supports 500+ data sources, handles structured and unstructured data, and offers flexible pricing for scalability.
Quick Comparison:
| Platform | Natural-Language Querying | Data Integration | Dashboard Creation | Pricing Model |
|---|---|---|---|---|
| Querio | AI-powered, no SQL needed | Direct to Snowflake, etc. | Simple, unlimited viewers | Free plan; Core $2,499/mo |
| Platform X | Advanced tools | Panoply framework | Pre-built dashboards | Tiered by features |
| Platform Y | Easy-to-use | 500+ data sources | Flexible dashboard options | Hybrid usage-based |
Summary: Querio excels in simplicity and AI-powered insights, Platform X offers advanced tools for deeper analysis, and Platform Y provides scalability and integration flexibility. Choose based on your team’s needs and budget.
Microsoft Power Platform (No Code / Low Code Platform) - Concepts explained
::: @iframe https://www.youtube.com/embed/8bRFU_nW42o :::
1. Querio
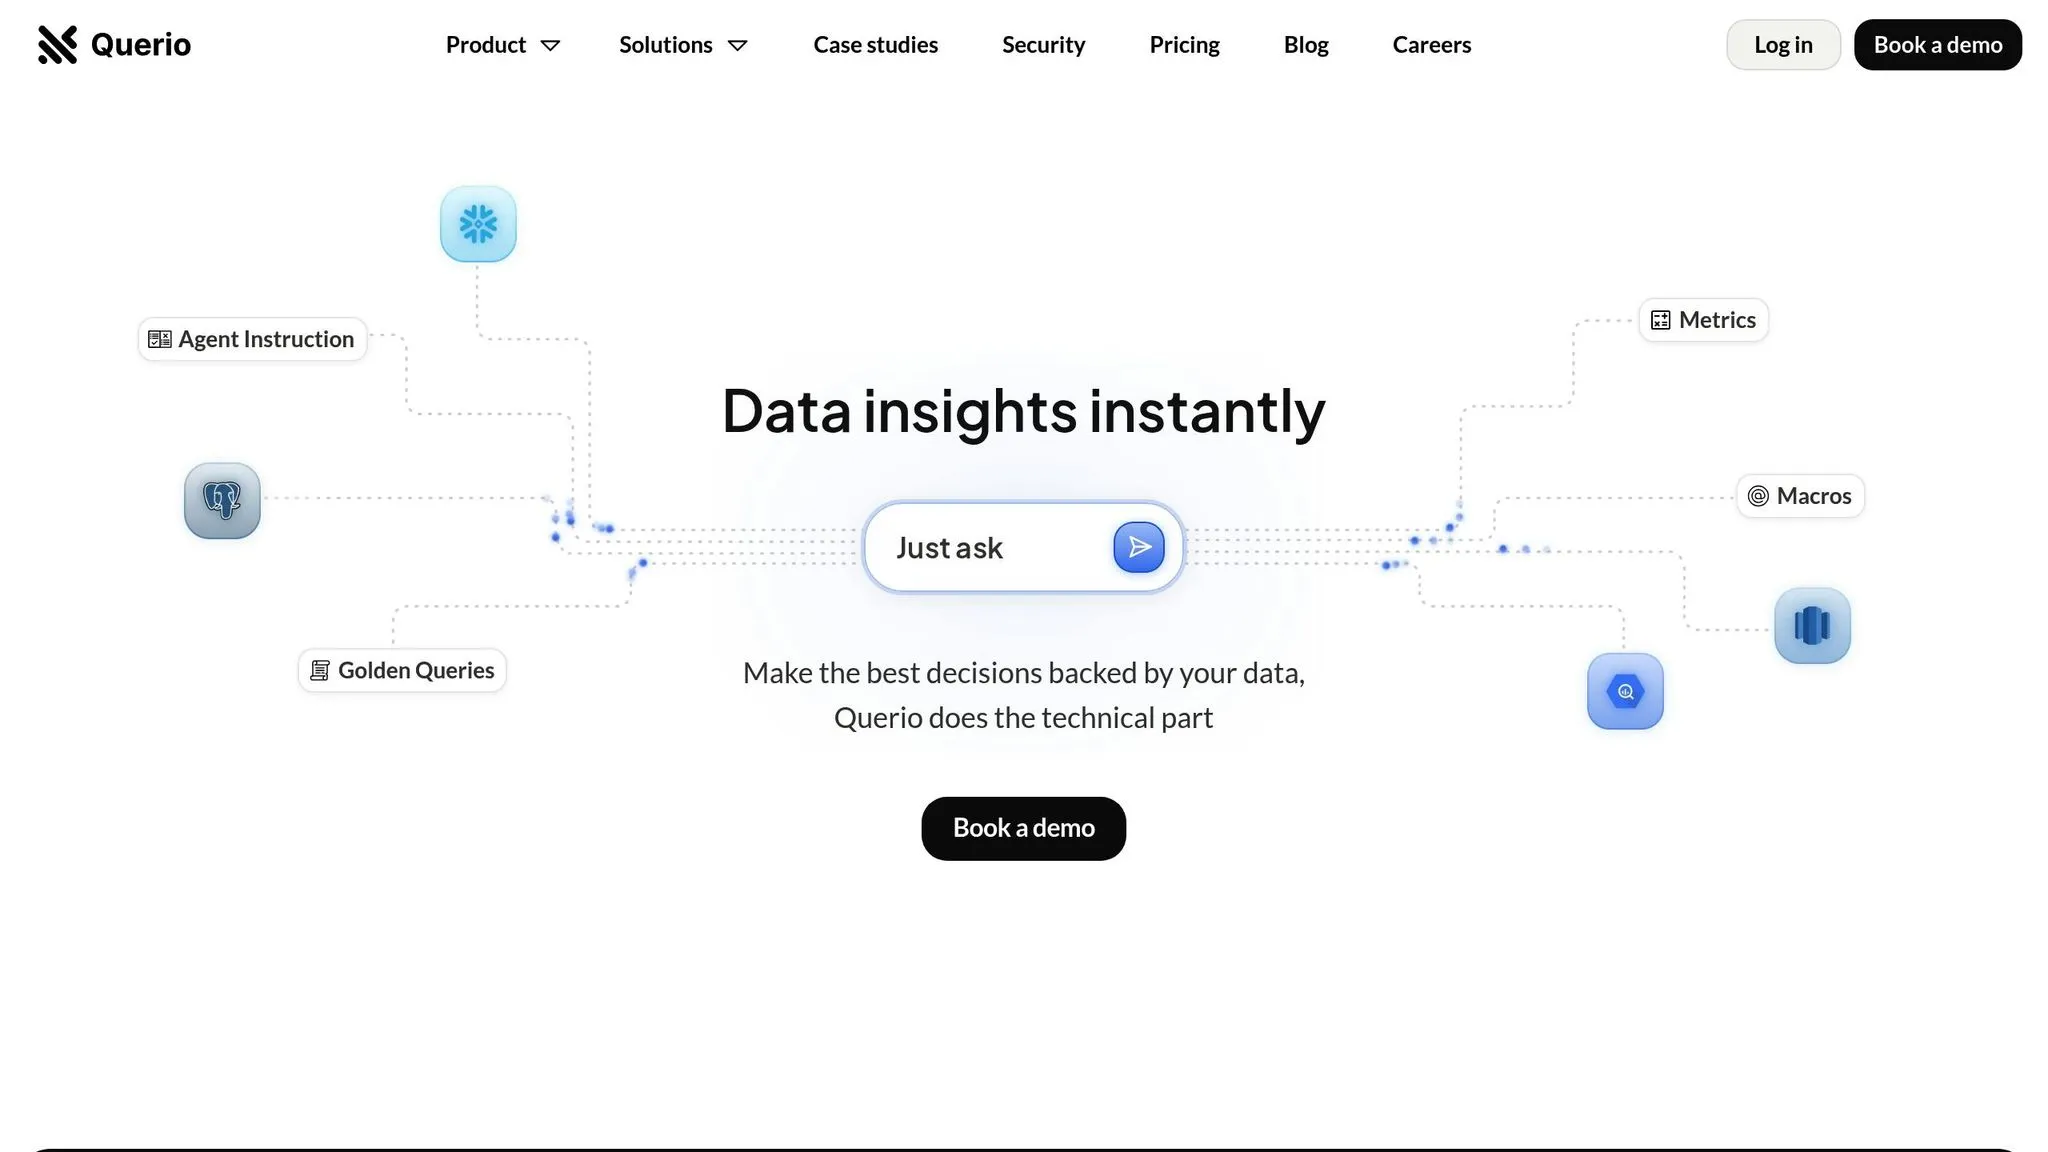
Querio is an AI-powered business intelligence workspace designed to make data analysis accessible for everyone, even those without technical expertise. It simplifies the process of working with data, allowing users to ask questions in plain English and get clear, accurate visualizations in seconds.
Natural-language querying
Querio's standout feature is its natural-language agent, which eliminates the need for SQL. Users can type straightforward questions like, "What were our top-performing products last quarter?" or "Show me customer acquisition costs by region," and instantly receive visual charts and graphs. Every plan includes monthly AI credits (500 on Free, 10,000 on Core), encouraging users to explore and interact with data freely - helping them build confidence in their analytical skills.
Integration with data warehouses
Querio seamlessly integrates with major enterprise data warehouses like Snowflake, BigQuery, and Postgres. Instead of requiring data copies, it establishes live connections, ensuring users always access the most up-to-date information. To address security concerns, Querio uses read-only, encrypted credentials for all connections, providing real-time data access while maintaining strict data protection.
Dashboard creation and reporting
With its intuitive drag-and-drop dashboard creation tool, Querio makes it easy to track KPIs and share insights. Scheduled reporting keeps stakeholders updated without manual effort, and dashboards are included on every plan.
The platform's context layer is another key feature, allowing data teams to define table joins, business metrics, and glossary terms once, then manage these settings across all user interactions. This ensures consistent, reliable results, even for users without technical expertise, helping businesses make better decisions faster.
Pricing and scalability
Querio has a free plan with unlimited users, unlimited data connections and 500 AI credits a month. Core is $2,499 a month (or $25,000 a year billed annually) and adds 10,000 AI credits a month, SSO, API access and unlimited automations. On-prem deployment is an Enterprise add-on.
The platform also delivers peace of mind with SOC 2 Type II compliance, a 99.9% uptime SLA, and the option to pay for Core monthly or annually. These features make Querio a dependable and flexible choice for U.S. businesses looking to streamline their data analysis processes.
2. Platform X
Platform X provides a no-code analytics solution that combines natural-language processing with seamless integration to data warehouses. Its library of pre-built dashboards and templates makes data analysis accessible for business professionals who need quick, actionable insights without dealing with technical hurdles.
Natural-Language Querying
Platform X’s natural-language querying feature makes data interaction straightforward, even for those without technical expertise. Users can ask everyday questions like, "What was our market share in Europe last quarter?" and instantly receive insights - no need to learn complex query languages [2].
This feature works by interpreting user queries, pulling relevant data from multiple sources, and presenting the results in an easy-to-digest format [2]. This approach is particularly useful in sectors like finance, where analysts can quickly explore market trends, assess risks, or identify investment opportunities using natural language [3].
The global market for natural language processing is on a steep growth trajectory, projected to expand from $18.9 billion in 2023 to $68.1 billion by 2028, with an annual growth rate of 29.3% [2].
Integration with Data Warehouses
Platform X leverages Panoply's framework to offer seamless data warehouse integration through no-code connectors that require zero upkeep [4]. This allows businesses to unify data from multiple sources into a single, centralized hub, creating a reliable foundation for business intelligence.
The results are impressive. Organizations report 30x faster report generation, and users experience a 90% reduction in dashboard run times, enabling quicker decision-making compared to traditional BI tools [4].
The platform’s managed ELT connectors also eliminate much of the technical complexity tied to data integration. Engineering and IT teams save around 2 months of work per connector, while executives benefit from annual cost savings of $120,000. Additionally, businesses see a 20% increase in reporting and data usage, highlighting how accessible and engaging the tools are for teams [4].
Dashboard Creation and Reporting
With its seamless data connections, Platform X simplifies visual analysis through user-friendly dashboards. By integrating Microsoft Power BI's capabilities, it offers a rich selection of pre-built dashboards and reports tailored to common business needs. This helps users hit the ground running without starting from scratch [5].
Power BI’s AI-driven analytics make exploring data intuitive and reduce the typical learning curve associated with business intelligence tools. Its integration with the Microsoft ecosystem ensures smooth workflows for organizations already using Microsoft products, enhancing productivity and collaboration [5].
Power BI has consistently earned recognition as a leader in Gartner's BI Magic Quadrant [7]. This acknowledgment highlights its scalability and affordability, making it a go-to choice for enterprises seeking comprehensive analytics without unnecessary complexity [6].
sbb-itb-284a532
3. Platform Y
Platform Y brings data analysis to the forefront by offering centralized tools with flexible integration and pricing options that cater to organizations of all sizes. Let’s delve into how it connects and unifies a wide range of data sources.
Integration with Data Warehouses
Platform Y simplifies the process of connecting various data sources, making it an excellent choice for organizations dealing with complex data systems. It links disparate sources, processes the data as needed, and ensures everything is accessible and ready for analysis. This approach enhances the functionality of both data lakes and data warehouses [8].
Why does this matter? A surprising 62% of organizations still rely on spreadsheets to manually combine and visualize data [10]. Platform Y handles both structured data (typically stored in data warehouses) and unstructured data (commonly found in data lakes) with ease [8]. Its integration process - covering tasks like data ingestion, cleaning, transformation, and unification - creates a single, reliable source of truth [9]. This means businesses can maximize their existing data infrastructure while expanding their analytics capabilities, even without a dedicated technical team. Non-technical users can access and interpret data directly, eliminating the need for constant IT support. This shift is a core part of how non-technical teams use AI analytics successfully to drive growth.
Dashboard Creation and Reporting
One of Platform Y’s standout features is its ability to turn raw data into actionable insights through user-friendly dashboards. These dashboards are designed with non-technical users in mind, offering an intuitive interface that doesn’t require coding skills or advanced training. Whether you’re diving into exploratory analytics or using AI data analytics tools for non-technical users, the platform makes it easy to create dashboards that handle diverse data types and complex queries [8].
The platform’s reporting tools are built to adapt, offering flexibility for businesses of all kinds. Combined with a pricing model tailored to grow alongside your organization, this makes it an ideal choice for teams looking to simplify how they interact with data.
Pricing and Scalability
Platform Y addresses a key concern for growing businesses: cost flexibility. Its hybrid subscription model combines tiered, usage-based, and freemium pricing, reflecting a trend toward adaptable pricing structures in 2025 [11]. This means companies can choose the level of access and features that suit their needs, paying only for what they use.
Scalability is another major strength. Platform Y supports both vertical and horizontal scaling [12], ensuring that organizations can grow without a corresponding spike in costs or resources. With 61% of CEOs reporting plans to adopt AI agents and scale them across their organizations, Platform Y’s architecture is ready to meet the growing demand for AI-powered analytics [13]. Its scalable design allows businesses to make fast, data-driven decisions as their needs evolve.
Platform Comparison: Strengths and Weaknesses
Here's a breakdown of the core strengths and trade-offs of three platforms, highlighting how they cater to different organizational needs.
Querio takes a bold step with its AI-native design for natural language querying, completely eliminating the need for SQL knowledge. It connects directly to major data warehouses like Snowflake, BigQuery, and Postgres, offering real-time access without duplicating data. Another plus is its context layer, which allows data teams to set governance rules just once for ongoing use. However, SSO, API access and the larger 10,000-credit allowance come with Core at $2,499 a month. Smaller teams can start on the free plan.
Platform X shines with its strong analytics capabilities and extensive integration options. Its reporting tools are versatile enough to meet a variety of essential BI features. That said, its complexity could be a drawback for users who prefer simpler, more user-friendly analytics solutions.
Platform Y is a standout for scalability and cost flexibility, thanks to its hybrid subscription model. Supporting over 500 data sources and offering smooth integration, it’s a solid choice for addressing data silos. Its ability to handle both structured and unstructured data adds to its versatility, especially for growing businesses. However, its wide range of features might overwhelm smaller teams, and its usage-based pricing could make budgeting tricky.
| Platform | Natural-Language Querying | Data Integration | Dashboard Creation | Pricing |
|---|---|---|---|---|
| Querio | AI-native, no SQL needed | Direct to Snowflake, BigQuery, Postgres | Simple with unlimited viewers | Free plan; Core $2,499/mo (10,000 AI credits/month) |
| Platform X | Advanced query tools | Multiple source compatibility | Comprehensive reporting features | Tiered based on features |
| Platform Y | Intuitive design | 500+ data sources supported | Flexible dashboard options | Hybrid subscription model |
Key Comparisons
Natural Language Querying: Querio leads with its AI-driven simplicity, requiring no technical expertise. Platform X offers more advanced options, but they come with a steeper learning curve. Platform Y focuses on user-friendly design, though it may lack the sophistication of Querio’s AI-powered querying.
Data Integration: Platform Y takes the lead here, boasting compatibility with over 500 systems [1]. Querio provides strong coverage for major data warehouses with secure, read-only connections. Platform X, while capable, may demand more technical effort during setup.
Dashboard Creation: Querio prioritizes simplicity, offering unlimited viewer access. Platform X’s tools are built for handling complex reporting needs, while Platform Y offers flexibility, though it may require extra configuration.
Pricing Models: Querio’s plan pricing, with included AI credits and spending caps, works well for organizations with predictable needs. Platform X usually offers tiered options based on features and users, making it adaptable to different scales. Platform Y’s hybrid model is flexible but may complicate cost planning due to usage-based variations.
The right choice depends on your team’s technical skills, the complexity of your data, and your budget. Each platform offers distinct advantages, so weigh them carefully against your specific needs.
Final Recommendations
When selecting a no-code BI platform, it's essential to find one that aligns with your organization's unique needs. Based on our research, Querio stands out for those prioritizing simplicity and AI-powered insights.
Querio allows users to query data effortlessly using natural language BI, eliminating the need for complex SQL. With live connections to major data warehouses like Snowflake, BigQuery, and Postgres, it ensures you're always working with up-to-date information. Plus, its free plan makes it an attractive option for businesses seeking value without compromising on functionality.
These features reflect a larger industry shift toward more accessible and efficient analytics. Today, no-code tools are responsible for 70% of new enterprise applications, slashing development times by up to 90% [14]. Querio plays a key role in this evolving landscape, making advanced analytics more approachable.
"Low-code and no-code tools are a way to mitigate talent shortages because they allow companies to build software systems without the need for large teams of developers." - Amitha Pulijala, Vice President of Product, Cloud Platform Services, CX, API, and AI at Vonage [14]
FAQs
::: faq
What features make Querio ideal for business users without technical skills?
Querio makes data analysis accessible to everyone, even those without technical skills. Using AI-powered tools, it allows users to ask questions in plain English through Natural Language Processing (NLP) and receive instant, meaningful insights - no coding needed.
With its user-friendly interface and automated features, Querio simplifies creating visualizations, generating reports, and identifying trends. This helps businesses make quicker, informed decisions based on data. :::
::: faq
How does Querio provide secure, real-time access to data from major warehouses?
Querio provides secure, real-time access to your data by connecting directly with your existing systems. This seamless integration ensures your information is always current, removing the hassle of manual updates.
To safeguard your data, Querio uses top-tier security protocols, such as encryption and rigorous access controls. These measures help keep your information safe and aligned with industry regulations. With Querio, you can explore and analyze your data with peace of mind, knowing security is a priority. :::
::: faq
What should businesses consider when evaluating pricing models for no-code BI platforms?
When considering pricing models for no-code BI platforms, it's essential to weigh a few key factors. Start by examining the pricing structure - whether the platform operates on a subscription basis, pay-as-you-go, or offers a freemium model. Next, evaluate the total cost by factoring in the number of users and expected usage levels. Also, think about the platform's scalability - can it grow alongside your organization?
Another critical point is understanding what features are included at each pricing tier. Check if costs will rise with additional users or increased data processing needs. By diving into these details, you can select a platform that fits your budget, supports your long-term plans, and empowers your data-driven decision-making. :::