Business Intelligence
Best AI Data Analysis Platforms Today
Compare five leading AI analytics platforms—ease of use, governance, integrations, and code transparency—to pick the right tool for your data team.
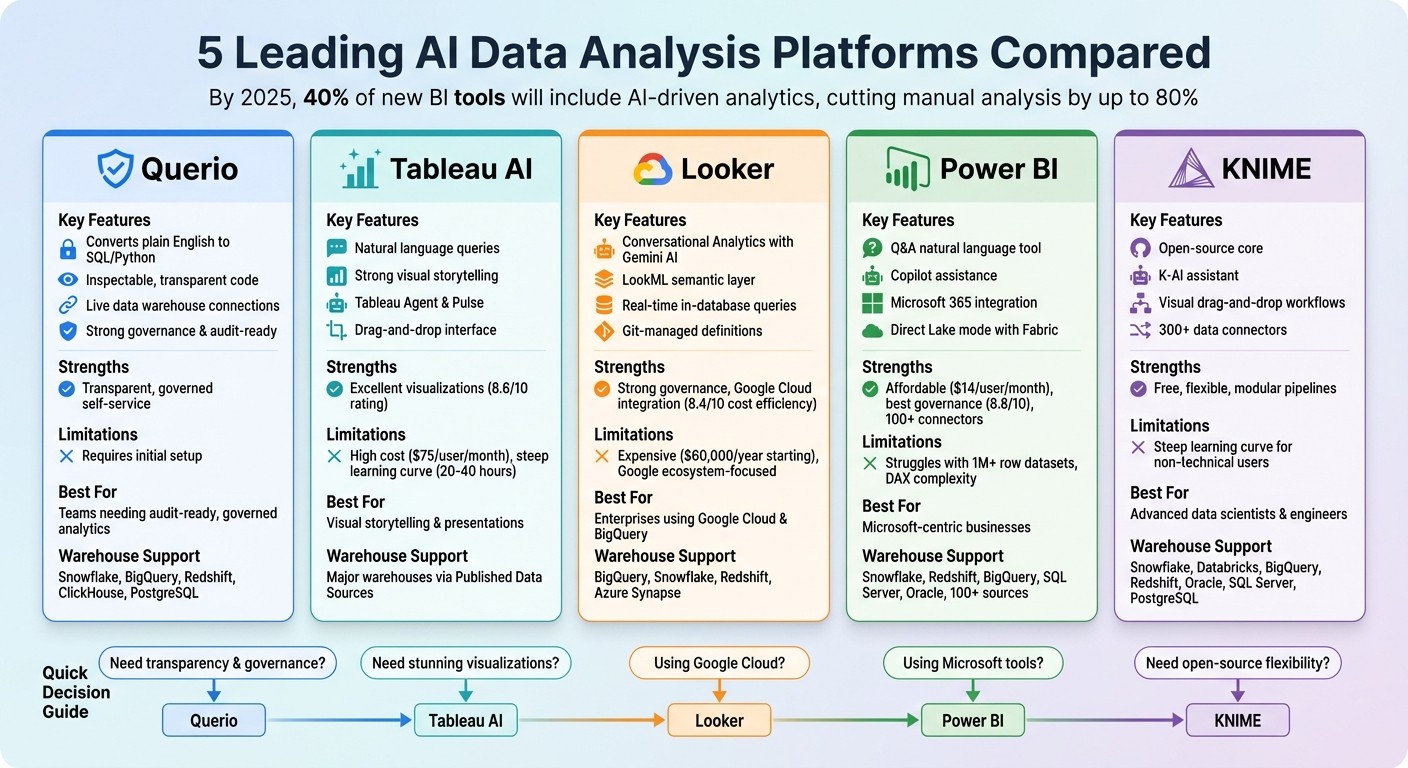
AI-powered platforms simplify data analysis by turning raw data into actionable insights through natural language queries and automation. By 2025, 40% of new business intelligence tools are expected to include AI-driven analytics, helping teams cut manual analysis tasks by up to 80%. This article compares top business intelligence tools - Querio, Tableau AI, Looker, Power BI, and KNIME - based on key factors like ease of use, security, and integration.
Quick Overview:
Querio: Converts plain English into SQL/Python code with inspectable transparency and strong governance. Ideal for teams needing audit-ready insights.
Tableau AI: Focuses on visual storytelling and natural language queries but has a steep learning curve and high costs.
Looker: Strong governance via LookML and great for Google Cloud users, but expensive and best suited for Google ecosystems.
Power BI: Affordable and integrates well with Microsoft tools but struggles with large datasets and requires DAX expertise.
KNIME: Open-source, flexible workflows for advanced users, but its interface can be challenging for non-technical teams.
Quick Comparison Table:
Platform | Strengths | Limitations | Best For |
|---|---|---|---|
Querio | Transparent, inspectable code; live data connections | Requires setup for optimal use | Teams needing governed, audit-ready analytics |
Tableau AI | Strong visualizations; natural language insights | High cost, steep learning curve | Data visualization and presentations |
Looker | Real-time insights; strong governance | Expensive, Google Cloud-focused | Enterprises using Google Cloud |
Power BI | Affordable; integrates with Microsoft tools | Struggles with large datasets | Microsoft-centric businesses |
KNIME | Open-source; flexible workflows | Steep learning curve for beginners | Advanced data scientists and engineers |
Each platform has unique strengths. Querio stands out for its transparency and governance, while others like Tableau AI and Power BI shine in specific use cases like visualization or affordability. Choose based on your team's technical needs and goals.
AI Data Analysis Platforms Comparison: Features, Strengths and Best Use Cases
I Tested 53 AI Tools for Data Analysis - THESE 5 ARE THE BEST!
1. Querio
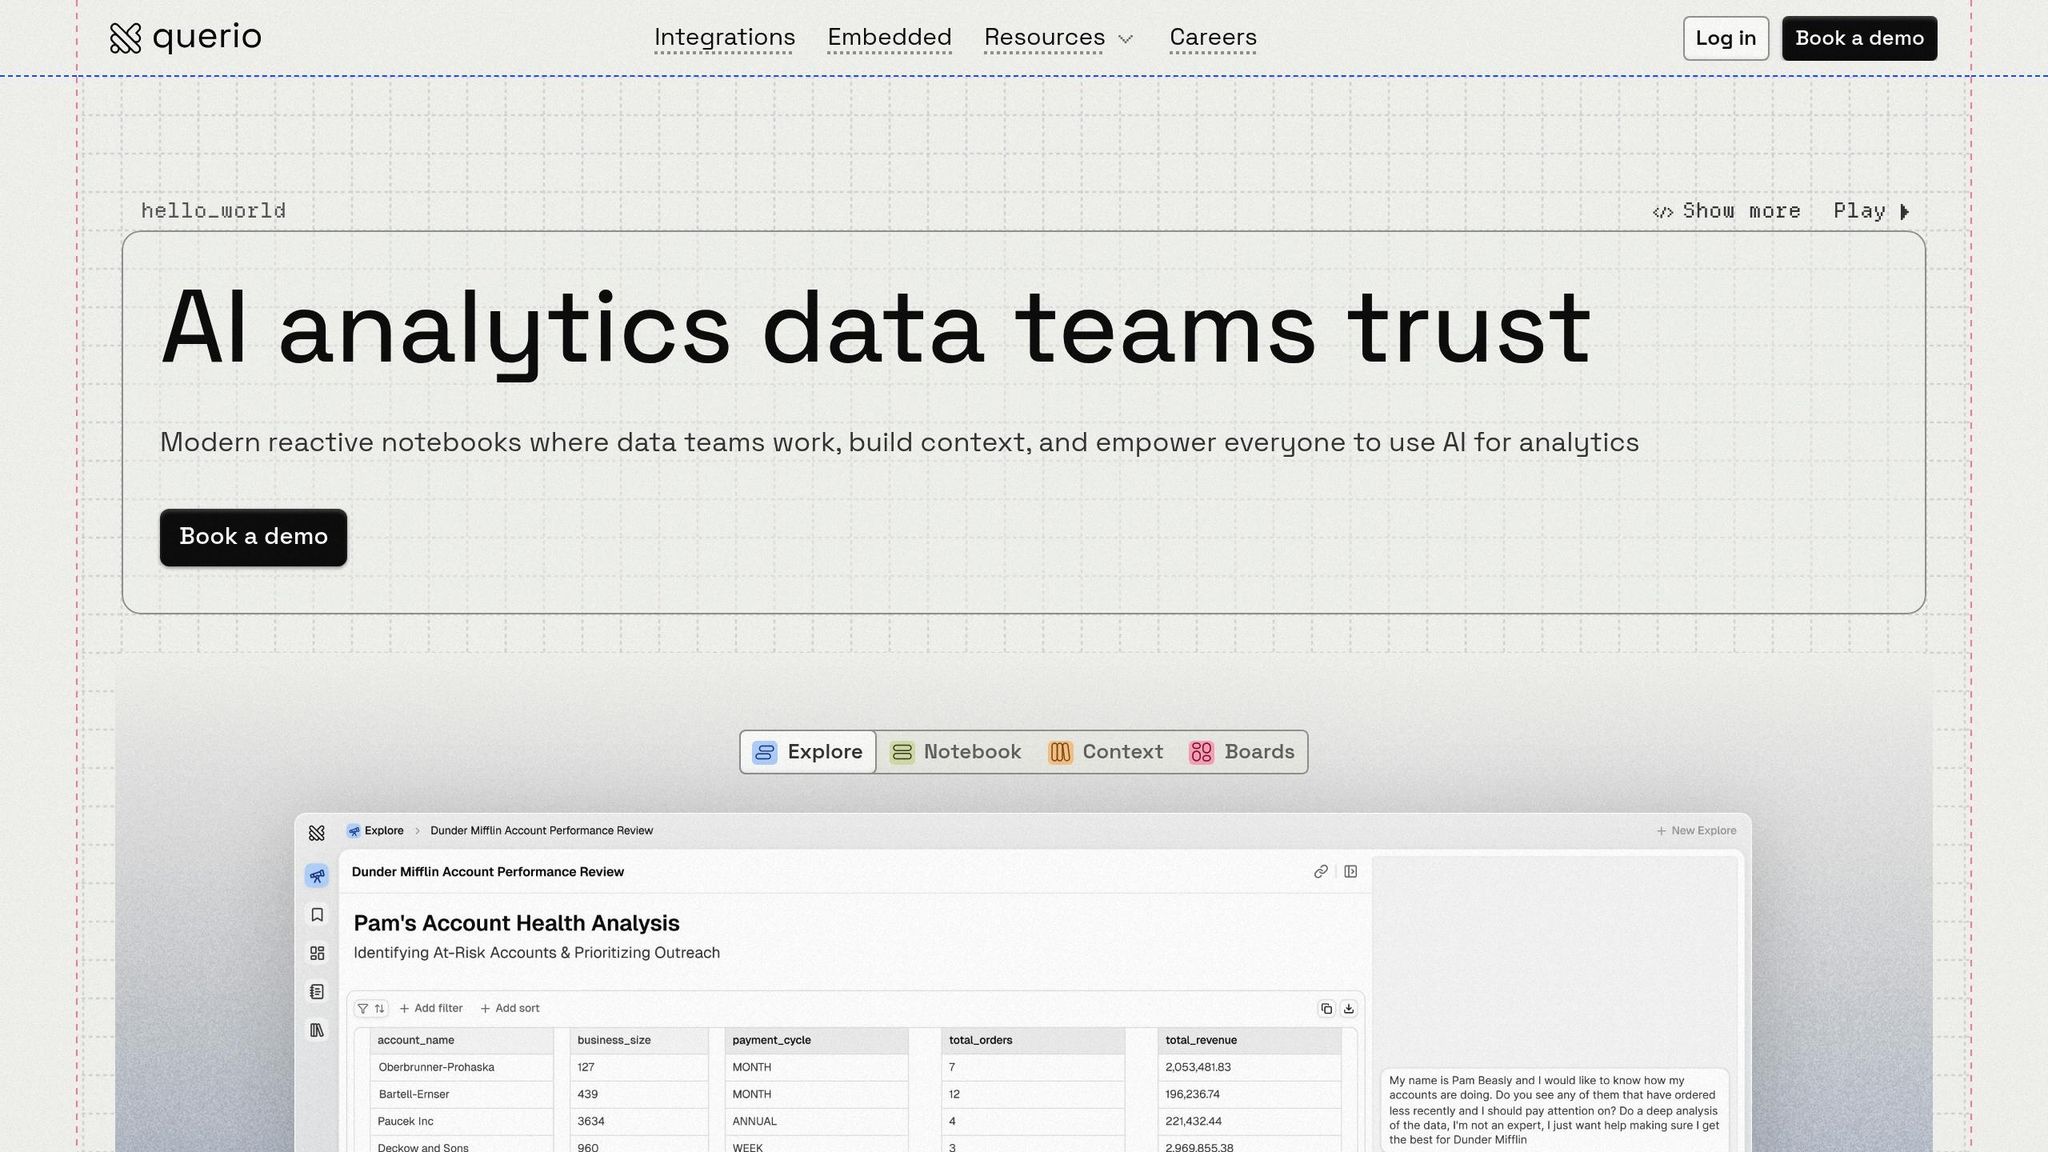
Querio is an AI-powered analytics workspace that connects directly to your data warehouse, turning plain English questions into precise SQL and Python code. Instead of relying on data teams to create dashboards or craft queries, users can simply ask questions in everyday language and get answers backed by verifiable code. Here’s how Querio makes raw data more accessible and actionable.
Natural Language Support
With AI Python agents, Querio enables deep analysis through conversational queries. For instance, you could ask, "What’s our customer retention rate by region over the last six months?" Querio will instantly generate the required SQL or Python code and even create visual charts to match your query.
Warehouse Compatibility
Querio integrates seamlessly with major data warehouses like Snowflake, BigQuery, Amazon Redshift, ClickHouse, and PostgreSQL. These connections are live, encrypted, and read-only, ensuring that your data stays secure within the warehouse. This setup allows teams to work with data from multiple systems without the need for extraction or duplication.
Governance Features
Every AI-generated result is backed by your organization’s established business logic, ensuring accuracy. Querio’s shared context layer lets data teams define joins, metrics, and business terms once, creating a consistent framework for analyses, dashboards, and AI-generated answers. This ensures that metrics remain uniform and contextually accurate across the board.
Code Inspectability
Querio provides full transparency by showing the exact SQL and Python code behind every answer. Data teams can review, edit, and even version-control this code, maintaining accuracy while enabling AI self-serve analytics. Its reactive notebook environment automatically updates all dependent results whenever shared logic is modified, keeping everything aligned and up-to-date.
2. Tableau AI
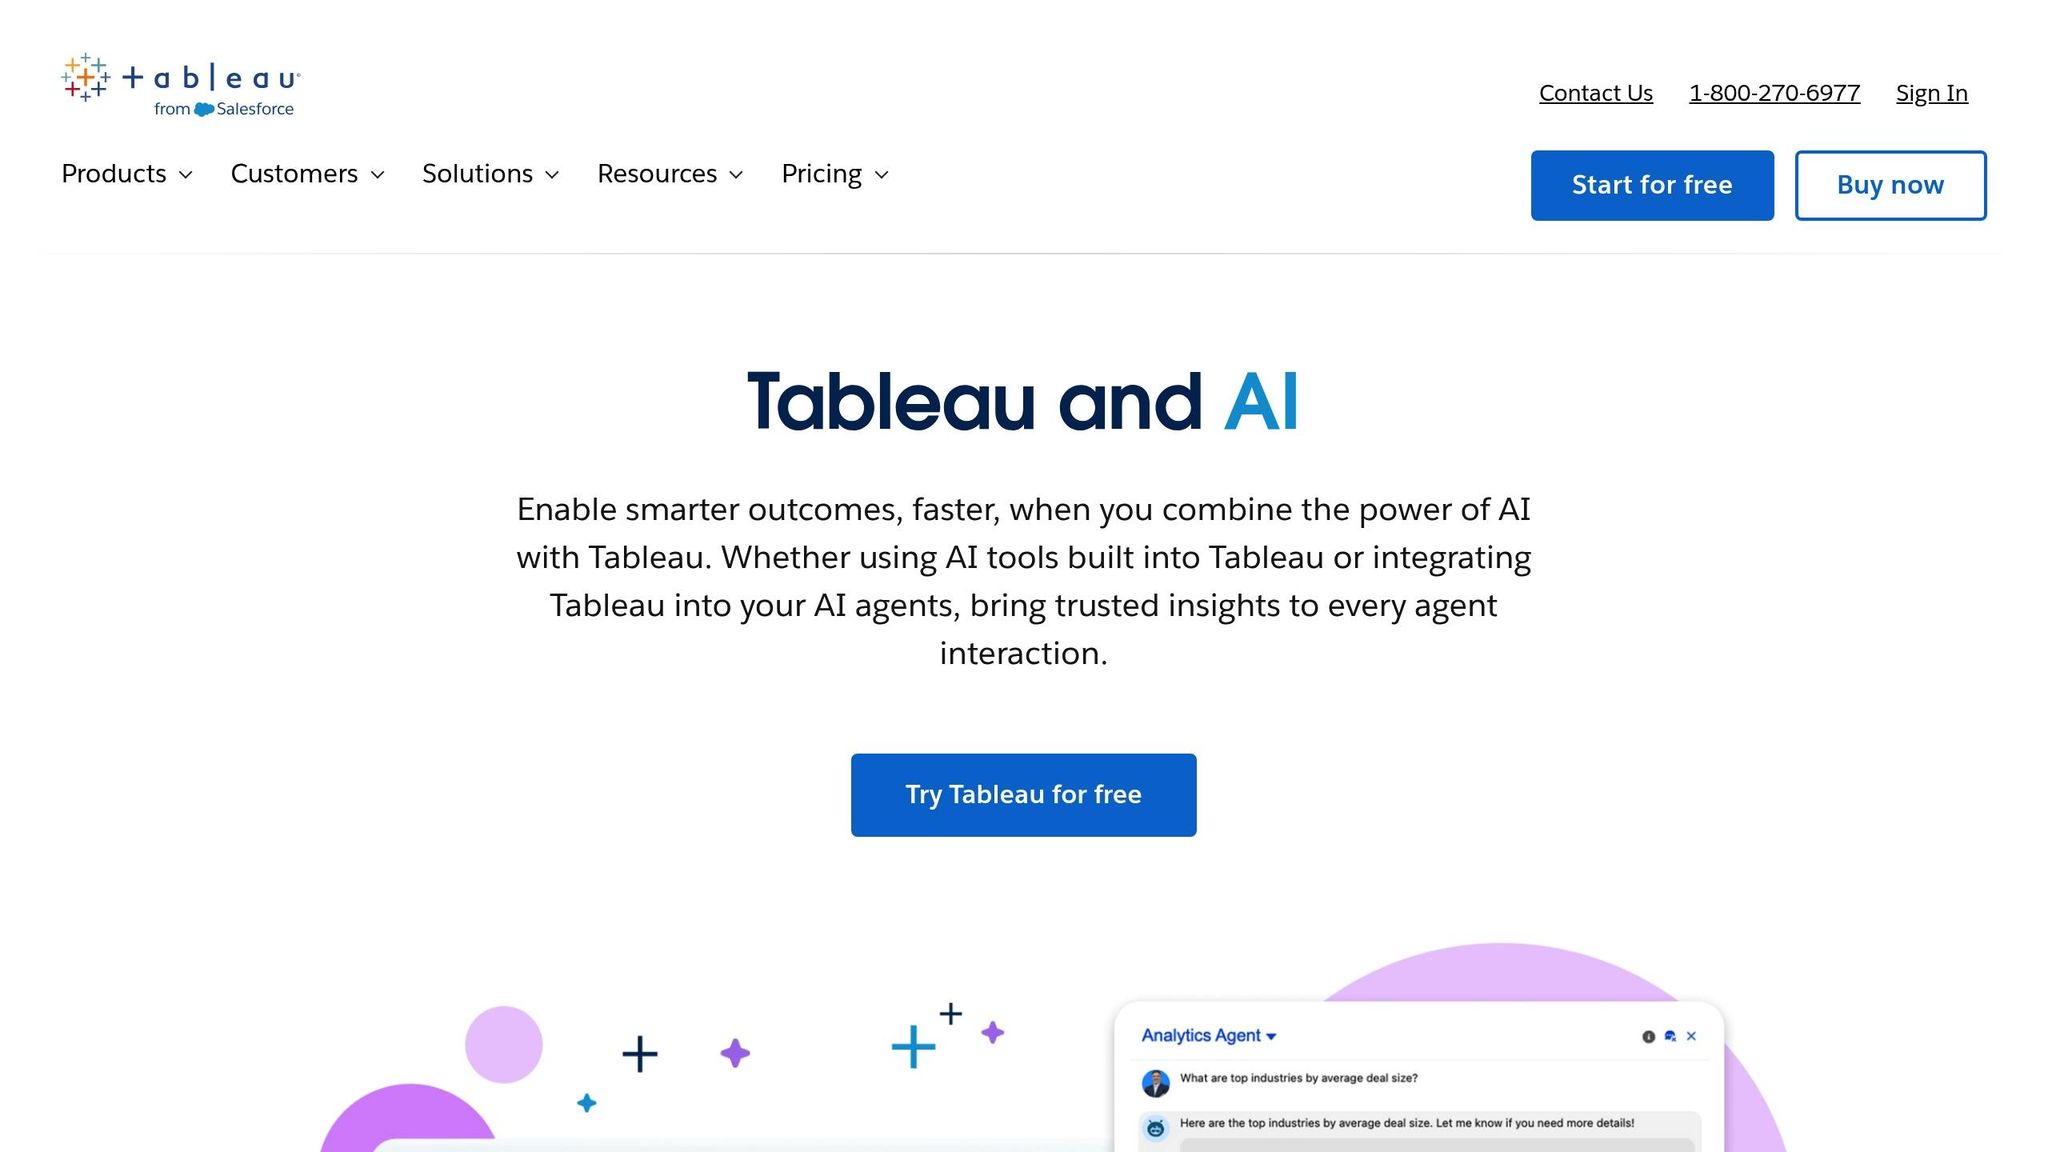
Tableau AI makes data analysis easier by letting users interact with data using natural language, eliminating the need for coding. With tools like the Tableau Agent, users can ask questions in plain English, and Tableau transforms these queries into visual analytics, prepares data, and even generates calculations. This approach makes data exploration straightforward for everyone. Let’s dive into how AI is transforming data analytics and simplifying the process.
Natural Language Support
Tableau Agent and Tableau Pulse allow users to interact with their data using everyday language. Whether it’s generating calculations, preparing datasets, or tracking personalized metrics, these tools handle it all - no coding knowledge required.
Warehouse Compatibility
Tableau AI works seamlessly with major data warehouses, connecting through Published Data Sources on Tableau Cloud or Server. Features like the Model Context Protocol and VizQL Data Service enable the integration of custom AI agents while maintaining consistency with governed metrics for reliable analysis.
Governance Features
Data security and compliance are priorities with Tableau AI. The Einstein Trust Layer safeguards sensitive data and AI operations through a secure analytics platform. Certified Data Sources, row-level security, audit logs, and Active Directory integration further ensure that data access is controlled and compliant. These features not only protect data but also enable faster, more informed decision-making for businesses.
3. Looker
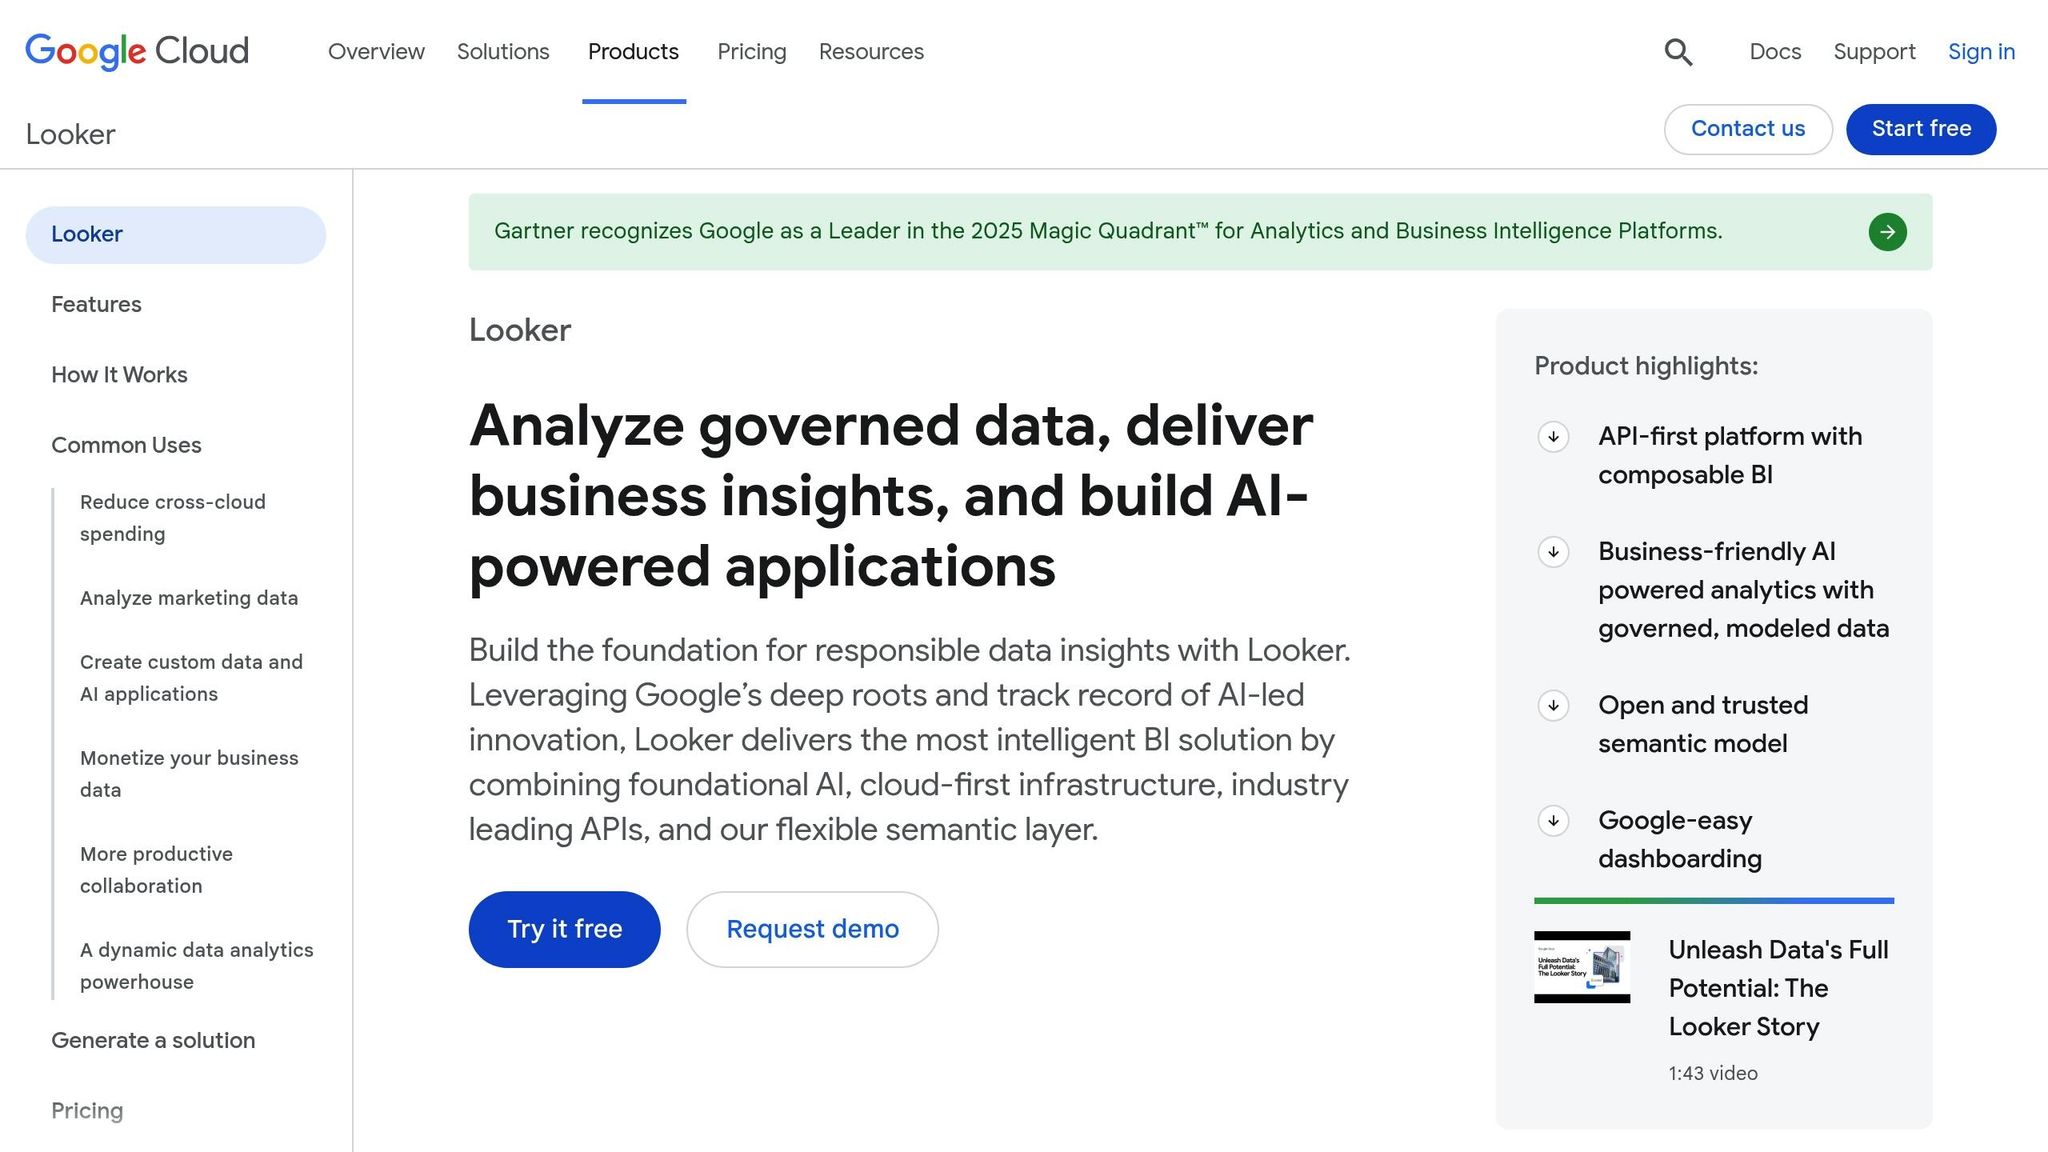
Looker takes advantage of Google's advanced technology to make data insights more accessible through natural language interfaces. With the integration of Google's Gemini AI, Looker introduces Conversational Analytics, allowing users to interact with their data through simple chats that instantly produce charts and insights.
Natural Language Support
Looker offers tools like the Visualization Assistant, Formula Assistant, and Code Interpreter, which transform user requests into custom charts, calculations, forecasts, and anomaly detection - all without needing coding skills. Thanks to its LookML semantic layer, AI-generated responses stick to pre-defined, governed metrics, ensuring consistency and accuracy.
Warehouse Compatibility
Looker seamlessly connects with leading cloud data warehouses, such as BigQuery, Snowflake, Redshift, and Azure Synapse. It performs in-database queries using native processing power for maximum performance and scalability.
Governance Features
The LookML layer is the backbone of Looker's governance capabilities. It defines metrics in a version-controlled Git repository, while also enforcing strict row- and column-level security. Looker integrates with tools like Google Cloud IAM, SAML, LDAP, and supports two-factor authentication to meet compliance standards, including GDPR and HIPAA.
Code Inspectability
With LookML's Git-managed, SQL-based definitions, every analysis is fully auditable. This transparency allows data teams to inspect and verify the logic behind each insight, ensuring trust in the results. Next, we’ll dive into the strengths and challenges of each platform.
4. Power BI
Power BI combines Microsoft's advanced AI tools to simplify analytics workflows and generate practical insights with features like Q&A and Copilot. The Q&A tool allows users to interact with their data using natural language, supporting tasks like applying complex conditions, setting relative date filters, and even specifying visual types (e.g., typing "as pie chart" to instantly create a pie chart). It provides real-time visual feedback with colored underlines: blue for recognized terms, orange for ambiguous ones, and red for unrecognized terms [4]. Let’s explore its standout features, starting with its natural language capabilities.
Natural Language Support
Copilot in Power BI can summarize reports, answer questions, and even build report pages based on conversational inputs. This functionality has proven invaluable for businesses managing diverse datasets. As Micah Dail, Director of Finance Data & Analytics at Walmart, shared:
"At Walmart, we use a myriad of different vendors in our technology stack, so having a tool like Power BI that can bring everything together was critical." [5]
Warehouse Compatibility
Power BI connects seamlessly to over 100 data sources, including major cloud platforms like Snowflake, Amazon Redshift, and Google BigQuery, as well as on-premises databases like SQL Server and Oracle. Its integration with Microsoft Fabric introduces Direct Lake mode, enabling direct queries on data stored in OneLake without the need for importing or caching, which speeds up the analysis of large datasets. Additionally, the On-premises Data Gateway ensures secure data transfers from local databases [7].
Governance Features
Power BI incorporates robust security measures to protect data. It uses Microsoft Entra ID for authentication and supports both Row-Level Security (RLS) and Object-Level Security (OLS) to control user access to data. Integration with Microsoft Purview enables sensitivity labeling and data cataloging, while encryption at rest is managed through Azure SQL TDE and Azure Storage Encryption. All HTTP traffic is secured with TLS 1.2 or higher, and its security framework is backed by a team of over 3,500 engineers [8].
Code Inspectability
The DAX Query View offers developers the ability to create, execute, and review DAX queries, providing full visibility into the logic behind the data model. This feature helps teams verify calculations and maintain transparency in their workflows [5][6].
5. KNIME
KNIME combines open-source flexibility with visual workflows to simplify AI analytics. Its integrated K-AI assistant allows users to create data pipelines using natural language prompts, making it possible to perform complex analyses without needing to write code [9].
Natural Language Support
The K-AI assistant, embedded directly into KNIME's workflow builder, helps users craft analyses, write Python or R scripts, and create visualizations. KNIME connects seamlessly with major large language model providers like OpenAI, Azure OpenAI, Google AI Studio, Anthropic Claude, IBM Watson, Hugging Face, and DeepSeek. Additionally, its Text Processing extension converts unstructured data - such as customer reviews and social media content - into structured insights by applying sentiment analysis and automated text mining [9]. This natural language integration works hand-in-hand with KNIME's extensive data connectors.
Warehouse Compatibility
KNIME stands out with its more than 300 data connectors, providing access to cloud warehouses like Snowflake, Databricks, Google BigQuery, and Amazon Redshift, alongside traditional databases such as Oracle, SQL Server, and PostgreSQL. Its push-down processing feature executes transformation logic directly within databases and Spark clusters, optimizing performance by minimizing unnecessary data transfers [12]. Tasks like extracting data, cleansing and filtering it, merging it with other sources, and generating reports are handled efficiently within KNIME [12].
Governance Features
KNIME goes beyond connectivity by offering robust governance tools. The commercial KNIME Business Hub includes role-based access control, audit trails, and version control, ensuring enterprise teams maintain control and oversight. Its GenAI Gateway routes generative AI requests through approved providers, enabling organizations to monitor usage and safeguard sensitive information. Additionally, KNIME automatically tracks data and model lineage, which helps with compliance and enhances transparency. Allan Luk, Director of Data Science and Analytics Business Solutions, highlights its accessibility:
"KNIME is easy to learn and adopt and is an integral part of our corporate Citizen Data Scientist training program. We've had engineers go from complete beginners to analytics practitioners within a few months" [11].
Code Inspectability
KNIME ensures every step in its visual workflows is well-documented. Users can incorporate custom scripts written in Python, R, or JavaScript, inspect them, and even package them as reusable nodes with governance controls. This approach provides better oversight compared to running unmanaged code [13].
Strengths and Weaknesses
Each analytics platform offers its own mix of benefits and challenges, catering to teams based on their technical skills, infrastructure, and governance needs. Querio stands out for its emphasis on transparency and governed self-service, setting a high bar for AI-driven analytics. The table below provides a side-by-side comparison of the strengths, limitations, and ideal use cases for each platform, with Querio leading the way in delivering unmatched transparency and efficiency.
Platform | Strengths | Limitations | Best For |
|---|---|---|---|
Querio | Provides inspectable code for every answer, live connections to data warehouses without duplication, and a shared context layer ensuring consistent business logic across all use cases. Its direct warehouse access and unified logic surpass competitors. | Requires initial semantic modeling setup for optimal performance. | Teams that need transparent, audit-ready analytics with governed self-service and direct access to their data warehouse. |
Tableau AI | Excels in visualizations (rated 8.6/10), offers an intuitive drag-and-drop interface, and includes AI-powered Pulse for automated KPI tracking and natural-language insights [3]. | High cost at $75 per user/month for Creator licenses, a steep learning curve requiring 20–40 hours to master, and reliance on additional tools for data preparation [2]. | Organizations focused on high-end visual storytelling, board-level presentations, and advanced data visualization. |
Looker | Features real-time insights through in-database architecture, strong governance via the LookML semantic layer, and seamless integration with Google Cloud and Vertex AI (rated 8.4/10 for cost efficiency for GCP users) [3] [15]. | High starting price of $60,000/year, additional hidden costs for extra features, and limited appeal outside of the Google ecosystem [15] [3]. | Data engineering teams, enterprises using Google Cloud and BigQuery, and those prioritizing centralized, governed data models. |
Power BI | Integrates seamlessly with Microsoft 365 and Azure, is budget-friendly at $14 per user/month for the Pro tier, and scores highest for governance (8.8/10), supported by Copilot assistance for DAX formulas [1] [3]. | Outdated desktop app interface, complexity in mastering DAX language, struggles with datasets over 1 million rows without Power Pivot, and AI assistance that often requires additional technical input for refinement [1] [2]. | Microsoft-centric organizations, budget-conscious teams, and businesses already invested in Azure infrastructure. |
KNIME | Free open-source core, drag-and-drop workflows with over 300 data connectors, a modular setup for complex pipelines, and strong performance with large datasets [10] [14]. | Steep learning curve for non-technical users and a cluttered interface compared to other no-code tools [14]. | Data scientists and engineers needing customizable, cost-effective pipelines for advanced data processing. |
Querio sets itself apart by delivering transparency and efficiency through features like inspectable analytics and live warehouse integration. While other platforms excel in areas like visualization or cost-effectiveness, Querio's direct access to data and governed logic ensure consistent, audit-ready insights that competitors struggle to replicate. Its focus on transparency and self-service analytics positions it as the ideal choice for teams seeking reliable, governed solutions.
Conclusion
Selecting the right AI data analysis platform comes down to your team's specific needs, technical setup, and governance priorities. While many platforms cater to niche use cases, they often come with trade-offs like higher costs, added complexity, or limitations in data management.
In this crowded space, Querio stands out by tackling common analytics challenges head-on, such as data duplication, unclear AI outputs, and inconsistent metrics. Querio connects directly to live data warehouses, eliminating the need for data extracts. It also provides audit-ready, inspectable SQL and Python code, ensuring transparency. With its shared context layer, metrics and definitions stay consistent across analyses, dashboards, and embedded applications, addressing a major pain point in traditional analytics workflows.
Whether you’re a small business just starting with analytics, a mid-sized company juggling multiple data sources, or a large enterprise managing complex governance requirements, Querio adapts to your needs. Its ability to integrate data without duplication, while offering governed self-service access, ensures the reliability needed for critical decision-making at any scale.
The analytics world is moving toward agentic AI and centralized semantic layers - trends that emphasize autonomous workflows and consistent metric definitions [16]. Querio is built for this evolution, featuring AI agents that generate inspectable code and scalable governance. Instead of overhauling your entire system at once, you can start small with a single high-value data product and expand gradually as confidence grows [16].
For teams seeking reliable, future-ready business intelligence, Querio offers a solution that prioritizes transparency, governed self-service, and live data access. It’s a platform designed to meet today’s challenges while preparing you for the demands of tomorrow.
FAQs
How long does it take to set up Querio?
Setting up Querio is designed to be a smooth and speedy process. While the exact time it takes can differ based on individual needs, the platform is built to connect live data quickly. This means you can dive into analyzing and uncovering insights for your business without unnecessary delays.
Can Querio run on live warehouse data without copying it?
Querio works directly with live warehouse data, enabling real-time analysis without requiring data duplication. This approach speeds up insights and avoids the inefficiencies of redundant copying.
How can I audit or verify Querio’s AI-generated answers?
To evaluate Querio's AI-generated answers, start by verifying the credibility and timeliness of the sources and data it relies on. Whenever possible, cross-check its outputs against original datasets or perform manual calculations to confirm accuracy. Implement user feedback loops so inaccuracies can be flagged and addressed. Additionally, leverage explainability tools, such as detailed reasoning or source citations, to provide transparency. Regularly measure Querio's responses against established benchmarks to maintain accuracy, dependability, and compliance with data governance standards.
Related Blog Posts


