Business Intelligence
The Definitive Guide to AI Data Visualization Tools and Trends in 2025
Explore how AI is revolutionizing data visualization tools in 2025, enhancing decision-making with real-time insights and natural language querying.
AI is transforming data visualization in 2025, making it faster and easier for businesses to analyze and understand massive datasets. Tools now offer features like natural language queries, automated dashboards, and real-time updates, helping teams make decisions quickly and efficiently. Querio, a standout platform, enables users to ask plain-English questions and get instant, accurate visualizations while maintaining strong security and compliance standards.
Key Highlights:
AI Features: Natural language querying, automated dashboards, anomaly detection, and intelligent chart recommendations.
Real-Time Insights: Live data connections keep visualizations updated instantly.
Security & Compliance: SOC 2 Type II compliance, encryption, role-based access controls, and GDPR/CCPA adherence.
Trends: Generative AI for data storytelling, interactive dashboards, and advanced data governance.
Querio starts at $14,000/year, offering unlimited viewers and 4,000 monthly prompts, with options for additional features. U.S. businesses can leverage these tools to streamline decision-making, improve data accessibility, and ensure compliance with regulations.
AI tools in data visualization: where to next?
Core Features of AI Data Visualization Tools
AI visualization platforms have transformed how businesses interpret data. By processing massive datasets and presenting insights in formats tailored to specific needs, these tools provide actionable intelligence with ease and precision.
Key Features That Drive Value
Natural language querying allows users to interact with data conversationally. For example, you can ask, "What were our top-performing products in Q3?" or "Show me customer retention rates by region", and the tool will generate optimized visualizations in seconds.
Automated dashboard creation removes the need for manual effort. AI algorithms analyze your data structure and automatically build dashboards, making it easier for teams to focus on decision-making rather than report building. This is especially helpful for organizations without dedicated data visualization experts.
Live warehouse connections ensure your visualizations are always up-to-date. By pulling real-time data directly from warehouses, cloud systems, or operational databases, these connections eliminate delays and keep insights current.
Embedded analytics tools and capabilities integrate visualizations into the tools your teams already use. For instance, sales teams can view performance metrics directly within their CRM, while customer service teams can access real-time analytics without leaving their dashboards.
Intelligent chart recommendations simplify the decision-making process by analyzing your data and suggesting the best visualization type. Whether it’s a bar chart, heat map, or scatter plot, the AI tailors its recommendations based on data characteristics, audience, and goals.
Anomaly detection and alerting adds another layer of value by monitoring data streams and flagging unusual patterns. Whether it's a sudden sales spike or a potential issue with data quality, these alerts enable teams to respond quickly.
Security and Compliance Standards
SOC 2 Type II compliance is a critical feature for platforms handling sensitive data, particularly in sectors like healthcare and finance. This certification ensures that the platform adheres to strict security protocols for processing, storing, and transmitting data.
End-to-end encryption safeguards data at every step, from database connections to API communications and stored dashboards. Platforms often use AES-256 encryption and maintain separate encryption keys for each client to ensure maximum security.
Role-based access controls let organizations define who can view, edit, or share specific data and dashboards. This ensures sensitive information, like financial data, is only accessible to authorized personnel, while operational metrics remain available to broader teams. Many platforms integrate seamlessly with identity management systems like Active Directory or Okta.
Data residency controls address concerns about where sensitive information is stored and processed. For U.S. businesses, this often means ensuring data remains within American borders. Leading platforms offer dedicated U.S. data centers and transparent documentation on data handling.
Audit logging and monitoring track all user interactions with data and dashboards. These logs provide a detailed record of access and changes, supporting both regulatory compliance and internal oversight.
GDPR and CCPA compliance features help organizations navigate privacy regulations without sacrificing insights. Tools like data anonymization, consent management, and automated deletion workflows ensure compliance with privacy laws while maintaining the ability to extract meaningful business insights.
Querio: Leading AI Data Visualization in 2025
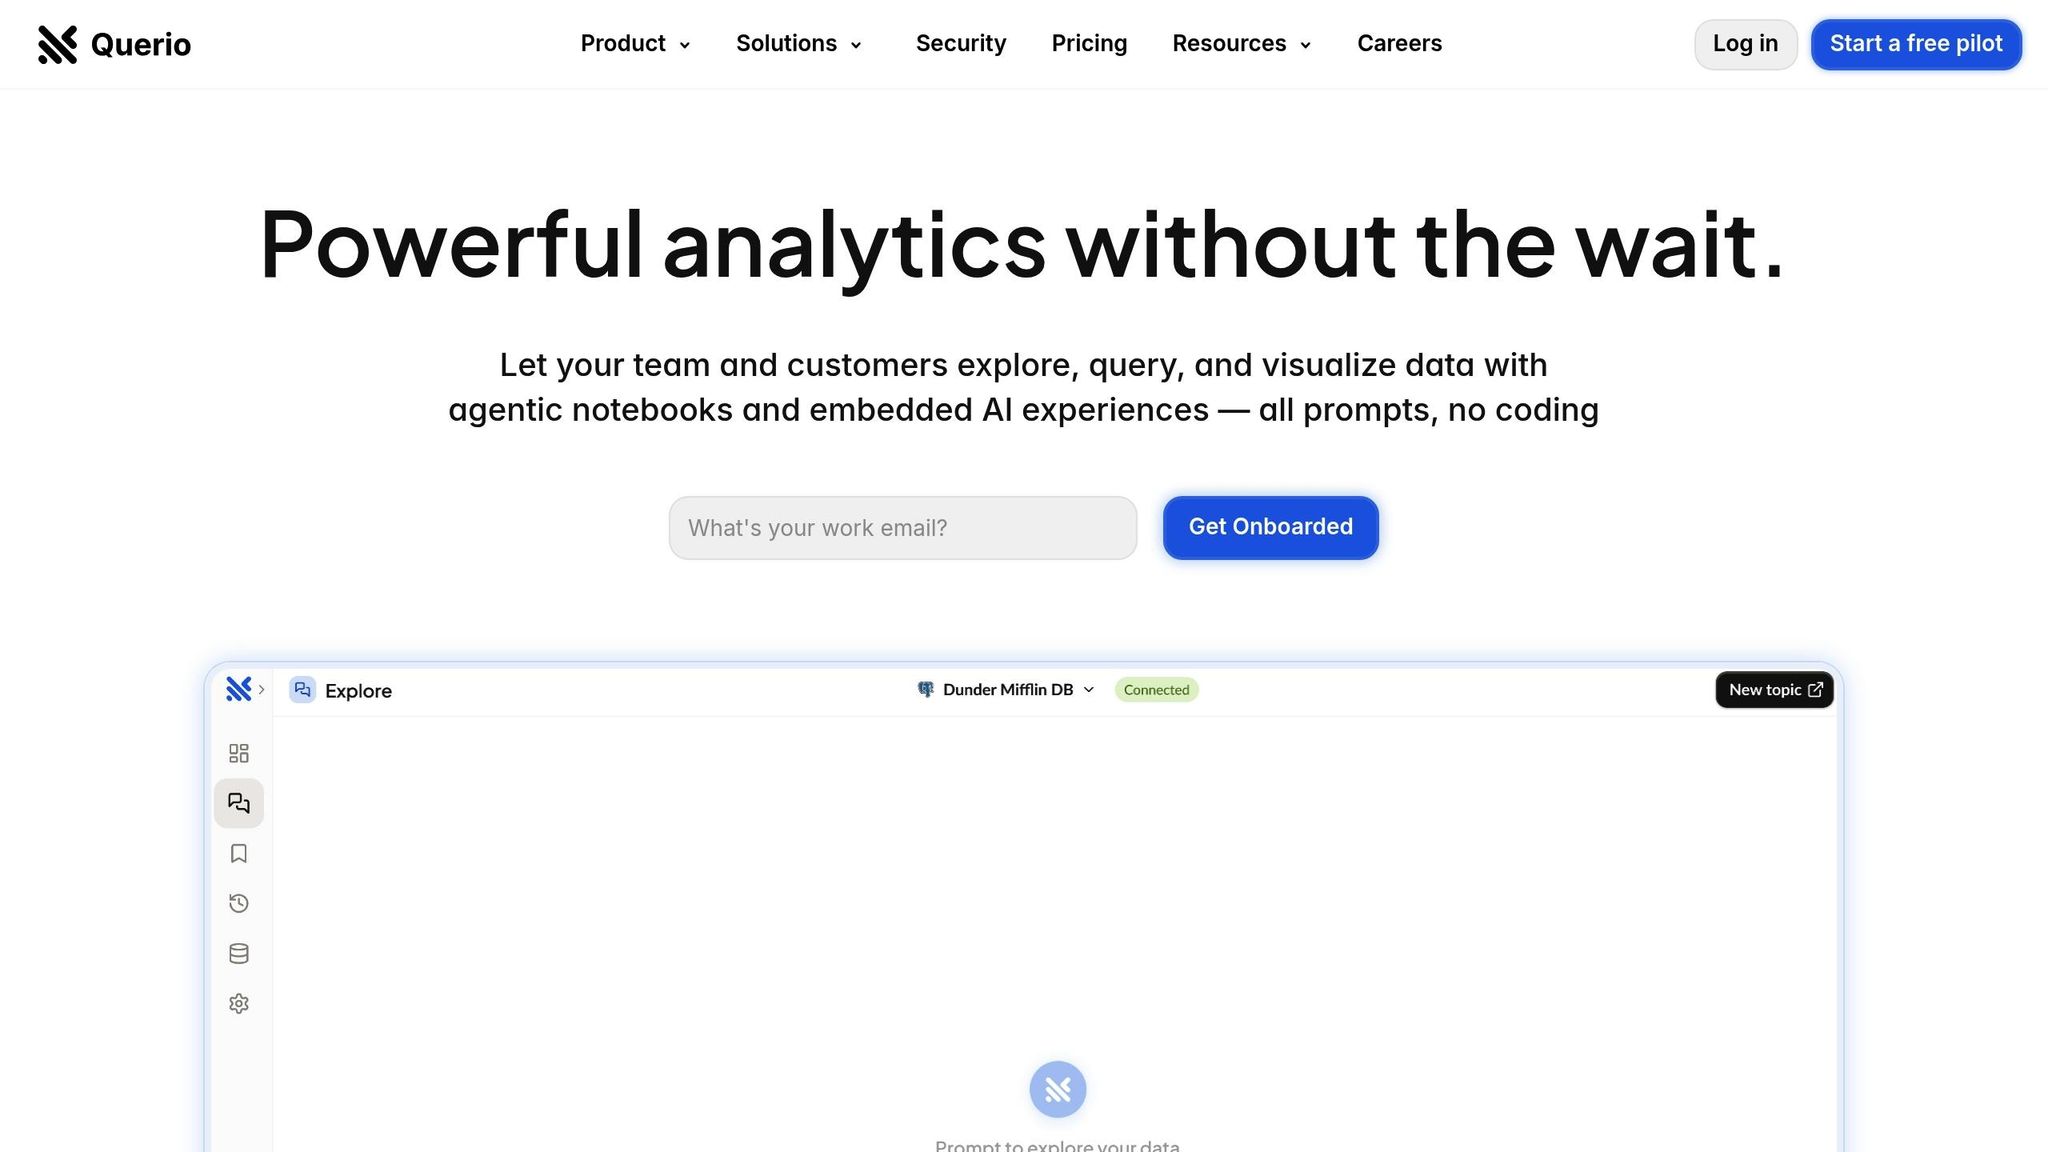
Querio has positioned itself as an AI-powered business intelligence workspace that transforms how businesses interact with data. Unlike older visualization tools that often demand technical know-how, Querio lets anyone - from product managers to finance teams - ask questions about live data in plain English and receive detailed charts in seconds. Here's a closer look at what makes Querio a standout choice for U.S. businesses.
Key Features and Capabilities
At the heart of Querio's platform is its plain English querying feature. Users can type questions like, "What’s our customer acquisition cost by channel this quarter?" or "Show me revenue trends for our top 10 products", and the AI instantly translates these into optimized SQL queries, delivering accurate visualizations on the spot.
Querio also offers live warehouse connections, integrating directly with systems like Snowflake, BigQuery, and Postgres using encrypted, read-only credentials. This ensures real-time insights without duplicating data, maintaining data accuracy and security.
With governed context layers, data teams can define table joins, metrics, and glossary terms once and apply them organization-wide. For example, when someone queries "revenue", the system automatically applies the correct fields and calculations, eliminating confusion and ensuring consistency.
For deeper analysis, Querio provides AI Python notebooks. These notebooks operate on the same governed data as the natural language queries, allowing data scientists and analysts to conduct advanced statistical analyses, machine learning tasks, and custom calculations - all while adhering to organizational data governance.
The platform also includes drag-and-drop dashboards, making it simple for teams to build and customize dashboards without technical expertise. Users can combine charts, add filters, and schedule reports to keep stakeholders informed.
Querio's embedded analytics capabilities allow businesses to integrate its features directly into their applications, ensuring insights are easily accessible within existing workflows.
Finally, Querio operates on an unlimited viewer model, enabling organizations to share insights across their entire workforce without worrying about per-user licensing fees.
Benefits for U.S. Businesses
Querio’s features translate into practical benefits for American companies, making it a valuable tool for modern enterprises.
Cost efficiency is a major plus. Querio’s pricing starts at $14,000 per year for one database connection, 4,000 monthly prompts, and unlimited viewers. Additional database connections cost $4,000 per year each, and the dashboard add-on is available for $6,000 annually. This straightforward pricing helps businesses budget without surprises.
Compliance and security are baked into the platform. Querio meets SOC 2 Type II compliance standards and guarantees a 99.9% uptime SLA, ensuring businesses can rely on uninterrupted access to their data. Features like end-to-end encryption and role-based access controls integrate seamlessly with existing identity management systems.
With Querio, faster decision-making becomes a reality. Business users can create visualizations on their own, cutting down the days it often takes to generate reports manually. This speed allows teams to respond quickly and adapt their strategies on the fly.
For companies with unique needs, Querio offers scalable deployment options. While its cloud-based SaaS solution is ideal for most, organizations with strict data residency requirements can choose a self-hosted option. Self-hosted deployments are priced at 50% above recurring fees, with a $60,000 annual minimum.
Querio also streamlines data preparation through its data pipeline capabilities, supporting up to three pipelines for $10,000 per year, ensuring consistent data quality across all visualizations.
Top AI Data Visualization Trends in 2025
The world of AI data visualization is shifting fast, thanks to advancements in technology. By 2025, several trends are changing how businesses access and interpret their data. After exploring the core features of Querio, let’s dive into the trends shaping the future of AI-powered data visualization and how they’re changing the way companies interact with information.
Real-Time and Interactive Dashboards
The need for instant insights has skyrocketed. Companies now face fast-changing markets, and real-time dashboards are becoming essential tools for staying ahead. These dashboards allow teams to continuously monitor performance by processing live data streams from operational systems. As new information flows in, visualizations update automatically. This means sales teams can watch conversion rates in real time, supply chain managers can keep an eye on inventory levels, and marketing teams can adjust campaigns on the fly based on current performance metrics.
What makes this even better is the ability to interact with the data. Instead of being limited to static charts, users can dive deeper - filtering, pivoting, and exploring data as needed. This hands-on approach turns raw data into actionable insights. With the support of powerful cloud infrastructures, this kind of interactivity works seamlessly. It also sets the stage for generative AI to take data storytelling to the next level.
Generative AI in Data Storytelling
Live dashboards are just the beginning. Generative AI is stepping in to create meaningful narratives from data, offering a new way to interpret visual information. In 2025, automated narrative generation is making waves in data visualization. These AI tools can analyze complex patterns and trends within datasets, then produce written explanations that highlight key insights, outliers, and recommendations. This bridges the gap between presenting data and understanding it, especially for users without a technical background.
Generative AI doesn’t stop there. It can identify correlations, uncover potential causes, and even answer complex questions posed in plain English. For example, users can ask detailed questions and have the system translate them into database queries, providing precise answers. This interactive, conversational approach transforms data reporting into a tool that’s not only useful for executive summaries but also customizable for different audiences within an organization.
Data Governance and Democratization
Data governance remains a cornerstone of AI-powered visualization tools, ensuring data is accurate, ethical, and free from misleading conclusions or bias[1]. By 2025, businesses are finding ways to balance broad data access with strict control measures. Modern platforms now come with built-in governance features that define data relationships, establish key metrics, and manage access permissions at a system-wide level.
Enhanced role-based access controls make it easier to assign data permissions tailored to specific job roles or departments. Meanwhile, AI-driven monitoring systems actively check for inconsistencies or missing data, ensuring the quality stays intact. This combination of accessibility and control allows organizations to share data widely while maintaining the integrity and trust needed for confident decision-making.
How to Adopt AI Visualization Tools
Adopting AI visualization tools requires careful planning and a clear strategy. U.S. businesses often face specific hurdles, such as regulatory requirements and preparing teams for new workflows. To ensure these tools deliver the value they promise, it’s essential to build a solid foundation that meets both immediate and long-term goals. Here’s how to assess your needs, ensure compatibility, and prepare your team for success.
Assessing Your Organization's Needs
Start by mapping out your data landscape. This means identifying key data sources across systems like CRM, ERP, marketing platforms, and financial tools. Evaluate how these systems connect and determine whether your team would benefit more from conversational stories or traditional dashboards. The goal is to match the tool's features to your team's capabilities.
Next, consider the volume and frequency of your data. If your organization processes large amounts of transactions daily, you'll need tools that handle real-time data streams without slowing down. Smaller teams, on the other hand, might prioritize ease of use over advanced capabilities. Be sure to identify any bottlenecks, such as outdated insights or fragmented data, that could hinder decision-making.
Budgeting is another critical step. Costs can include software licenses, database connection fees, training, and ongoing maintenance. Many platforms charge based on query volume or user tiers, so it’s important to estimate your usage patterns to avoid unexpected expenses.
Ensuring Compatibility and Compliance
For U.S. businesses, compliance with regulations is non-negotiable, especially in industries like healthcare, finance, and government. For example, organizations handling health information must meet HIPAA standards, while public companies must adhere to SOX requirements for financial reporting. Choosing platforms with built-in compliance features can save significant time and effort compared to retrofitting security measures later.
Data residency rules also vary by state and industry. Some organizations are required to keep data within specific geographic boundaries, while others need detailed audit trails for data access. Platforms with certifications like SOC 2 Type II compliance are a good choice, as they’ve undergone third-party audits to verify their security practices.
Before committing to a platform, test it with your actual data. This ensures it can handle your data types and align with your business logic. Integration is equally important - if your team uses tools like Slack for communication, for example, look for a platform that can send automated alerts or reports directly to those channels.
Finally, assess your IT department's ability to manage the new tools. Some platforms require significant setup and ongoing maintenance, while others operate as fully managed services. Cloud-based solutions can reduce IT overhead but demand strong security protocols to protect sensitive data.
Training and Empowering Teams
Once the technical and regulatory aspects are in place, shift your focus to user training. Start with early adopters who can act as internal champions for the platform. Training should focus on practical, role-specific use cases rather than trying to cover every feature at once.
Create a library of example queries tailored to your business. For instance, queries like “What were our customer acquisition costs by marketing channel in Q4?” or “How do inventory turnover rates compare across East Coast warehouses?” can help users see the platform’s value immediately.
It’s also crucial to establish guidelines for interpreting data. AI tools can highlight correlations that aren’t always causative, so users need to validate insights before making major decisions. This means understanding confidence levels, spotting potential data quality issues, and knowing when to dig deeper.
Tailoring training to specific roles can make the process more effective. Teams in marketing, finance, and operations will benefit from learning how the tool applies to their unique workflows and key performance indicators. Designate internal experts to answer questions and troubleshoot issues, and consider hosting regular sessions for advanced features or complex queries.
Finally, track how the platform is being used and gather feedback. This will help you refine your training programs and identify areas where users might need additional support. Over time, this approach will ensure your team feels confident and empowered to get the most out of the tools.
Conclusion and Key Takeaways
AI-driven data visualization in 2025 is reshaping how businesses approach decision-making. Its speed, accuracy, and adaptability allow organizations to gain insights faster and make smarter choices. Moving from traditional business intelligence tools to AI-native platforms isn’t just a tech upgrade - it’s a fundamental shift in how teams interact with and leverage data.
Summary of Tools and Trends
Let’s summarize some of the key advancements shaping this space:
Real-time analytics and conversational querying are now the norm. Instead of waiting hours - or even days - for insights, teams can ask questions in plain English and get instant, accurate visualizations. This makes data accessible to everyone, from marketing managers to finance directors, without requiring technical skills like SQL.
Data governance has advanced to support this new level of access. Modern platforms enable data teams to set up context layers - like table joins, business definitions, and glossaries - ensuring consistent and reliable insights across the organization. This keeps data quality intact while opening it up to more users.
Security and compliance are no longer optional. Built-in certifications give U.S. businesses the confidence to scale their use of AI visualization tools while maintaining strict standards for data protection.
Next Steps for Businesses
What should your organization do next? Here’s a roadmap to get started:
Assess your current data processes and analytics workflows. If reporting delays or disconnected systems are slowing your teams down, it’s time to explore AI visualization tools that deliver real-time insights.
Choose platforms that integrate seamlessly. Look for solutions that connect directly to your existing data warehouse. This eliminates the need for duplicating data, reduces security risks, and ensures your visualizations are always up-to-date. Platforms that combine natural language querying with traditional dashboards can cater to diverse team needs.
Explore solutions like Querio. Querio offers an AI-native workspace for $14,000 per year, including unlimited viewer access and 4,000 prompts monthly. Its governance features allow data teams to set up context once and maintain it over time, addressing a key challenge in making data accessible to all.
Invest in training and internal champions. Focus training on practical, role-specific use cases rather than overwhelming teams with every feature. Appoint champions within your organization who can guide colleagues on interpreting AI-generated insights and knowing when to dive deeper into the data.
The real winners in this space will be companies that treat AI visualization tools as a way to enhance decision-making, not just as replacements for outdated systems. By 2026, the competitive edge will belong to organizations that turn data into actionable insights faster than the rest. The tools are ready - now it’s up to you to embrace this evolution and unlock the full potential of your data.
FAQs
How does Querio make data easier to access for users without technical expertise?
Querio's natural language querying feature makes accessing data straightforward by letting users ask plain text questions. Forget about needing technical skills like SQL - this tool allows anyone to create visualizations and discover insights without requiring specialized training.
By turning complex data into something understandable through everyday language, Querio enables non-technical users to explore information effortlessly. The result? Improved productivity and smarter, more informed decisions.
What security and compliance measures does Querio have, and why are they crucial for U.S. businesses?
Querio places a strong emphasis on security and compliance to keep your data safe and aligned with U.S. regulatory standards. The platform employs advanced protections like end-to-end encryption, conducts regular security audits, and adheres to key frameworks such as GDPR and CCPA when applicable.
For businesses in the U.S., these safeguards are critical to protecting sensitive data, building customer trust, and steering clear of expensive non-compliance penalties. With Querio, you can focus on making the most of your data while we take care of its security and regulatory needs.
How does generative AI in data storytelling with Querio help organizations make better decisions?
Generative AI is transforming data storytelling, especially for organizations using Querio. It simplifies the often-daunting task of analyzing complex data by letting users ask questions in plain language. With just a few text prompts, it can create detailed visualizations and provide clear, concise summaries that break down the results in a way that's easy to grasp.
This approach makes it easier to spot trends, recognize patterns, and share insights effectively. The result? Teams can make decisions faster and with greater confidence.
Related Blog Posts


