What Is Cost Allocation: Understanding Cost Allocation For
Discover what is cost allocation and why traditional methods fail for data & AI. Our 2026 guide covers formulas, examples, and a framework for modern data
https://www.youtube.com/watch?v=2okjGf8zVwE
published
Outrank AI
cost allocation, cloud cost management, finops, data team metrics, accounting for tech
c50aa908-9e06-4f3b-852f-1f4bb3f04734

Most advice about cost allocation is still built for rent, utilities, and back-office overhead. That advice isn't wrong. It's incomplete. In a modern data stack, costs don't arrive in neat monthly buckets. They spike with warehouse usage, self-serve notebooks, model inference, orchestration jobs, and ad hoc analysis. That's why static allocation breaks down, and why unattributed usage keeps turning into budget surprises.
The gap is now hard to ignore. Existing guidance still treats cost allocation as a manual accounting process, even though cloud-native systems create real-time usage patterns that old allocation factors can't see. One source notes that 78% of data leaders report cloud cost overruns are due to unattributed usage in discussions of the limits of static allocation for modern infrastructure (MRSC on cost allocation). If you're trying to understand why analytics and AI costs feel harder to control than software licenses or office rent, that's the reason.
The popular advice says, "pick a driver, run the allocation monthly, move on." Data teams know that isn't enough. A warehouse query can be triggered by finance, product, sales, or an internal AI workflow. A shared BI layer can hide expensive behavior until the invoice lands. The operational consequences show up long before accounting catches up, especially in environments shaped by the hidden costs of traditional BI platforms.
Table of Contents
Why Your Accounting Textbook Is Wrong About Costs
Traditional cost allocation assumes two things that don't hold in data infrastructure. First, costs are relatively stable. Second, the driver is easy to observe. That works reasonably well for office rent or shared HR support. It works badly for compute, storage, orchestration, notebooks, and AI agents whose usage changes throughout the day.
A finance textbook usually frames allocation as a periodic exercise. You collect indirect costs, choose a basis like headcount or square footage, and assign them across departments. The principles still matter. The mechanics don't travel well into a stack where a single product launch, dashboard refresh pattern, or model experiment can change spend immediately.
Practical rule: If the cost moves with usage, a static monthly proxy will eventually mislead someone.
This is the modern answer to what is cost allocation. It's still the discipline of assigning shared costs fairly. But for data teams, it's also an operating system for visibility. You're not only trying to close the books correctly. You're trying to answer questions while people can still act on them.
Three questions matter in practice:
Who consumed the resource? A department, team, product, customer workflow, or internal platform.
What cost was shared? Warehouse compute, transformation jobs, notebook execution, AI model usage, observability, or storage.
Which driver reflects benefit or usage? Query volume, execution time, bytes processed, scheduled runs, tagged ownership, or a fallback heuristic.
The old framing treats allocation as a compliance chore. In modern operations, it shapes pricing, budgeting, product decisions, and whether self-serve analytics stays sustainable.
The Fundamentals of Cost Allocation Explained
What cost allocation actually means
Cost allocation is the process of identifying, aggregating, and assigning indirect costs to specific cost objects so you can determine their true cost. The standard mechanics are straightforward: gather shared expenses into cost pools, then apply a reasonable allocation base so each cost object bears its fair share (NetSuite on cost allocation).
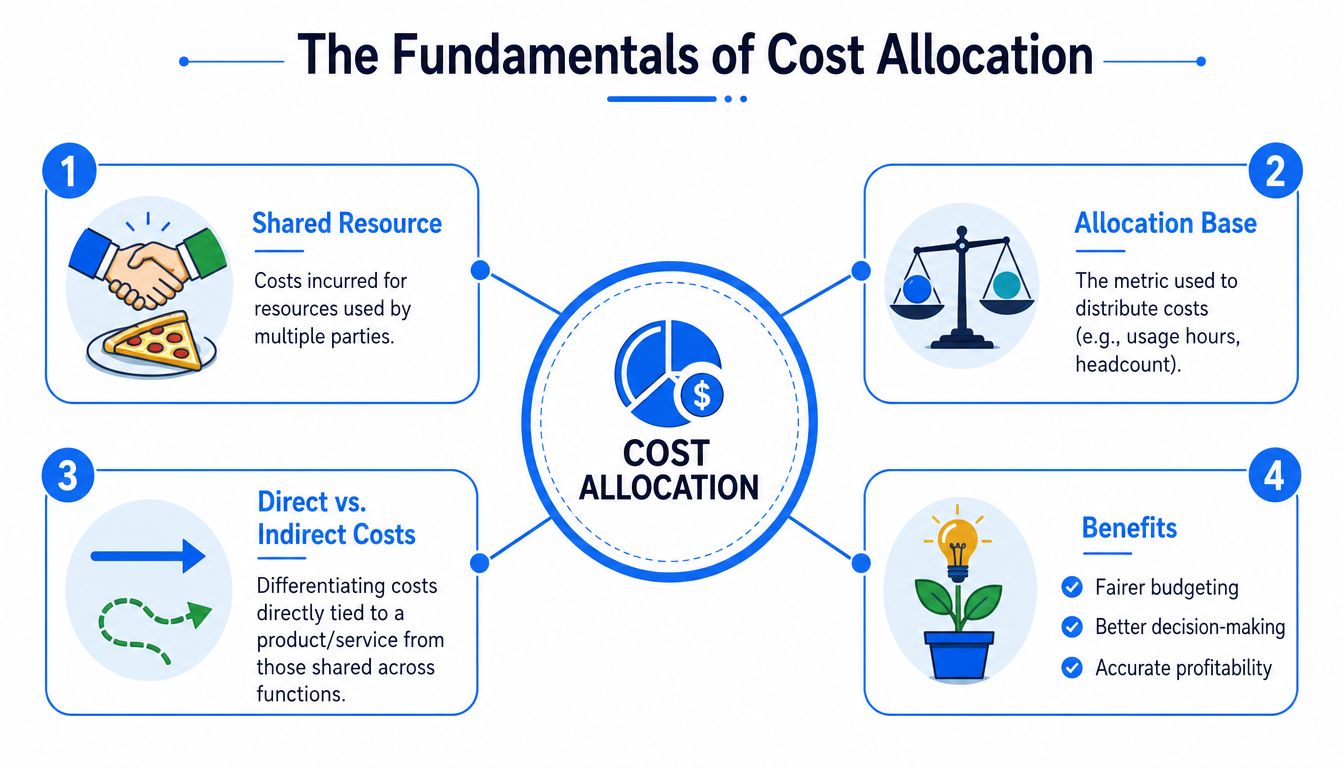
A simple analogy helps. Think about splitting the cost of a shared office. Rent, cleaning, internet, and reception aren't caused by one team alone. Engineering, Sales, and Marketing all benefit. If you only record those costs centrally and never distribute them, each team's reported economics look cleaner than reality.
The same logic applies to data work. A shared warehouse, orchestration layer, and notebook environment support many teams at once. If you don't allocate those costs, you'll understate the actual cost of the reports, experiments, and product features built on top of them.
The moving parts that matter
Four terms do most of the work.
Cost objects: These are the destinations for allocated costs. In practice, that might be a department, product line, customer segment, project, or internal platform.
Indirect costs: These are shared costs that can't be traced cleanly to one output. Rent, admin salaries, platform subscriptions, and common cloud resources usually belong here.
Cost pools: These group related shared costs before allocation. For example, "data warehouse compute" or "shared analytics tooling."
Allocation base: This is the rule for distribution. Headcount, square footage, usage logs, run time, or tagged ownership can all serve as the basis if they reflect actual benefit.
Direct costs don't need debate. Indirect costs do. That's why allocation matters.
A lot of confusion comes from mixing direct and indirect costs. If a team has a dedicated software license used only by that team, assign it directly. If multiple teams benefit from a shared platform, you need a method.
Good allocation is less about finding the perfect formula and more about choosing a driver that people can understand, defend, and update. Bad allocation usually fails one of those tests.
Comparing the Four Main Allocation Methods
How the methods differ in practice
Most organizations end up choosing among four broad approaches. None is universally best. The right method depends on organizational complexity, the quality of your usage data, and how much precision the business needs.
The Direct Method is the simplest. You allocate shared service department costs straight to final cost objects and ignore interactions among support functions. If IT supports Finance and HR, and HR also supports IT, the Direct Method skips that reciprocal relationship. It's easy to run and easy to explain. It's also crude.
The Step-Down Method adds one layer of realism. You allocate one support department first, then move sequentially through the others. That captures some interdependence, but only in one direction. The ordering matters, which means two smart people can produce different results from the same inputs.
The Reciprocal Method tries to model shared services more faithfully. It recognizes that support functions can serve each other. That makes it more accurate in theory, but harder to maintain without a disciplined finance process or software support.
Then there's Activity-Based Costing, usually shortened to ABC. Instead of allocating a broad overhead pool with one driver, ABC traces costs through activities. For data teams, that mindset is often the most useful because it asks what drives consumption. Queries, transformations, scheduled runs, model calls, and notebook executions are all activities.
Where teams go wrong: They pick the easiest method their spreadsheet can support, not the method their operating model requires.
Cost allocation method comparison
Method | Complexity | Accuracy | Best For |
|---|---|---|---|
Direct Method | Low | Low to moderate | Smaller organizations with simple shared services |
Step-Down Method | Moderate | Moderate | Companies that want more realism without heavy modeling |
Reciprocal Method | High | High | Environments with meaningful support-to-support interactions |
Activity-Based Costing | High | High when usage data is strong | Data-heavy businesses with observable cost drivers |
A practical reading of that table matters more than the labels.
Direct Method
Use it when speed matters more than precision. Early-stage companies often start here because they need an answer, not a perfect model. The trade-off is that shared platform costs can look flatter than they really are.
Step-Down Method
This is often the middle ground for finance teams that want better fairness without building a complex cost model. The main weakness is governance. Someone has to decide the sequence and justify it.
Reciprocal Method
This is the most defensible if support functions materially consume each other. It's less common in startup environments because maintaining the logic can be heavier than the business needs.
Activity-Based Costing
ABC is usually the closest match for modern technology operations because usage often follows activities rather than department size. The catch is implementation overhead. If the underlying metadata is weak, ABC turns into theater. You get detailed-looking numbers without trustworthy attribution.
A useful rule is to match the method to the decision. If you're setting broad departmental budgets, Step-Down might be enough. If you're trying to understand cost per feature, cost per workflow, or cost per customer-facing data product, activity-level attribution is much more useful.
A Step-By-Step Allocation Example with Formulas
The setup
Let's make this concrete with a small example. Assume a software company shares a monthly office rent expense of $10,000 across three departments: Engineering, Sales, and Marketing. Rent is the cost pool. The departments are the cost objects. Headcount is the allocation base.
Suppose the headcount is:
Engineering: 20
Sales: 15
Marketing: 5
That gives total headcount of 40.

This example is intentionally simple. In a warehouse billing model, you'd often replace headcount with a usage metric and use SQL to compute the allocation logic. If you need a refresher on building the denominator cleanly, a basic guide to the SUM function in SQL is useful because most allocation math starts with grouped totals.
The formula and the math
The standard formula is:
Allocated cost for a department = (Department allocation base ÷ Total allocation base) × Total cost pool
Apply it to each department.
Engineering allocation
(20 ÷ 40) × $10,000 = $5,000Sales allocation
(15 ÷ 40) × $10,000 = $3,750Marketing allocation
(5 ÷ 40) × $10,000 = $1,250
You can also express this as percentages first:
Engineering = 20/40 = 50%
Sales = 15/40 = 37.5%
Marketing = 5/40 = 12.5%
Then multiply each percentage by the cost pool.
When the base is valid, the math is easy. Most allocation disputes aren't about arithmetic. They're about whether the base reflects reality.
Often, teams stop too early. They calculate the split, then assume the model is sound. But headcount only makes sense because office rent broadly follows space needs. If this were shared cloud compute, headcount would be a weak proxy.
Journal entries
The accounting entry records the shift from a central overhead account into departmental expense buckets.
One common way to record the monthly allocation is:
Debit Rent Expense, Engineering: $5,000
Debit Rent Expense, Sales: $3,750
Debit Rent Expense, Marketing: $1,250
Credit Allocated Rent Clearing or Central Rent Account: $10,000
The exact account names vary by chart of accounts, but the logic doesn't. You're moving a shared expense into the places where management wants to see the true cost.
For data leaders, the lesson isn't the journal entry itself. It's the structure. Pick the pool. Pick the base. Calculate the share. Post it consistently. That same pattern can be adapted for notebooks, warehouse usage, model serving, or shared platform subscriptions.
Common Pitfalls and How to Avoid Them
The mistakes that distort decisions
Most failed allocation models don't fail because the math is complicated. They fail because the inputs go stale, the driver is lazy, or nobody can explain the result.
The most common mistake is using a convenient allocation base instead of a causal one. Headcount is the classic example. It's acceptable for office costs. It's often poor for platform usage. If one team runs heavy transformations and another mostly reads dashboards, equalizing them by headcount will create resentment and bad decisions.
Another frequent problem is treating allocation as fixed. Teams choose a method once, then keep using it even after the operating model changes. New tools get added. Usage patterns shift. Ownership changes. The allocation stays frozen.
What a defensible process looks like
One source on allocation best practices is refreshingly specific. Departments should document the percentage charged, the method or reasoning used, and the supporting documentation and approvals. They should also regularly update and monitor the data and methodology so costs continue to reflect relative benefit (UCSF cost allocation methodology best practices).
That guidance translates well outside regulated environments. A workable process usually includes:
Clear driver selection: Match the base to benefit received or actual usage, not convenience.
Current data: Refresh the underlying metadata often enough that the model still reflects reality.
Written rationale: If someone asks why a team received a charge, you should have an answer in one paragraph, not a scavenger hunt.
Approvals and ownership: Someone has to own each cost pool and sign off on the method.
A cost allocation model only earns trust when another operator can reproduce it from the documentation.
There's also a political pitfall. If allocation is opaque, teams argue about the bill instead of the behavior causing it. Once that happens, the model stops being a management tool and becomes a recurring negotiation.
The New Frontier Allocating Data and AI Costs

Why classic drivers stop working
Traditional allocation models assume costs scale in a relatively linear way. More people, more space. More units, more machine time. Modern data systems don't behave that neatly. A shared warehouse can support batch pipelines, ad hoc analysis, customer-facing features, and executive dashboards at the same time. The cost driver isn't "who exists." It's "who triggered and benefited from which workloads."
That breaks classic bases like headcount and square footage. They tell you who belongs to the company. They don't tell you who consumed warehouse credits, storage, orchestration time, or model inference.
The same problem shows up during incident analysis. Leaders often ask whether a spike came from bad governance, product demand, or a broken workflow. That's hard to answer if your costs are pooled and delayed. In parallel, teams trying to calculate data downtime cost are often solving the same visibility problem from another angle: they need a way to connect technical events to business impact.
A related pressure point appears in self-serve analytics. The more successfully you open access, the more usage becomes distributed, intermittent, and harder to attribute. That's one reason teams evaluating self-serve interfaces also look closely at the economics behind tools such as affordable NL2SQL alternatives to DIY LLM stacks. Access and attribution have to evolve together.
What changes when AI enters the stack
Cost allocation becomes especially tricky. A source discussing cost allocation in complex settings highlights a question many teams now face: How do we allocate costs for shared AI/ML models when the benefit is non-linear? It also notes that for AI agents, the relative output method can fail because value is threshold-based rather than proportional to volume, and existing guides miss the human API burden where data teams absorb unallocated AI costs (NERA paper on cost allocation issues).
That observation matches what data leaders see in practice. One AI-generated notebook may answer a small question. Another may unblock a decision that changes pricing, onboarding, or retention. The technical workload might look similar while the business value differs dramatically.
So the modern challenge isn't only allocating compute. It's deciding whether you're allocating by usage, by benefit, by ownership, or by a hybrid rule. For shared AI systems, a single driver usually isn't enough. Teams need a framework that separates direct usage from shared enablement and accepts that some value is lumpy, not smooth.
Automating Cost Allocation for Your Data Stack
Start with precision where it matters
Manual allocation doesn't survive modern data operations for long. The volume of events, tools, users, and workloads is too high. The better pattern is selective precision.
A practical cloud strategy follows the 80/20 rule: allocate 80% of costs with high confidence through strong tagging taxonomies and automated enforcement, then use simpler heuristics for the remaining 20% so you don't create endless engineering overhead (Deschamps cloud cost allocation guide). That's a useful operating principle because it balances accounting discipline with implementation reality.
In other words, don't wait for perfect attribution across every byte and every process. Lock down the big cost drivers first.
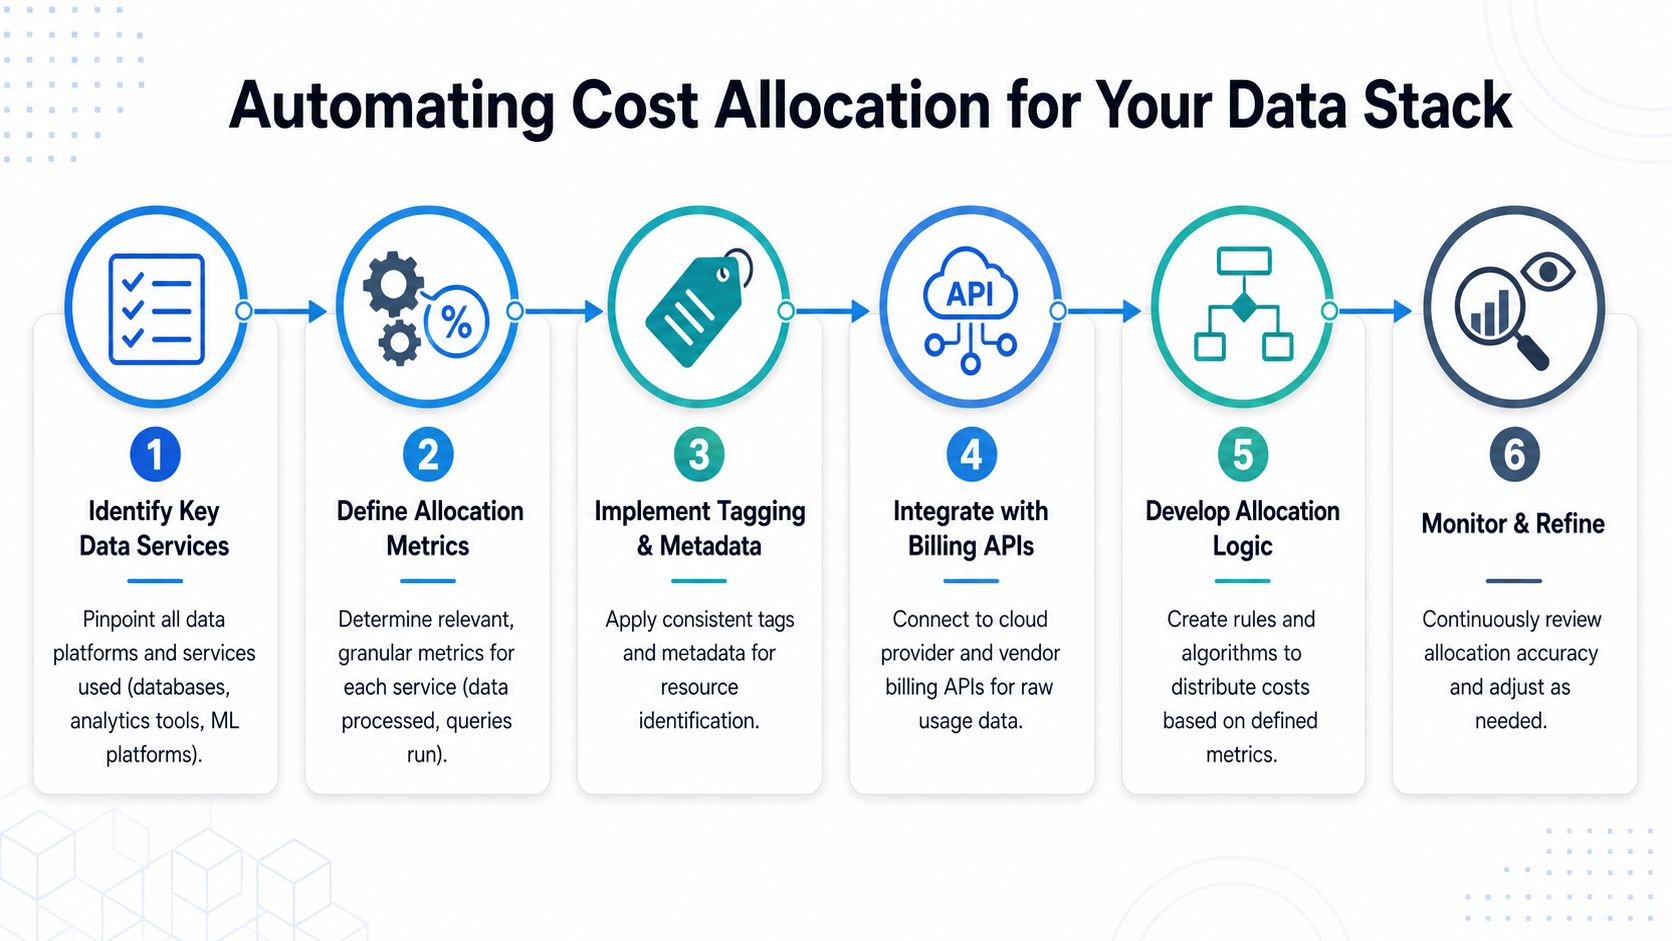
A practical automation framework
The strongest implementations usually have five parts.
Define a tagging taxonomy
Every billable resource needs ownership metadata. Team, environment, product area, workload type, and platform owner are common fields. The key is enforcement. Optional tags become missing tags.Ingest usage and billing data automatically
Pull cloud billing exports, warehouse usage tables, orchestration logs, notebook metadata, and model invocation records into one place. If you're still reconciling this in spreadsheets, the process will break under growth.Map costs to meaningful cost objects
Don't stop at "department." For data work, cost objects might include products, internal domains, customer-facing features, or analytics programs.Apply layered allocation logic
Use direct assignment where possible. For shared pools, apply usage-based rules first and fallback heuristics second. In doing so, you encode the distinction between observable consumption and necessary approximation.Publish the output where operators can see it
Monthly finance reports aren't enough. Teams need dashboards that expose cost per workflow, user group, platform, or feature while they can still change behavior.
A final point matters. Automation isn't only a data engineering task. It needs finance alignment, platform governance, and clear ownership. Teams building internal workflows often borrow ideas from broader AI operations playbooks, including resources like Prompt Builder's automation guide, because the challenge isn't just data collection. It's repeatable orchestration across systems.
The end state should feel boring. Costs flow in automatically. Logic is versioned. Exceptions are visible. Stakeholders can inspect the rules. That's also where broader business intelligence automation starts to pay off, because cost visibility becomes part of the operating layer rather than a month-end scramble.
If your team is buried in ad hoc data requests and can't tie analytics and AI usage back to the people creating cost, Querio gives you a way to move from human-API support to governed self-serve infrastructure. It helps teams run analysis closer to the warehouse, reduce attribution blind spots, and make cost visibility part of day-to-day operations instead of a finance cleanup exercise.

