BI Tools Comparison Finding the Right Analytics Platform
Our expert BI tools comparison evaluates top platforms on features, AI, and pricing. Find the best BI tool for your team with our detailed analysis and guide.
published
Outrank AI
bi tools comparison, business intelligence, analytics platforms, data visualization, querio
8cb28976-ee6a-49e1-ba87-227489ecfdbf

Picking the right Business Intelligence tool really comes down to a fundamental choice: do you need the endless visualization muscle of a legacy giant like Tableau, or are you after the speed of a modern, conversational, AI-driven platform? This isn't a small decision—it directly shapes how fast your team gets from raw numbers to smart moves and ultimately defines your company's entire data culture.
Finding the Right BI Tool in a Crowded Market

Choosing a Business Intelligence (BI) platform is one of the most important calls a modern company can make. The market is packed with options, from established players to nimble newcomers. The right tool can be a genuine engine for growth, but the wrong one just creates frustration, roadblocks, and siloed information.
This guide is designed to give you a clear, practical framework for your BI tools comparison. We're going to look past the surface-level feature lists and get to what actually matters for your business.
Beyond Dashboards: The Modern BI Landscape
Evaluating BI tools today is about so much more than just making pretty charts. The real key is to grasp the core philosophy behind each platform and see how it lines up with what you're trying to achieve. Some tools, for instance, are built for data analysts to meticulously craft polished, static reports. Others are all about empowering non-technical users to find answers for themselves.
A solid comparison means digging into the trade-offs between deep functionality and genuine ease of use. Your choice really hinges on your main goal:
Internal Reporting: Getting teams like finance and operations on the same page with standardized data.
Self-Service Analytics: Letting business users ask their own questions without having to file a ticket with the data team.
Embedded Analytics: Weaving dashboards and analytics directly into your customer-facing product.
The question has shifted from "What can this tool do?" to "Who is this for, and how will it actually change their day-to-day work?" Figuring that out is the first step toward a tool that doesn’t just show you data, but changes how you use it.
Comparing BI Tools by User Persona
A great way to approach any BI tools comparison is to see the platforms through the eyes of the people who will actually use them. What a finance team needs is worlds away from what a product manager or a startup founder requires. Think about how these groups work with data now, and more importantly, how you want them to work with it in the future.
This table helps frame that initial decision by matching common user needs with the right kind of BI tool.
User Persona | Primary Need | Tool Archetype to Consider |
|---|---|---|
Data Analyst | Complex visualizations, deep data modeling | Legacy BI (e.g., Tableau, Power BI) |
Product Manager | Customer-facing dashboards, seamless integration | |
Business User | Quick answers, ad-hoc queries, no code required | AI-Native BI (e.g., Querio, ThoughtSpot) |
This highlights the main takeaway: the best BI tool is the one that truly serves its audience, closing the gap between complex data and clear, actionable insights.
Essential Criteria for Your BI Tools Comparison

A proper BI tools comparison has to go deeper than a simple feature checklist. To find the right fit, you need to evaluate how a platform will actually perform under pressure, grow with your company, and empower your entire team. This means taking a structured approach and scoring each tool against the same practical criteria.
Instead of getting sidetracked by marketing fluff, focus your evaluation on these six key areas. Each one is a critical piece of the puzzle, covering everything from the initial setup and data connection to long-term user adoption and security.
Data Connectivity and Integration
Let's be honest: a BI tool is useless if it can't get to your data. The first thing to check is how easily a platform connects to your existing data stack. Does it seamlessly plug into your primary warehouse, like Snowflake or BigQuery, as well as third-party SaaS apps and even basic CSV uploads?
Look for native connectors. They make the setup process much smoother and ensure better performance down the line. A tool that forces you to build complex workarounds or rely on third-party middleware just to access your own data will create constant headaches for your technical team and slow everyone down.
User Experience and Accessibility
The whole point of a BI platform is for people to actually use it. If the tool is too clunky or complicated for your business users, it will never achieve widespread adoption and its value will plummet. You need to assess the experience for everyone, from your data analysts to your sales team.
For Analysts: Is the data modeling and query interface powerful enough for their needs? Does it feel familiar and fit naturally into their existing workflows?
For Business Users: Is there a genuine no-code, self-service experience? How intuitive is it for someone to ask a question, apply a filter, or drill down into a report without writing a single line of SQL?
The learning curve is a deal-breaker. A platform that takes weeks of training just to run a basic report will never gain traction. A modern tool should feel intuitive enough for a new user to find their first meaningful insight in minutes, not days.
AI-Powered Analytics
AI is no longer a futuristic add-on; it's a core function of modern BI. The market's shift to AI-driven, cloud-based tools is clear, with projections showing the industry hitting $72.21 billion by 2034. By 2025, AI-augmented features are expected to drive 40% of new BI purchases, which tells you everything you need to know about the demand for smarter analytics.
When you're evaluating AI capabilities, look past the buzzwords. Test the maturity of its natural language query (NLQ) engine. Can it actually understand complex questions with multiple parts, or does it just handle basic keyword searches? A truly intelligent system learns the nuances of your data model to provide answers you can actually trust. You can learn more by exploring the 10 essential features of modern business intelligence tools.
Embedded Analytics Capabilities
For many product teams, the goal isn't just about internal dashboards. It's about embedding analytics directly into their own applications for customers to use. If that's one of your primary needs, your evaluation should zero in on the developer experience.
How easy is it to integrate charts and dashboards? Look for a robust SDK, clear and thorough documentation, and flexible white-labeling options. The platform also has to support critical security features like multi-tenancy and row-level security to guarantee your customers only ever see their own data.
Security and Governance
Trust is everything when it comes to data. Any serious BI tools comparison has to include a tough look at each vendor's security and governance features. Things like SOC 2 Type II compliance are non-negotiable—it’s the baseline for proving a commitment to enterprise-grade security.
Beyond that, you need to confirm that the tool gives you granular control over who sees what. Can you manage permissions at the user, group, and even the individual data-row level? This is essential for protecting sensitive information and ensuring you stay compliant.
Scalability and Performance
Finally, you have to think about the future. How will the platform hold up when your data volumes multiply and your user base doubles? A tool that feels zippy with a small team and a few gigabytes of data can easily grind to a halt under enterprise-level stress.
The tool's architecture is the key. Does it push queries down to your data warehouse, taking advantage of its immense processing power? Or does it try to pull everything into its own in-memory engine? Cloud-native platforms are generally built for this kind of scale, ensuring a consistently fast experience for all users, no matter how complex the query gets.
Analyzing the Top BI Tool Contenders
Now that we have our evaluation framework, it’s time to put the market's leading platforms under the microscope. We're going beyond the typical feature lists to give you a real-world, head-to-head analysis of how these tools actually perform. We’ll look at established giants like Microsoft Power BI and Tableau and see how they stack up against a modern, AI-native challenger like Querio.
The point here isn’t to crown a single "winner." Instead, I want to show you exactly where each tool shines and where it falls short. Understanding these trade-offs is what will help you match a platform’s strengths to your team’s unique needs, whether you're focused on enterprise-wide reporting, empowering non-technical users, or embedding analytics directly into your own product.
Microsoft Power BI: The Ubiquitous Market Leader
It's impossible to talk about BI without talking about Microsoft Power BI. Its deep roots in the Microsoft ecosystem—think Office 365, Azure, and Teams—make it the go-to choice for companies already living in that world. This isn't just a coincidence; it's a strategic advantage that has cemented its top-dog status.
In the BI space, Power BI is the clear market leader, holding over 30% market share as of 2021. That's a huge lead over rivals like Tableau, which sits at around 17%. These numbers aren't just abstract; they translate to over 204,512 installs serving 215,856 companies globally. With the BI market projected to hit $72.21 billion by 2034, picking the right tool is a big decision that balances a legacy giant’s breadth against the accessibility of newer platforms. You can discover more insights about these BI statistics here.
Key Differentiator: Power BI's secret weapon is its familiarity. For anyone who's spent years working in Excel, its Power Query feature feels like coming home. This makes the transition incredibly smooth for finance and operations teams who live and breathe spreadsheets.
For standard enterprise reporting, Power BI is a workhorse. It lets data teams build solid, governed data models that act as the single source of truth for the whole company. The catch? This power comes with a steep learning curve. True self-service often remains out of reach for business users, who end up relying on analysts to build and tweak their reports.
Tableau: The Visualization Powerhouse
For years, Tableau has been the gold standard for best-in-class data visualization. It gives users the power to create beautiful, interactive dashboards that can uncover trends you’d absolutely miss in a standard bar chart or table. Its drag-and-drop interface is remarkably intuitive for building visuals, making it a long-time favorite among data analysts and anyone trying to tell a compelling story with data.
But that power has its own set of requirements. To really fly, Tableau needs a well-structured and optimized data warehouse, especially when you're dealing with massive datasets. Without that solid foundation, performance can really lag. And while its embedded analytics options work, they can feel a bit bolted-on and aren't always the most developer-friendly compared to platforms built for embedding from day one.
Querio: The AI-Native Challenger
Querio is part of a new breed of BI tools built from the ground up with AI and developers in mind. It was designed to tackle two of the biggest headaches with traditional BI: the bottleneck of waiting for an analyst to build a report and the technical nightmare of embedding analytics into your own application.
Unlike older tools that have been adding AI features as an afterthought, Querio’s entire experience revolves around a conversational interface. This means a non-technical user can ask a complex question in plain English—like, “What was our monthly recurring revenue by customer segment for the last six months, excluding churned accounts?”—and get an accurate answer and visualization instantly.
Key Differentiator: Querio's AI agents are more than just a Natural Language Query (NLQ) search bar. They build a deep, contextual understanding of your specific business logic, ensuring the answers you get are not just grammatically correct but actually mean something in the context of your business.
This AI-first approach completely changes how people access data. A product manager or marketing lead no longer has to file a ticket and wait. They can just ask their question and get an answer, creating a culture of genuine self-service analytics.
Feature Comparison of Leading BI Tools
This table offers a side-by-side comparison of top BI platforms across key evaluation criteria, helping you quickly identify the best fit for your needs.
Feature/Criterion | Power BI | Tableau | Querio |
|---|---|---|---|
Best For | Enterprise reporting, companies invested in the Microsoft stack. | Data storytelling, creating high-impact visual dashboards. | Self-service analytics for non-technical users, embedded analytics. |
User Experience | Familiar for Excel users, but can be complex for others. | Intuitive drag-and-drop for visualization, less so for data prep. | Conversational (ask questions in plain English). Radically simple. |
AI/NL Capabilities | "Q&A" feature. Works best with perfectly modeled data. | "Ask Data" feature. An add-on to the core workflow. | Core experience. AI agents learn business logic for accurate answers. |
Embedding | Power BI Embedded (Azure service). Requires developer effort. | JavaScript API. Powerful but requires significant custom code. | Developer-first SDK, themeable components, and secure embeds. |
Learning Curve | High for advanced modeling (DAX). | Low for visualization, high for data prep and performance tuning. | Minimal for business users; setup requires initial data modeling. |
This at-a-glance view makes the trade-offs clear. While Power BI and Tableau are powerful in their respective domains, Querio is built for a different, more modern set of priorities focused on speed and accessibility for everyone.
Head-to-Head: The Critical Evaluation Criteria
Let’s dig a bit deeper into how these three tools stack up on the criteria that really matter in day-to-day use.
AI and Natural Language Capabilities
Power BI: Its Q&A feature lets users ask questions, but its effectiveness is highly dependent on a clean, well-structured data model. It can stumble over ambiguity or complex, multi-part questions.
Tableau: The "Ask Data" feature is similar. It's a useful tool for exploring an existing data source but feels more like an add-on than the central way of interacting with your data.
Querio: This is Querio’s home turf. The platform is built around conversational AI. Its agents learn your business logic, understand follow-up questions, and generate complex queries on the fly. It's like having an automated data analyst available to every single user.
Embedded Analytics Experience
When looking at BI tools, it's crucial to see how well they handle embedding specialized financial insights dashboards that have to feel native to your application.
Power BI: This is handled through Power BI Embedded, an Azure service that demands significant developer effort and Azure-specific know-how to implement securely, especially at scale.
Tableau: Offers embedding via its JavaScript API. It’s a powerful tool, but achieving a truly seamless, white-labeled user experience often requires a ton of custom development work.
Querio: Was built with a developer-first approach. It offers a modern SDK, themeable components, and signed embeds for secure multi-tenant deployments right out of the box, making the whole process faster and simpler for product teams.
User Experience for Non-Technical Teams
Power BI: For business users who aren't Excel power users, the interface can be intimidating. True self-service usually means just clicking on filters in dashboards that someone else built.
Tableau: While it produces beautiful dashboards, the creation process is almost always handled by trained analysts. For a typical business user, the experience is about consuming data, not exploring it.
Querio: The main interface is a simple search bar. This dramatically lowers the barrier to entry, empowering anyone on the team to go beyond canned reports and freely ask their own ad-hoc questions. You can find more details in our complete guide to the top business intelligence tools.
Ultimately, the best choice really does depend on your priorities. If you’re deeply integrated with Microsoft and need traditional, large-scale reporting, Power BI is a formidable option. If your goal is stunning data visualization driven by a dedicated analyst team, Tableau is still a leader. But if you're prioritizing speed, genuine self-service for everyone, and seamless embedded analytics, an AI-native platform like Querio offers a compelling modern path forward.
Matching the Right BI Tool to Your Business Case
Moving from a list of features to a final decision is always the trickiest part of a BI tools comparison. The "best" tool isn't the one with the longest feature list; it's the one that actually solves your team's specific problems. The key is to connect the strengths of each platform to the people who will use it every day.
Ultimately, your choice boils down to your company's stage and what you're trying to achieve right now. A lean startup's needs are worlds apart from a large enterprise finance team's. And a product team building analytics into their app faces a completely different set of technical challenges. Let's break down how to match a tool's capabilities to your immediate needs so you get value from day one.
This decision tree helps visualize the key decision points, whether you're starting with a need for AI-native capabilities, integrating with legacy systems, or embedding analytics into your own app.
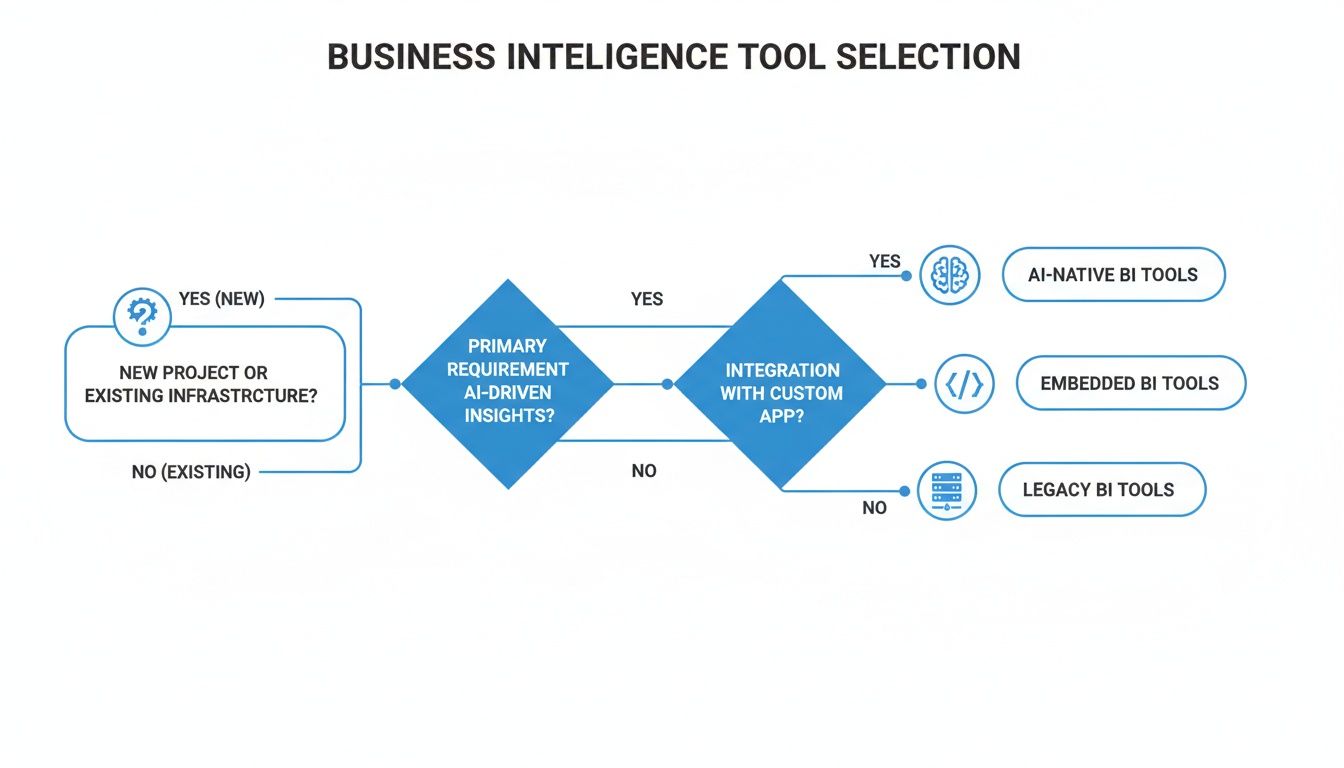
It maps out a logical flow, showing how different priorities will naturally lead you toward a specific kind of BI solution.
For Startups and Scale-Ups
For any early-stage company, time and focus are your most precious resources. You likely don’t have a dedicated data team on standby, and every decision has to happen fast. The right BI tool for this environment is all about speed, affordability, and true self-service for everyone—not just the one person who knows SQL.
The goal is simple: empower a small, cross-functional team to get answers without hitting a technical wall. Any platform that demands complex data modeling or a deep understanding of query languages just gets in the way. What you really need is something with a conversational AI and a dead-simple interface.
For a startup, the right BI tool acts as a force multiplier. It democratizes data, allowing a product manager, marketer, or founder to ask, "What was our customer acquisition cost last month by channel?" and get an answer in seconds, not days.
This is exactly what modern, AI-native tools like Querio were built for. They plug directly into your data warehouse and let non-technical users ask questions in plain English. This completely removes the bottleneck of relying on a single data expert and builds a culture where curiosity is rewarded instantly. If you're wondering where to start, you can learn more about how to choose the right data analytics tools for your business in our detailed guide.
For Product Teams
When a product team starts looking at BI tools, their focus shifts entirely to embedded analytics. Here, the objective is to ship data insights directly to your customers as a feature within your own application. Suddenly, the developer experience becomes one of the most important things to evaluate.
Your comparison should zero in on a few critical technical points:
Ease of Integration: How easy is it to actually embed the charts? Are you working with a clean SDK or a clunky, old-school iFrame?
White-Labeling Flexibility: Can you make the analytics look and feel like a natural part of your product, or will they stick out like a sore thumb?
Security and Multi-Tenancy: Does the tool have battle-tested, out-of-the-box support for things like row-level security and signed embeds? You need to be 100% sure customers can only see their own data.
A platform like Querio, designed from the ground up for embedding, gives developers a toolkit that makes this whole process much simpler. It helps product teams get customer-facing analytics out the door faster without ever having to compromise on security or the user experience.
For Enterprise Data and Finance Teams
In larger organizations, especially for data and finance departments, the main goal is to establish a single source of truth. The BI tool has to support robust governance, standardized reporting, and the automation of all those manual workflows that are probably living in spreadsheets right now.
Here, the evaluation checklist gets longer. You're looking for powerful data modeling, fine-grained access controls, and the ability to chew through massive, complex datasets without breaking a sweat. These teams need a platform that can enforce business logic centrally, ensuring that when someone pulls a "revenue" metric, it means the exact same thing across every single department.
While legacy tools have traditionally dominated this space, modern platforms are finally offering the same level of governance but with a much more intuitive user experience. They're closing the gap between powerful control and broad, company-wide usability.
When to Choose an AI Native Platform Like Querio
Making the final call in a BI tools comparison often boils down to a single, fundamental question. Are you looking for a tool that helps analysts build better reports, or do you need a platform that completely changes how your entire team interacts with data?
Choosing an AI-native platform like Querio means prioritizing speed, true self-service, and seamless product integration over the old-school, analyst-driven reporting model. This isn't just about comparing features; it's about aligning the tool with your company's core goals. If your main objective is to let non-technical people ask complex business questions in plain English, an AI-native solution is the way to go. It’s for teams that can't afford to have critical insights stuck in a data team's backlog.
Empowering Non-Technical Users with Natural Language
The biggest win with an AI-native platform is that it truly opens up data access for everyone. Traditional BI tools usually force users to learn a specific interface or rely on pre-built dashboards with rigid filters. Querio, on the other hand, puts a powerful, conversational experience front and center.
Imagine a marketing manager simply asking, “Which channels had the highest customer lifetime value last quarter?” and getting an accurate chart instantly. The platform's AI agents build a deep, contextual understanding of your specific business data, making sure the answers are reliable and make sense for your operations.
This isn't just a search bar slapped on top of a dashboard. It's a fundamental shift that collapses complex analytical steps, turning anyone's curiosity into a direct path to insight—no technical skills required.
A Developer-First Approach to Embedded Analytics
Another clear signal to choose Querio is when your product roadmap involves embedded analytics. If your plan is to serve up data insights directly within your own app for your customers, the developer experience has to be a top concern. Many legacy tools treat embedding as an afterthought, leading to clunky iFrames or complex API workarounds that feel disconnected from your product.
Querio was built from the ground up with developers in mind. It offers a secure, themeable, and easy-to-implement solution from day one. This includes:
A Modern SDK: Built to make integration quick and painless for your engineering team.
Themeable Components: You can ensure every embedded chart and dashboard perfectly matches your product's look and feel.
Enterprise-Grade Security: With SOC 2 Type II compliance and a read-only architecture out of the box, you get the robust security you need for customer-facing analytics without the headache.
When Security and Trust are Non-Negotiable
Finally, a platform like Querio is the obvious choice when security and reliable governance are table stakes. Its read-only architecture means it never writes back to your database, which immediately minimizes risk. This focus on security is a core part of the platform, not an optional add-on.
When you're looking at the next wave of business intelligence, it’s useful to see how other game-changing AI sales tools are approaching security and how that thinking aligns with AI-native platforms. You can get a much deeper look into this by reading our guide on how to evaluate AI-native vs. AI-enhanced BI platforms.
Ultimately, you choose Querio when your goal is to build a data culture based on speed, trust, and genuine accessibility for every single person on your team.
Common Questions We Hear About Choosing a BI Tool
Even after a detailed BI tools comparison, you're probably still wrestling with a few practical questions. It's totally normal. Moving beyond a feature-for-feature checklist and thinking about the real-world impact—migration, setup time, and long-term fit—is what separates a good decision from a great one. Let's tackle some of the most common questions we hear.
Getting these final details right ensures you're not just picking new software, but investing in a true partner for your data strategy.
What’s the Best Way to Migrate From Our Current BI Tool?
Switching from one BI tool to another is less of a technical project and more of a change management exercise. You're not just moving data; you're changing habits and workflows. The smoothest migrations we've seen always focus on three key things.
First, get your priorities straight. Pinpoint the handful of reports and dashboards that your teams genuinely rely on every single day. Don't try to boil the ocean by recreating every single thing from day one. Instead, rebuild those high-impact assets in the new tool first. This gives people immediate value and builds momentum.
Next, double down on user training and adoption. Run workshops designed for different teams. Your analysts will need a deep dive into data modeling, but your business users just need a quick-start guide on asking questions and finding what they need. Your goal should be to make everyone feel confident and capable right out of the gate.
How Long Does a Typical BI Implementation Take?
This one really depends on the architecture of the tool you choose. The timeline can vary wildly. Old-school, on-premise systems can easily take months to get up and running, bogged down by server configurations and a ton of IT overhead.
Thankfully, modern cloud-native tools have completely changed the game here. Platforms like Querio can connect to your data warehouse and start pulling insights in a matter of hours, not weeks. The whole setup process is built for speed, letting you skip the long infrastructure projects and get right to the good part: actually analyzing your data. This quick time-to-value is a massive win for teams that need to move fast.
The key difference is philosophy. Legacy tools require you to build the house before you can live in it. Modern tools let you start cooking as soon as you plug in the appliances.
How Does AI-Powered Natural Language Query Actually Work?
AI-powered Natural Language Query (NLQ) is a lot more sophisticated than a simple search bar. The best systems don't just crudely translate your words into a SQL query; they build a genuine, contextual understanding of your business. This happens by training the AI model on your specific data schema and business logic.
For instance, the AI learns that when you say "revenue," you mean a very specific calculation in your database. It learns that your company's definition of an "active user" is tied to a particular set of actions. It essentially maps your internal company vocabulary to the columns and tables in your data warehouse. This is precisely why AI-native tools give much more accurate and relevant answers—they've been taught to think like someone who actually works at your company.
Should We Prioritize Powerful Visualizations or Ease of Use?
This is the classic dilemma, but modern tools are making it less of a trade-off. The right balance really comes down to who you're building for. If your primary goal is to empower a small team of expert analysts to craft pixel-perfect dashboards for the C-suite, then a visualization powerhouse might be the way to go.
But if your goal is to build a culture where 80% of your company can get their own answers from data, then ease of use is everything. A platform that a product manager, a marketer, and a support lead can all use to find what they need will always create more value than a complex tool that only a handful of specialists can operate.
Ready to see how an AI-native BI platform can empower your entire team? With Querio, you can go from complex questions to clear answers in seconds. Get started for free today.

