A Practical Guide to Data Model in Data Warehouse Design
Discover the essential data model in data warehouse techniques. Compare star, snowflake, and data vault models to build a powerful analytics foundation.
https://www.youtube.com/watch?v=8FZZivIfJVo
published
Outrank AI
data model in data warehouse, star schema, data vault model, dimensional modeling, data warehouse design
b5c17853-2882-45e5-a784-8cb310a57624

Think of a data model in a data warehouse as the architectural blueprint for your company's data. It’s the master plan that dictates how all your information is organized, stored, and connected. Essentially, it takes raw, messy data from all your different business systems and whips it into a logical, understandable structure that’s ready for analysis.
This structure is the bedrock of all your business intelligence and reporting efforts.
The Blueprint for Your Business Data
Before a single brick is laid, an architect drafts a detailed blueprint. This plan makes sure every room, window, and doorway is exactly where it needs to be, so the final building is both functional and stable. A data model does the exact same thing for a data warehouse, providing a clear map of how every piece of data connects.
Without a well-thought-out data model, your warehouse isn't a warehouse at all—it’s just a data swamp. It becomes a chaotic mess of disconnected tables.
Imagine trying to answer a seemingly simple question like, "What was our customer lifetime value by marketing channel last quarter?" In a data swamp, that’s a nightmare. Your analysts would burn hours, maybe even days, just trying to piece together the right tables and pray the results are accurate.
Why Is a Data Model So Important?
A solid data model in a data warehouse isn't just a technical nice-to-have; it's a strategic business asset. It creates a common language that both the tech teams building the warehouse and the business users consuming the data can understand. This alignment is crucial for making sure your reports and dashboards actually reflect what’s happening in the business.
Here's what a good data model really delivers:
Improved Query Performance: Models are designed for analysis, not for transactions. This fundamental difference means complex queries run dramatically faster.
Enhanced Data Consistency: It creates a single source of truth. This ensures that key metrics, like "monthly recurring revenue," are calculated the exact same way across every single department. No more arguments in meetings about whose numbers are right.
Greater Scalability: A forward-thinking model is built for the future. It makes it much easier to plug in new data sources or add new business units without having to tear everything down and start over.
Empowered Self-Service Analytics: It provides an intuitive layout that allows non-technical users to explore data and find their own answers. This is a massive step toward building a truly data-driven culture.
A data model translates complex business processes into a simplified structure that both humans and computers can understand. It’s the bridge between raw operational data and actionable business intelligence.
At the end of the day, investing time upfront in a robust data model is the single most important step in building a reliable data warehouse. It's what separates a system that delivers fast, trustworthy insights from one that just creates confusion and endless rework. It lays the foundation for everything else, from your data pipelines all the way up to your executive dashboards.
Comparing Foundational Data Modeling Techniques
Choosing a data model for your warehouse isn't a one-and-done decision; it's a foundational choice that will echo through your analytics for years to come. The right blueprint depends entirely on what you're trying to build. Let's walk through the three dominant strategies, each with its own philosophy on how to best organize data for insight.
We’ll look at dimensional modeling, which includes the well-known Star Schema and its cousin, the Snowflake Schema, and then contrast those with the highly adaptable Data Vault model. Each one strikes a different balance between query speed, flexibility, and complexity.

The Star Schema: Built for Speed
The Star Schema is the workhorse of the data warehousing world, and for good reason—it’s built for raw speed and clarity. Think of it as an optimized subway map designed to get you from point A to point B as quickly as possible.
At the very center of this "map" is a single fact table. This table is all about the numbers—the core business events you want to measure, like SalesAmount or OrderQuantity. Radiating out from this hub are several dimension tables that provide the "who, what, where, and when" context for those numbers, such as Customer, Product, and Date.
The beauty is in its simplicity. Each dimension connects directly to the fact table through a single, clean join. This design intentionally duplicates some data (it's "denormalized") to minimize the number of joins a query has to perform, which makes reporting and analytics incredibly fast. For most business intelligence needs, this is the gold standard.
The Snowflake Schema: Trading Speed for Purity
Now, imagine taking that simple subway map and adding smaller, branching lines for more detail. That’s the Snowflake Schema. It's a variation of the Star Schema that takes the dimension tables and normalizes them further.
For instance, a Product dimension might be broken apart into Product, ProductSubcategory, and ProductCategory tables, creating a "snowflake" shape as the dimensions branch out.
This approach brings two key advantages:
Less Data Redundancy: Storing product categories separately means you aren't repeating that information in every product row, which saves a bit of storage space.
Simpler Maintenance: If you need to rename a category, you only have to change it in one spot.
The trade-off? Performance. To get a complete picture, queries now have to perform more complex joins to stitch all the pieces back together, which can be noticeably slower than a Star Schema. It’s a classic battle between organizational tidiness and raw query speed. To explore these trade-offs further, our guide on data modeling best practices provides a deeper look.
The Data Vault: Built for Flexibility and Auditability
The Data Vault is a different beast altogether. If dimensional models are subway maps built for quick analysis, the Data Vault is a complete historical archive designed to capture every single change from your source systems over time. It’s engineered to absorb data from dozens of disparate sources without needing a massive cleanup effort upfront.
The Data Vault model is built on three core components:
Hubs: These store your unique business keys, like
CustomerIDorProductSKU. They represent the core business entities.Links: These tables define the relationships between the Hubs, capturing how different business entities interact.
Satellites: These contain all the descriptive attributes and, crucially, track how that data changes over time.
This highly normalized structure makes it perfect for enterprise-level warehouses that need an auditable, resilient, and scalable foundation. The raw data is preserved as it arrived, giving you a perfect historical record. From this stable core, you can then spin off specialized, performance-tuned data marts (often using Star Schemas) for your analysts.
The Data Vault prioritizes data integration and historical accuracy at the raw level, while Dimensional Models prioritize query performance and business usability at the consumption layer.
Comparison of Data Modeling Techniques
To help you decide, this table provides a side-by-side comparison of the key data warehouse modeling approaches based on their primary characteristics and ideal use cases.
Technique | Primary Goal | Query Performance | Data Redundancy | Flexibility | Best For |
|---|---|---|---|---|---|
Star Schema | Simplicity & Fast Queries | Very High | High | Moderate | Departmental data marts, BI reporting, and self-service analytics. |
Snowflake Schema | Reduce Data Redundancy | High | Low | Moderate | Complex dimension hierarchies where storage savings are a priority. |
Data Vault | Auditability & Integration | Low (Raw Layer) | Low | Very High | Enterprise data warehouses with many sources and complex integration needs. |
This comparison highlights the fundamental trade-offs you'll face when choosing a model for your data warehouse.
Making the Right Choice
Ultimately, the best data model is the one that aligns with your specific goals. For the vast majority of analytics use cases, the Star Schema remains king due to its unbeatable combination of simplicity and performance. It’s no surprise that 75% of Fortune 500 firms rely on dimensional modeling in their cloud data warehouses.
A well-designed Star Schema can boost query performance by a staggering 10-100x compared to an unoptimized, transactional structure—a critical edge when you're working with terabytes of data. This approach, pioneered by Ralph Kimball, is more relevant than ever in modern lakehouse architectures. Even giants like Uber, managing over 350 petabytes of data, rely on optimized dimensional models to power their analytics.
Here's a quick cheat sheet to guide your decision:
Star Schema: Your go-to for high-speed reporting and analytics where performance is everything.
Snowflake Schema: Consider it when you have very large, complex dimension tables and data redundancy is a real problem.
Data Vault: The best choice when you're integrating numerous source systems, need a complete audit trail, and want a flexible foundation for the long haul.
How to Design Your Data Warehouse Model
So, we've talked theory. Now let's get our hands dirty. Moving from concepts to a real, working data warehouse model isn't about some secret technical voodoo; it's a structured process that turns business questions into a query-ready schema. It's a craft, and like any craft, it follows a clear set of steps.
We can break this entire process down into four distinct stages that build on one another. To make it real, we’ll follow along with a practical example: a SaaS company that wants to dig into its user subscription data. Their goal is to build a model that can finally give them clear answers on monthly recurring revenue (MRR), customer churn, and plan upgrades.
Stage 1: Gather Business Requirements
Before you even think about writing a line of SQL, you have to figure out what the business actually needs to know. This is, without a doubt, the most important step. A technically perfect model built on the wrong assumptions is completely worthless. The mission here is to pin down the core business processes and the key performance indicators (KPIs) that actually matter to the people running the show.
This means getting up from your desk and talking to people in sales, marketing, product, and finance. You're basically a detective hunting for clues.
Ask questions like:
What numbers do you live and die by every day, week, or month? (e.g., "We have to see new MRR and our churn rate.")
How do you define an "active user"? What about a "customer"? (You'd be shocked how much these definitions can vary between teams.)
How do you need to slice the data? (e.g., "by marketing channel," "by customer segment," "by subscription plan.")
For our SaaS example, we'd walk away from this stage with a concrete list of metrics (MRR, new subscriptions, cancellations) and the ways they want to analyze them, which are our dimensions (customer, subscription plan, time, marketing channel).
Stage 2: Create a Conceptual Model
With your business requirements in hand, it's time to sketch out a high-level conceptual model. This is your chance to whiteboard the big picture without getting bogged down in the weeds of data types or primary keys. Think of it as the rough architectural sketch you draw on a napkin before creating the detailed blueprint.
Your goal here is simple: identify the main business "things"—the entities—and how they relate to each other. For our SaaS company, the obvious entities are Customers, Subscriptions, and Plans.
You’d draw these out and connect the dots, showing that a Customer can have many Subscriptions over their lifetime, and each Subscription is tied to a specific Plan. This visual map is a fantastic way to confirm you’re on the right track with business stakeholders. It makes sure everyone is on the same page about how the business actually works.
The conceptual model is a communication tool. It validates that your technical plan aligns perfectly with the business's reality, preventing costly rework later in the process.
Stage 3: Develop the Logical Model
Okay, now we get a bit more formal. The logical model is where you translate that conceptual sketch into the specific tables, columns, and relationships that will become your dimensional model. This is where you decide what goes into your fact tables (the numbers) and what goes into your dimension tables (the context).
Let's use the Star Schema approach for our SaaS example:
Fact Table (
fact_subscriptions): This is the heart of our model, holding the numeric, measurable events. It would include columns likemrr_amount,subscription_id,customer_key,plan_key, anddate_key.Dimension Tables: These tables provide all the descriptive "who, what, where, when" context.
dim_customer: Contains all the details about customers, likename,signup_date, andsegment.dim_plan: Includes plan specifics likeplan_name,price, andbilling_cycle.dim_date: A standard calendar dimension that makes time-based analysis a breeze.
In this stage, you also define the primary and foreign keys that stitch the fact and dimension tables together. For a deeper dive, our guide on how to build a data model from scratch walks through this critical phase step-by-step.
Stage 4: Implement the Physical Model
This is the final step, where the rubber meets the road. The logical model gets turned into a physical model inside your data warehouse, whether that’s Snowflake, BigQuery, or Databricks. It's time to write the actual CREATE TABLE statements in SQL that bring your schema to life.
Here, you’ll make platform-specific decisions on things like:
Data Types: Choosing the right type for each column (
VARCHAR,INT,TIMESTAMP, etc.).Constraints: Defining rules like
NOT NULLand setting up primary and foreign keys.Performance Tuning: Applying optimizations like indexing and partitioning based on how you expect people to query the data.
For instance, you'd write the SQL code to create the fact_subscriptions and dim_customer tables, carefully specifying each column's data type and maybe adding some comments to document their purpose. This last move transforms your well-designed blueprint into a real, functional data structure, ready to be filled with data and unleashed for analysis.
Key Principles for Designing a High-Performance Data Model
A great data model isn't just about getting the structure right—it has to be fast, scalable, and genuinely useful for the people who need to query it. Building a high-performance data model in a data warehouse is all about making smart, intentional design choices that strike a balance between analytical power and technical reality. Think of these principles as your blueprint for creating a model that’s not just functional, but truly transformative for the business.
This entire process, from idea to implementation, typically follows a clear path.
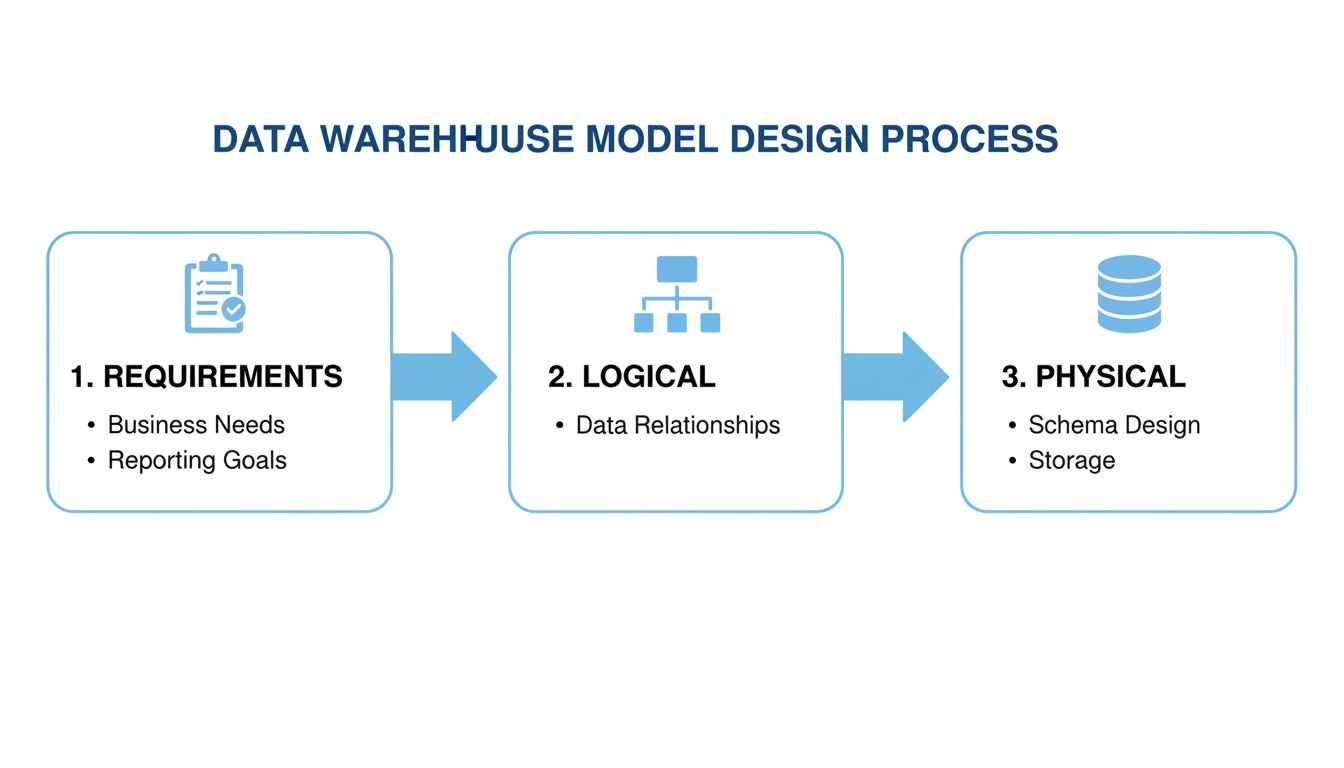
You start with what the business needs, sketch out a logical plan, and then build the physical database. Each step informs the next, making sure the final product is both technically solid and perfectly aligned with business goals.
Nailing Down the Granularity
One of the very first, and most critical, decisions you'll make is defining the grain of your fact table. The grain is a simple statement that declares exactly what a single row represents. Is it an individual line item on a receipt? A daily summary of sales for a single store? Or maybe a monthly snapshot of every user's activity?
This one choice has huge implications, as it sets the lowest possible level of detail for all your analysis. A fine grain, like tracking individual events, gives you incredible flexibility to explore the data, but it also means you'll be storing a massive amount of it. Go with a coarser grain, like daily rollups, and your warehouse will be leaner, but you lose the ability to dig into the nitty-gritty details. The trick is to pick the most atomic grain that still answers the core business questions.
The Unsung Hero: Surrogate Keys
Your source systems—like a CRM or an e-commerce platform—already have their own identifiers, like CustomerID or OrderNumber. It can be tempting to just use these "natural keys" in your data warehouse, but that's a classic mistake. What happens when business rules change, systems are migrated, or—worst of all—keys get reused? You end up with a data integrity nightmare.
This is where surrogate keys save the day. A surrogate key is a clean, unique integer that the data warehouse generates itself to act as the primary key for a dimension. They're not tied to any business meaning; they just exist to connect tables.
Why go to the trouble?
They're stable. Because they are completely independent, they insulate your warehouse from any chaos happening in the source systems.
They're fast. Joining tables on simple integers is dramatically faster than trying to join on long, clunky text-based keys.
They enable history tracking. They are the secret sauce behind managing slowly changing dimensions, which we’ll get into next.
Think of a surrogate key as a permanent, internal address for your data. It guarantees that no matter what changes in the operational systems, the history inside your warehouse remains consistent, reliable, and trustworthy.
Taming Time with Slowly Changing Dimensions
Let's face it, business data is rarely static. Customers move to new cities, products get a rebrand, and sales territories are redrawn. A Slowly Changing Dimension (SCD) is a technique for managing and tracking these historical changes in your dimension tables. Without it, you’d lose crucial context and your historical reporting would be flat-out wrong.
For example, if a customer upgrades their subscription from a "Basic" plan to "Pro," just overwriting the old value with the new one is a disaster for reporting. Suddenly, you can't accurately analyze how much revenue you made from the "Basic" plan last quarter. This is a common problem that requires a real strategy, and getting it right is essential for anyone interested in optimizing a query that looks back in time.
There are a few ways to handle SCDs, but these three are the most common:
Type 1 (Overwrite): The no-frills approach. You simply replace the old value with the new one. It's fine for fixing typos, but you lose all historical information.
Type 2 (Add a New Row): This is the gold standard for most analytics. When an attribute changes, you create a brand-new row for that customer with a new surrogate key. The old row is kept but marked as "expired" using dates or a flag. This gives you a perfect, point-in-time view of history.
Type 3 (Add a New Column): A more limited approach where you add a column to track the previous state, like a "PreviousPlan" field. It's not as scalable as Type 2 but can be a quick fix for tracking a single prior value.
Leveraging Modern Tools for Data Modeling
While the foundational concepts of data modeling haven't gone anywhere—dimensional models are still king—the way we build them has been completely transformed. Building a data model in a data warehouse today is a far cry from the slow, rigid processes of the past. Modern cloud platforms and a new wave of open-source tools have made the entire workflow faster, more flexible, and massively scalable.
At the heart of this shift are cloud-native data warehouses like Snowflake, Google BigQuery, and Databricks. Their secret sauce is an architecture that separates storage from compute. This simple but brilliant design means you can affordably dump enormous amounts of data into storage and then spin up powerful processing engines only when you need them. For data modeling, this is a total game-changer.
The ELT Revolution and Data Modeling
One of the biggest ripples from this architectural shift has been the move from ETL (Extract, Transform, Load) to ELT (Extract, Load, Transform). The old way involved painstakingly cleaning and shaping data before loading it into an expensive, resource-strapped data warehouse. ELT flips that script entirely.
Now, we load raw, semi-structured data directly into the cloud warehouse first. The heavy lifting—all the transformations and modeling—happens right inside the warehouse using its hyper-powerful SQL engine. This approach has some serious advantages:
Speed and Flexibility: No more waiting for a perfect model. Raw data is available for analysts to explore almost immediately, and you can iterate on different modeling approaches without a major engineering effort.
Raw Data is Sacred: The original, untouched source data is always safe in the warehouse. This lets you rebuild models from scratch or spin up new ones for different use cases without ever having to go back to the source systems.
Using the Right Tool for the Job: Cloud warehouses are built for crunching petabytes of data. Running transformations inside them is vastly more efficient than trying to do it on a separate, underpowered server.
Managing Your Model as Code with dbt
The ELT workflow got a massive boost with the arrival of dbt (Data Build Tool). It has quickly become the gold standard for handling the "T" in ELT, enabling teams to build, test, and deploy data models with the same rigor as software engineers.
Instead of a chaotic mess of standalone SQL scripts, dbt lets you define your entire transformation pipeline as a single, modular project. You can manage dependencies between models, write automated data quality tests, and generate documentation all in one place.
With dbt, you start treating your data models like a software project—complete with version control, automated testing, and CI/CD pipelines. This elevates modeling from a one-off artistic endeavor into a repeatable and reliable engineering discipline.
This new "analytics engineering" mindset means your data model is no longer a fragile, mysterious black box. It becomes a transparent, well-documented, and thoroughly tested asset that can grow and change with the business. If you're new to this world, understanding all the pieces of the modern data stack shows how these tools create a cohesive ecosystem.
Warehouse Features That Boost Model Performance
Beyond the workflow itself, modern warehouses come packed with native features that work hand-in-glove with your data model to deliver blistering query speeds. Knowing how to use them is key to building a system that can handle real-world scale.
Here are three of the most important ones:
Columnar Storage: Unlike old-school row-based databases, cloud warehouses store data in columns. This is a massive win for analytics because a query only needs to read the specific columns it needs to answer a question, dramatically cutting down on the amount of data it has to scan.
Partitioning: This technique physically breaks a huge table into smaller chunks based on a specific column, most often a date. When a user queries for data from the last month, the warehouse intelligently scans only the relevant partitions and ignores everything else, making the query run exponentially faster.
Clustering (or Sorting Keys): Within each partition, clustering takes it a step further by physically sorting the data based on frequently filtered columns (like
customer_id). This co-locates related data, allowing the warehouse to skip over huge blocks of data it knows aren't relevant to your query.
When you pair a well-designed dimensional model with these powerful modern tools and warehouse optimizations, the result is an analytical engine that is not just robust and scalable, but also incredibly fast—perfect for powering the next wave of self-service BI and AI-driven applications.
Powering Self-Serve Analytics with a Solid Data Model

All the meticulous work of building a data model in a data warehouse comes down to one thing: giving your entire organization the keys to the data kingdom. This is the moment the blueprint pays off, fundamentally changing how your teams make decisions.
A well-designed dimensional model isn't just a technical achievement; it's the bedrock for high-performance self-serve analytics. Think of it as a business-friendly semantic layer that makes even the most complex data feel intuitive. This clarity is what makes modern BI tools sing.
From Business Questions to SQL Answers
Let's get practical. A product manager asks, "What was our MRR by customer segment last quarter?" Without a proper model, a data analyst has to dive into a sea of tables, manually join them, clean up the mess, and cross their fingers the logic holds. This could easily burn a few days.
With a star schema, that logic is already baked in. The relationships between revenue (in the fact table) and customer details (in the dimension table) are predefined and optimized for speed. This structure allows AI-powered tools like Querio to instantly convert that plain-English question into a perfect SQL query. The PM gets their answer in seconds.
That kind of speed and accessibility creates a ripple effect of value across the entire business.
A great data model bridges the gap between raw data and business language. It creates a self-service environment where curiosity is rewarded with immediate, trustworthy answers, eliminating the traditional bottleneck of data requests.
The Clear ROI of a Well-Designed Model
Spending time and effort on proper data modeling isn't just an IT expense; it's a strategic investment with a clear and measurable return. It's what turns a company from being "data-rich, insight-poor" into one that is genuinely data-driven.
The benefits pop up everywhere:
Reduced Data Backlogs: When product, finance, and operations can answer their own questions, your data team is freed from endless ad-hoc reports. They can finally tackle the complex, high-impact projects they were hired for.
Elimination of Spreadsheet Chaos: A good model provides a single source of truth, killing the dangerous practice of emailing conflicting spreadsheets. Suddenly, everyone is working from the same playbook with standardized metrics.
Accelerated Decision-Making: Teams that can explore data and validate ideas on the fly move faster. This agility leads to quicker product improvements, more effective marketing, and smarter operational tweaks.
In the end, a robust data model in a data warehouse is the engine that drives a culture of curiosity and evidence-based decisions.
Frequently Asked Questions
As you get your hands dirty with data modeling, a few common questions always seem to pop up. Let's tackle some of the big ones that often come up when you're designing a model for your data warehouse.
What's the Difference Between a Data Model and a Database Schema?
It's easy to get these two mixed up, but the distinction is crucial. Think of a data model as the architect's blueprint for a house. It’s a high-level plan that lays out what the business needs, defining key pieces of information and how they all relate. It shows you where the kitchen, living room, and bedrooms are and how they connect, but it doesn't specify the brand of the faucet.
The database schema is the actual, physical construction of that house. It's the implementation of your model in a real database, complete with tables, columns, specific data types (like VARCHAR or INT), and all the constraints. It's the tangible structure—the plumbing, the wiring, the two-by-fours—that brings the architect's vision to life.
How Often Should I Update My Data Warehouse Model?
Your data warehouse model isn't something you build once and forget. It's a living, breathing reflection of your business, and it needs to change when your business does.
You should plan to revisit and update your model whenever a meaningful business event happens. Did you launch a new product line? Expand into a new region? Change a core business process? All of these are signals that your model might need an update. Modern, agile approaches favor small, frequent iterations over massive, painful overhauls every few years. This keeps the model in sync with reality.
A data model is a reflection of the business. When the business changes, the model must change with it to remain relevant and trustworthy.
Can I Use a NoSQL Database for My Data Warehouse Model?
This is a great question, especially with all the different database technologies out there. While traditional data warehouses are almost always built on SQL-based relational systems—which are perfect for the structured queries that dimensional models excel at—the modern data stack often uses a mix-and-match approach.
You'll often see data lakes built on NoSQL or object storage (like Amazon S3) to handle the initial flood of raw, unstructured, and semi-structured data. From there, the data is transformed and loaded into a highly structured, columnar data warehouse like Snowflake or Google BigQuery for analytics. So, while NoSQL plays a huge role in the wider data ecosystem, the core analytical model that your business users query almost always ends up in a high-performance, SQL-based system.
Ready to empower your teams with self-serve analytics? Querio's AI-powered platform connects to your data model, allowing anyone to get answers from your data warehouse by simply asking questions in plain English. Turn your data model into a decision-making engine.

