Data Analytics in Real Estate The Ultimate Guide for 2026
Explore how data analytics in real estate is reshaping property investment. This guide covers key uses, essential data sources, and tools to master the market.
https://www.youtube.com/watch?v=9VF7DYk_Wug
published
Outrank AI
data analytics in real estate, real estate analytics, proptech trends, property investment, market analysis
75139d47-e759-4435-b84b-8cee6597e188

For generations, real estate deals were built on location, comparable sales, and a healthy dose of gut instinct. Success often came down to who you knew and what you could see with your own eyes. While that approach worked, it’s like navigating with a paper map in a world of GPS.
So, what exactly is data analytics in real estate? It’s the practice of taking enormous piles of property, market, and demographic data and turning them into clear, actionable intelligence. It gives investors and developers a systematic way to predict market trends, nail property valuations, and fine-tune their portfolios for better returns and less risk.
The New Blueprint for Property Investment

The old playbook is being rewritten. Today’s market is just too complex and fast-moving to rely on instinct alone. The new blueprint for success isn't just about having an edge; it's about having an evidence-based framework for every decision you make.
Data analytics is that framework. It’s about systematically digging into massive streams of information—everything from MLS listings and transaction histories to economic forecasts and even sensor data from smart buildings—to find the patterns and opportunities that everyone else misses.
Shifting from Instinct to Intelligence
This move from instinct to intelligence is a game-changer. Instead of just reacting to what the market does, you can start anticipating its next move.
Think about it. What if you could accurately forecast rent growth in a specific zip code six months from now? Or spot an undervalued multifamily property before it ever gets a "For Sale" sign? That's the power data analytics in real estate puts in your hands.
It helps answer the most critical questions with data, not just a hunch:
Which up-and-coming neighborhoods have the strongest vital signs for future growth?
What’s the perfect rent for this specific apartment to keep it occupied and profitable?
How can I rebalance my portfolio to weather a potential downturn while maximizing returns?
At its core, data analytics transforms raw information into a competitive advantage. It’s about making smarter, faster, and more profitable decisions by swapping guesswork for strategy.
Your Guide to Data-Driven Success
This guide is your roadmap to mastering real estate analytics. We’ll start with the basics and build up to advanced strategies you can use right away. You won't just learn the "what," you'll learn the "how"—how to apply data to make better investment choices, boost asset performance, and gain a real advantage in the 2026 real estate market and beyond.
A great starting point is getting familiar with the concepts behind business intelligence reporting. By the time you're done here, you’ll have a solid blueprint for building your own data-driven success story.
Where Data Analytics Delivers Real Value
Let's move past the theory. The true power of data analytics in real estate clicks into place when you see it solve real-world problems. This isn't about hoarding data; it’s about using it to tackle the high-stakes challenges that have defined this industry for decades. By applying the right analytical models, we can turn murky, complex questions into confident, profitable decisions.
Each application targets a critical business pain point, transforming raw information into a clear path forward. Whether you're pinpointing a property's value with surgical precision or getting ahead of market shifts, data provides the answers. Let's dig into the most impactful ways analytics is delivering tangible results on the ground.
Supercharging Property Valuation
One of the most immediate and profound impacts is on property valuation. We all know traditional appraisals have their place, but they can be slow, subjective, and limited by the number of "comps" a single person can realistically juggle.
This is where Automated Valuation Models (AVMs) come in, and they've completely changed the game. AVMs algorithmically process hundreds of variables in seconds, delivering near-instant estimates that far surpass what was once possible. Think about this: back in 2019, AVMs were used in just 20% of residential transactions in the U.S. By 2025, that figure is projected to hit 65%.
These aren't just simple calculators. Sophisticated AVMs pull in historical sales data, current market indicators, satellite imagery to assess property condition, local economic stats like unemployment rates, and even social media sentiment to predict values with up to 95% accuracy in stable markets. This speed and precision give investors a massive edge, letting them make competitive offers with real confidence.
Forecasting Market Trends
Playing guessing games with the market is a recipe for disaster. Predictive analytics replaces that guesswork with data-driven forecasting, essentially giving investors and developers a glimpse into what’s coming around the corner.
By analyzing leading economic indicators, demographic shifts, and historical market cycles, these models can flag emerging investment hotspots long before they hit the mainstream.
Spotting Growth Corridors: Predictive models can highlight suburban areas primed for a demand surge because of a new infrastructure project or a major corporate relocation.
Anticipating Rent Fluctuations: By tracking job growth, local wage trends, and the housing supply pipeline, analytics can forecast rental demand in specific submarkets.
Seeing Peaks and Troughs: Time-series analysis helps investors see the cyclical patterns in a market, pointing to better times to buy or sell.
The goal isn't to find a crystal ball that predicts the future with 100% certainty. It’s about understanding the probabilities. Data analytics gives you a powerful statistical edge, tilting the odds of success firmly in your favor.
The table below breaks down some of the most common challenges and how data analytics provides a concrete solution.
Key Use Cases of Data Analytics in Real Estate
Use Case | Business Challenge | Data-Driven Solution |
|---|---|---|
Property Valuation | Slow, subjective, and manual appraisal processes create delays and risk. | Automated Valuation Models (AVMs) analyze hundreds of data points for instant, highly accurate value estimates. |
Market Forecasting | Guessing future trends leads to missed opportunities and bad investments. | Predictive models analyze economic and demographic data to identify growth areas and market shifts. |
Portfolio Optimization | Balancing risk and return across a diverse asset portfolio is complex. | Simulation models determine the ideal asset mix to maximize returns while managing risk exposure. |
Site Selection | Choosing the wrong location can doom a project from the start. | Geospatial and demographic analysis identifies locations with the highest potential for success. |
Tenant Churn Prediction | High tenant turnover increases vacancy rates and operational costs. | Analyzing tenant behavior patterns to proactively identify and retain at-risk tenants. |
Lease Analytics | Inefficient lease abstraction and management lead to missed revenue. | NLP models extract key terms from lease documents to optimize renewals and identify revenue opportunities. |
These examples just scratch the surface, but they clearly show how analytics is moving from a "nice-to-have" to an essential tool for modern real estate operations.
Optimizing Investment Portfolios
For fund managers and large-scale investors, portfolio management is a constant tightrope walk between risk and reward. Data analytics provides the tools to find that optimal balance with incredible precision.
Portfolio optimization models run thousands of "what-if" scenarios to find the ideal asset mix. They help answer the tough questions:
How does adding a new industrial property in Phoenix affect my portfolio's overall risk profile?
Are we overexposed to the office sector in the Midwest?
Which underperforming assets should we sell to free up capital for higher-growth opportunities?
By putting a number on risk and modeling potential outcomes, investors can build portfolios that are far more resilient and profitable. A huge part of this involves conducting a thorough commercial real estate market analysis to spot these prime opportunities in the first place.
Enhancing Site Selection and Tenant Analysis
For any new development, whether commercial or residential, picking the right spot is everything. Data-driven site selection takes the classic "location, location, location" mantra to a whole new level. It's a deep dive into:
Demographic Data: Finding areas with your target income levels, age groups, and lifestyle preferences.
Foot Traffic Patterns: Using anonymized mobile data to map out locations with the best visibility and access for retail.
Competitive Landscape: Visualizing where competitors are to find underserved markets and avoid saturated ones.
But it doesn't stop there. Analytics is also a game-changer for understanding and keeping your tenants. By analyzing payment histories, maintenance requests, and communication logs, property managers can predict which tenants are at risk of leaving. This allows for proactive retention efforts—like offering a timely lease renewal incentive or finally fixing that recurring maintenance issue—which directly reduces vacancy and turnover costs. This focus on operational efficiency is a common thread across industries, as seen in many self-service analytics use cases.
Unpacking the Four Levels of Real Estate Analytics
To really get a handle on data analytics in real estate, it’s best to see it as a journey, not a single destination. Think of it as four distinct stages, where each level of insight builds on the one before it. We can use a simple analogy: a doctor figuring out how to treat a patient. They move from basic observations all the way to a concrete action plan.
This framework takes the mystery out of analytics, laying out a clear path from simple reporting to sophisticated, data-driven decision-making.
Level 1: Descriptive Analytics — What Happened?
The first and most common level is Descriptive Analytics. This is ground zero for any data strategy, and its job is simple: to answer the question, "What happened?" It's all about summarizing historical data to get a crystal-clear picture of past performance.
Sticking with our doctor analogy, this is like reviewing a patient's chart. In real estate, this looks like:
Pulling the average sale prices for a neighborhood over the last year.
Checking vacancy rates across your portfolio from the previous quarter.
Calculating the average number of days a property sat on the market last month.
Descriptive analytics gives you that essential baseline. It takes raw numbers and organizes them into reports, charts, and dashboards, offering a solid rearview-mirror perspective of your business.
This flowchart shows how analytics feeds into core real estate activities.
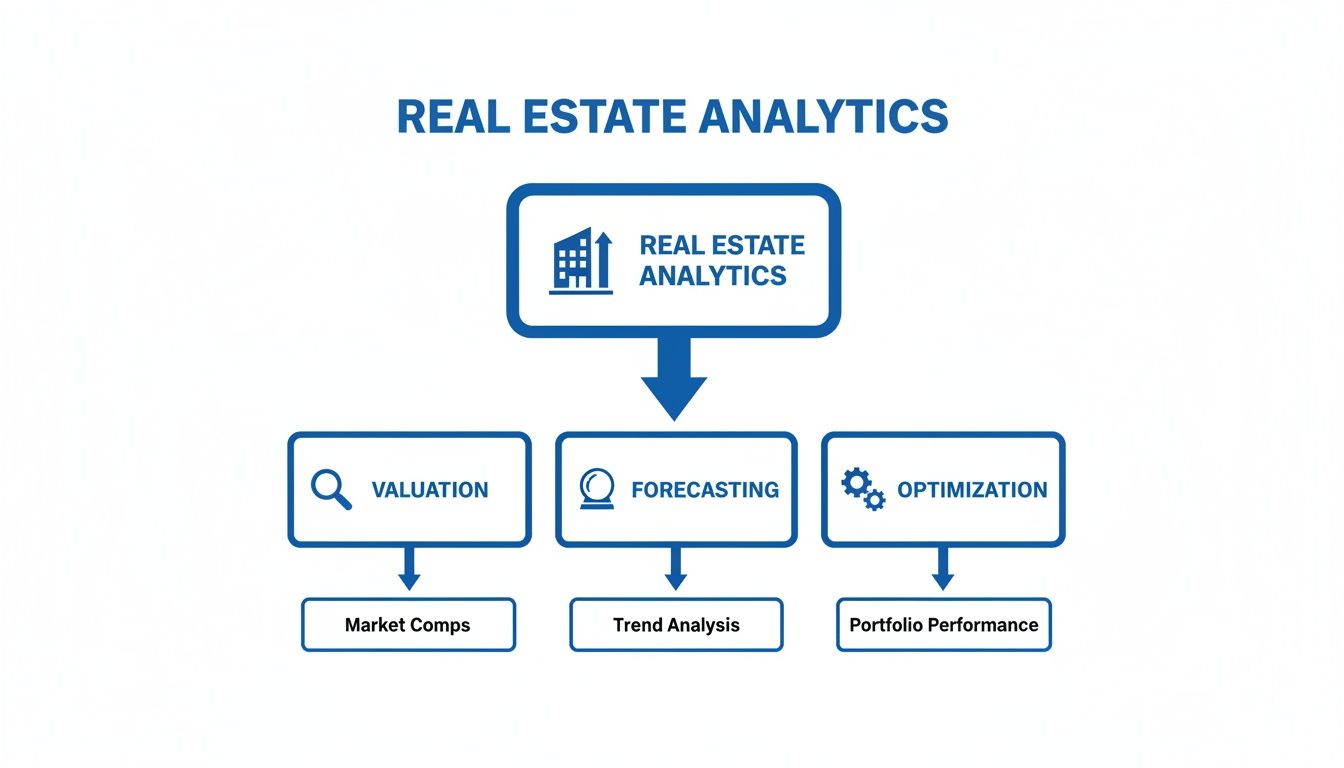
As you can see, key functions like valuation, forecasting, and portfolio optimization all spring from a solid analytics foundation.
Level 2: Diagnostic Analytics — Why Did It Happen?
Once you know what happened, the next question is always, "Why?" That's where Diagnostic Analytics comes in. It’s about digging deeper to find the relationships, patterns, and root causes behind the numbers.
This is our doctor running tests to figure out the cause of the symptoms. For a real estate firm, this could mean:
Connecting a recent dip in sales directly to a local interest rate hike.
Finding that a spike in tenant turnover is tied to unresolved maintenance tickets in a specific building.
Realizing that a new transit line extension came just before a 15% jump in property values in a certain zip code.
Diagnostic analytics moves you past just reporting the facts and helps you understand the story behind them.
By connecting cause and effect, diagnostic analytics transforms passive data into active intelligence. It’s the critical step that separates data reporting from true business insight.
Level 3: Predictive Analytics — What’s Likely to Happen Next?
The third level, Predictive Analytics, is where we start looking into the future. This stage uses historical data, statistical models, and machine learning to forecast what's on the horizon. It’s all about answering, "What's likely to happen next?"
Think of this as the doctor giving a prognosis based on the patient's condition and test results. In real estate, predictive models can:
Forecast future rent prices based on projected job growth and new housing supply.
Pinpoint which tenants are at the highest risk of leaving in the next six months.
Estimate the appreciation rate for properties in an up-and-coming neighborhood.
Predictive analytics isn't about gazing into a crystal ball. It’s about calculating probabilities, which empowers investors and managers to get ahead of market shifts instead of just reacting to them.
Level 4: Prescriptive Analytics — What Should We Do About It?
Finally, we arrive at the most advanced stage: Prescriptive Analytics. This level doesn't just predict an outcome; it actually recommends specific actions to achieve a goal or head off a potential risk. It answers the ultimate question, "What should we do about it?"
This is our doctor writing a prescription and laying out a clear treatment plan. For real estate pros, prescriptive analytics might recommend:
The optimal time to list a specific asset to maximize its return on investment.
A dynamic pricing strategy for rentals that adjusts automatically based on real-time demand.
A prioritized list of capital improvements that will deliver the biggest boost to property value.
This is the pinnacle of data analytics in real estate. It’s the point where data doesn’t just inform your decisions—it actively guides them, offering a calculated path forward.
The Data That Fuels Real Estate Analytics
Think of a sophisticated analytics platform as a high-performance race car. It looks impressive, but it won't go anywhere without the right fuel. In real estate, that fuel is data—the more diverse, accurate, and high-quality, the better. To get beyond simple spreadsheets and into true predictive insights, you have to blend the old with the new.
This means combining traditional property records with modern, dynamic streams of information. It's this combination that creates a complete picture of the market, helping you spot opportunities and risks that your competitors, stuck using a single source, will completely miss.
The Bedrock: Foundational Data Sources
Every solid analytics strategy starts with the basics. These are the traditional, structured data sources that provide the historical context and benchmarks you need to understand any market or property. They're the foundation for everything else you build.
Multiple Listing Service (MLS) Data: This is the lifeblood of residential real estate analysis. It gives you the essentials: listing prices, final sale prices, days on market, and all the nitty-gritty property details.
Property Tax and Assessment Records: These public records are a goldmine, offering a clear line of sight into property ownership history, official assessed values, and tax burdens—all critical inputs for accurate valuation.
Demographic Data: Information from sources like the U.S. Census Bureau is crucial for understanding demand. It tells you about population growth, income levels, and household size, painting a picture of who is moving where and why.
For instance, analytics is completely changing how investors see the market. By digging into supply-and-demand trends, they can see that the U.S. for-sale inventory is projected to climb by 8.9% in 2026. This is a big deal, narrowing the gap from 30% below pre-pandemic levels in 2024 to just 12%. Investors are using predictive models to find 'hotspots' during the 2023-2025 slowdown—areas where new apartment construction is outpacing demand, pushing vacancy rates up to 8% in some cities. You can read the full housing forecast on Realtor.com for more detail.
The Competitive Edge: Modern and Alternative Data
If foundational data tells you what happened, modern data sources help explain why it happened and predict what might happen next. These alternative streams offer a real-time, granular look at the market, giving you a serious advantage.
Think of it this way: if MLS data is a detailed road map, alternative data is the live traffic feed. You need both to navigate the market and avoid getting stuck.
Some of the most powerful modern sources include:
Geospatial Data: This is so much more than a map. It includes layers of information like zoning regulations, flood plains, transit proximity, and walkability scores. It's the kind of location intelligence that makes or breaks a site selection decision.
IoT Sensor Data: Smart buildings are constantly talking. They produce a firehose of data on everything from energy use and HVAC performance to room occupancy. This is invaluable for cutting operating costs and making tenants happier.
Web and Behavioral Data: What are people searching for online? Where is foot traffic picking up? Anonymized mobile data and social media sentiment can act as powerful leading indicators, signaling shifts in demand long before they show up in transaction records.
Bringing all these different sources together is the first real hurdle in building a top-tier analytics function. It requires a clear strategy. To make sure you're ready, you might find our guide on how to assess data readiness for AI adoption helpful. By successfully blending these datasets, you'll have the holistic view needed to make smarter, faster decisions at every stage of the real estate game.
Building Your Data Analytics Roadmap
Jumping into data analytics without a plan is like starting a construction project without a blueprint. You might end up with something, but it probably won't be what you envisioned. A clear, strategic roadmap is what separates a successful data initiative from an expensive pile of unused software.
This isn't just about technology. It's a business plan for creating a culture where decisions are guided by data, not just gut feelings. It outlines every step, from defining your goals to making sure every person on your team can actually use the insights you uncover.

The trick is to start small. Nail one project, deliver real value quickly, and use that success to build momentum for the bigger changes to come.
Start With Clear Business Goals
Before you look at a single spreadsheet or software demo, ask the most important question: What specific problem are we trying to solve?
Vague ambitions like "we want to be more data-driven" don't lead anywhere. You need sharp, measurable goals tied to actual business outcomes.
For instance, instead of a fuzzy goal, aim for something concrete:
Reduce tenant churn by 15% in the next 12 months.
Improve our property valuation accuracy so we can make offers 10% faster.
Pinpoint three new high-growth submarkets for our next acquisition by year-end.
Zeroing in on a specific objective focuses your resources and makes it incredibly easy to prove the value of your efforts down the line. A great way to begin is with a small pilot project—solve one high-impact problem to show everyone what data analytics in real estate can really do.
Establish a Solid Data Foundation
Once you know where you're going, you need the fuel to get there. That means building a reliable system to collect, store, and manage your data. This part isn't flashy, but it's the bedrock of everything else you'll do.
This stage involves a few critical steps:
Identify and Centralize Data Sources: First, map out all your data. This includes everything from MLS feeds and public records to your own tenant management systems and IoT sensor outputs. The objective is to pull it all into a single, central place, like a data warehouse, so everyone is working from the same set of facts.
Implement Data Governance: This is all about making sure your data is accurate, consistent, and trustworthy. You'll need to set clear quality standards, assign ownership for different datasets, and establish rules for how data can be accessed and used.
Prioritize Security and Compliance: Real estate data is sensitive. It’s packed with personal and financial details. Your roadmap must include airtight security measures like encryption and strict access controls to prevent breaches and stay compliant with privacy laws.
Think of data governance as quality control for your most valuable asset. Without it, you’re building your entire analytics strategy on a shaky foundation, leading to flawed insights and poor decisions.
Select the Right Tools and Empower Your Team
With your data house in order, it's time to pick the tools that will turn raw numbers into actionable intelligence. The market is flooded with options, from complex platforms built for data scientists to modern, intuitive tools designed for the whole team.
When you’re weighing your options, ask yourself these questions:
Scalability: Will this platform grow with us? Can it handle more data and more complex questions in the future?
Integration: How easily does it plug into our existing software and data sources?
User-Friendliness: Can someone without a technical background actually use this thing?
The final, and most critical, piece of the puzzle is getting your team on board. The world's best analytics platform is worthless if it just sits there. Success hinges on creating visualizations and reports that tell a clear story.
Dashboards should instantly highlight key performance indicators (KPIs) and emerging trends. Even better are platforms that let people ask questions in plain English, like, "What was the average rent per square foot in our downtown office properties last quarter?" This approach lowers the barrier for everyone, empowering leasing agents, portfolio managers, and executives to make smarter, data-backed decisions every single day.
How to Accelerate Your Real Estate Insights
Even with a perfectly planned analytics strategy, many real estate firms hit a familiar wall. The reality on the ground is often a bottlenecked data team, frustrating week-long waits for simple reports, and business users wrestling with clunky software they don't know how to use.
This friction keeps crucial insights trapped in databases, slowing down deals and leading to missed opportunities.
The traditional model just doesn't cut it anymore. Waiting days for an analyst to pull comps or track down market trends is a recipe for falling behind. The goal has to be a shift from a slow, ticket-based system to one that provides immediate, self-serve answers. This is exactly where modern analytics hubs are changing the game.
These platforms are built to bridge the gap between mountains of complex data and the people who need it most—the portfolio managers, leasing agents, and acquisition teams making daily decisions.
Unlocking Self-Serve Analytics
The fastest way to get insights is to empower your team. Imagine a world where anyone on your team can ask a question in plain English and get an accurate, visualized answer instantly. That's the power of natural language querying.
A portfolio manager shouldn't have to learn SQL or wait for a data analyst. They should be able to simply type, "Which zip codes in Miami saw the highest rent growth for 2-bedroom apartments last quarter?" The system should understand the intent, pull the right data, and serve up a chart in seconds.
This simple shift completely changes the role of the data team. They move from being report-builders to strategic enablers, focusing on creating powerful data models while business users find their own answers. It effectively democratizes data analytics in real estate and turns everyone into an analyst.
Embedding Insights Where You Work
Another game-changer is bringing the data directly into the tools your team already lives in. Embedded analytics means placing interactive dashboards and charts right inside your property management software, CRM, or internal portal.
This simple change eliminates the constant back-and-forth between applications, keeping critical information right where you need it.
For Property Managers: An embedded dashboard can display real-time tenant satisfaction scores and maintenance ticket volumes directly within their daily management interface.
For Investment Teams: A live dashboard showing market trends can be integrated into their deal flow platform, giving them instant context on a potential acquisition.
To really get ahead, you have to look into the best real estate market analysis tools available. These modern solutions go way beyond static PDF reports, offering dynamic and interactive ways to explore data. By making insights this accessible and intuitive, you build a culture where data-driven decisions become second nature. For a deeper dive, our guide explains the ROI of real-time AI analytics.
Frequently Asked Questions
Jumping into real estate data analytics can feel a bit overwhelming, and it's natural to have questions. Let's walk through some of the most common ones to clear things up and help you build a smarter, more data-informed strategy.
What's the Real Difference Between Market Analysis and Data Analytics?
It's easy to mix these two up, but they're not the same. Think of traditional market analysis as a snapshot in time—it tells you what happened in the past. It’s the report you get showing last quarter's comparable sales or the average days on market. It's descriptive and historical.
Data analytics is a much bigger picture. It starts by looking at that same historical data to understand why it happened. But then, it takes the crucial next step: using sophisticated models to predict what is likely to happen next. It’s the difference between reading a history book and using that knowledge to actually forecast the future.
Can a Small Real Estate Agency Actually Use Data Analytics?
Absolutely. Not too long ago, this kind of power was reserved for massive corporations with dedicated data science teams. But that's changed completely. Modern, cloud-based tools have made top-tier analytics surprisingly affordable and accessible for businesses of any size.
A smaller agency can use data to carve out a unique advantage. Imagine identifying a tiny, overlooked neighborhood where demand is quietly starting to spike, or spotting undervalued properties before they catch the eye of bigger players. This is how smaller firms can punch well above their weight and compete effectively.
The most important skill for getting started isn't a degree in data science—it's business curiosity. Modern platforms with natural language interfaces have dramatically lowered the technical barrier, empowering you to focus on asking the right questions.
How Can I Be Sure My Data is Accurate?
This is a critical point because your insights are only as good as the data they're built on. The classic phrase "garbage in, garbage out" has never been more true. The key is to establish a solid data governance framework from the start.
This isn't as complicated as it sounds. It just means taking a few deliberate steps:
Set Your Standards: Decide what "clean" and "complete" data looks like for your business.
Vet Your Sources: Prioritize data from official, reliable feeds like the MLS, public records, and trusted market data providers.
Use Validation Tools: Implement software that automatically cleans your data, removes duplicates, and flags errors before it ever gets used for analysis.
Think of it as building your decisions on a foundation of concrete instead of sand.
Ready to stop waiting for reports and start getting instant answers? With Querio, your entire team can ask questions in plain English and get visualized insights in seconds. See how leading real estate firms are accelerating their decision-making at https://www.querio.ai.

