Guide
A Comparison of Business Intelligence Software
Explore our detailed comparison of business intelligence software. Find the right BI tool with our analysis of features, use cases, and total cost.
Choosing the right business intelligence software starts with knowing the major players. The field is largely dominated by titans like Microsoft Power BI, a natural fit for organizations already deep in the Microsoft ecosystem, and Tableau, which is widely praised for its beautiful and powerful data visualizations. Ultimately, your decision comes down to a few key things: your current tech setup, your team's comfort level with data tools, and what you actually need to analyze.
What Are We Really Talking About With Business Intelligence Software?
At its core, BI software is the bridge between raw data and smart decisions. It’s what turns mountains of numbers into clear, actionable insights, so your team can stop guessing and start strategizing.
These tools connect to all sorts of data sources, from basic Excel sheets to massive cloud warehouses. They give you the ability to dig in, analyze the information, and then present it in interactive dashboards and reports that everyone can understand. The real goal here is to move past just hoarding data and actually use it to spot trends, fix problems, and discover new ways to grow.
The BI market is a competitive one. A major 2020 report revealed that market leaders Microsoft, Tableau, and SAP held a commanding 70% of the total market share. This really underscores just how established and trusted these platforms are.
Quick Look at Leading BI Platforms
Before we get into the nitty-gritty details, let’s start with a high-level overview. Each of these tools has its own unique strengths and is built for a different kind of user and organization. Think of this table as a quick cheat sheet to help you get your bearings before the deep dive.
| BI Software | Best For | Key Strength | Typical User |
|---|---|---|---|
| Microsoft Power BI | Organizations within the Microsoft ecosystem | Seamless integration and cost-effectiveness | Business Analysts, IT |
| Tableau | Deep, interactive visual data exploration | Unmatched visualization flexibility | Data Analysts, Marketers |
| SAP BusinessObjects | Large enterprises with complex SAP systems | Robust, enterprise-grade reporting | Enterprise IT, Finance |
| Qlik Sense | Unstructured data discovery and exploration | Associative Engine for data relationships | Data Scientists, Analysts |
This table gives you a snapshot of the landscape, but the real story is in how these tools perform day-to-day. The detailed analysis that follows will break down exactly what you can expect from each one.
The image below shows a classic Power BI dashboard. You can immediately see its clean layout and how it brings different charts and metrics together into one clear picture.

It’s a great example of how you can instantly get a handle on key numbers like revenue, market share, and sales targets. If you're looking to understand how different data-driven tools are evaluated, checking out something like a comprehensive guide to Sales Intelligence Platforms can provide some useful context for your decision-making process.
Building Your Evaluation Framework
Diving into a comparison of business intelligence software without a clear plan is a classic mistake. It's like going grocery shopping without a list—you'll get distracted by shiny features and end up with a cart full of things you don't actually need. Before you sit through a single demo, you need to build a solid evaluation framework based on your company's real-world needs, technical setup, and what you’re trying to achieve.
Think of this framework as your North Star. It’s not just a checklist; it’s the strategic lens you’ll use to assess every platform. This process forces you to decide what’s a “must-have” versus a “nice-to-have,” keeping you grounded when a flashy but irrelevant feature tries to steal the show. A good framework ensures your final choice is built on a strong business case, not just a slick sales pitch.

Defining Your Core Criteria
Your evaluation needs to stand on a few key pillars. First, get a handle on your data. Map out every single data source you depend on, from cloud warehouses and SaaS tools down to those stubborn legacy databases in the corner. If a BI tool can't connect to your data easily, it's a non-starter.
Next, think about who will actually use this thing. An intuitive, clean user interface (UI) is absolutely critical if you want people to adopt it. If only your data analysts can figure it out, you’ve missed the entire point of empowering your organization with data. How easily can a marketing manager or a sales rep build a report and get an answer to a question on their own?
Visualization is another big one. Sure, every tool can make a bar chart. But can it create the specific visuals your teams rely on? Think geo-maps for sales territories or Gantt charts for tracking project timelines. The goal here is actionable clarity, not just pretty graphs. To get a better sense of what to look for, check out these 10 essential features of modern business intelligence tools.
A BI platform's true value isn't measured by the number of features it has, but by how effectively it lowers the barrier between questions and answers for everyone in the organization.
Weighing Technical and Strategic Needs
Beyond what users see, you have to dig into the technical foundation. These behind-the-scenes components are what determine if a platform is a long-term solution or a short-term headache.
- Scalability: What happens when your data grows from gigabytes to terabytes? Ask hard questions about the platform’s architecture. You need to know if it can handle more data and more users without grinding to a halt.
- Governance and Security: Your BI tool has to play by your rules. Look for essentials like role-based access controls, row-level security, and detailed audit logs. Keeping sensitive data safe is non-negotiable.
- Integration and Implementation: How will this tool fit into your current tech stack? Integrating new software can be complex, so it's smart to understand the necessary data migration best practices and what it will take to get everything talking to each other.
Once you have your list, assign a weight to each criterion. A startup might put a high value on ease of use and low cost. A large, regulated enterprise, on the other hand, will probably prioritize security and scalability above all else. This weighted scorecard becomes your objective guide, helping you cut through the noise and make a confident, systematic choice.
A Head-to-Head BI Software Comparison
Alright, let's move past the theory and get down to brass tacks. This is where we put the leading BI platforms side-by-side to see how they really stack up: Microsoft Power BI, Tableau, SAP BusinessObjects, and Qlik Sense. We won't just look at feature lists; we’ll dig into how those features actually perform in the real world for different kinds of companies. The goal here is to find the small, crucial differences that matter in your day-to-day work.
First, let's get a high-level view. This chart shows how these four BI heavyweights compare across three key areas we've already discussed: Data Connectivity, Visualization Power, and User Adoption Potential.
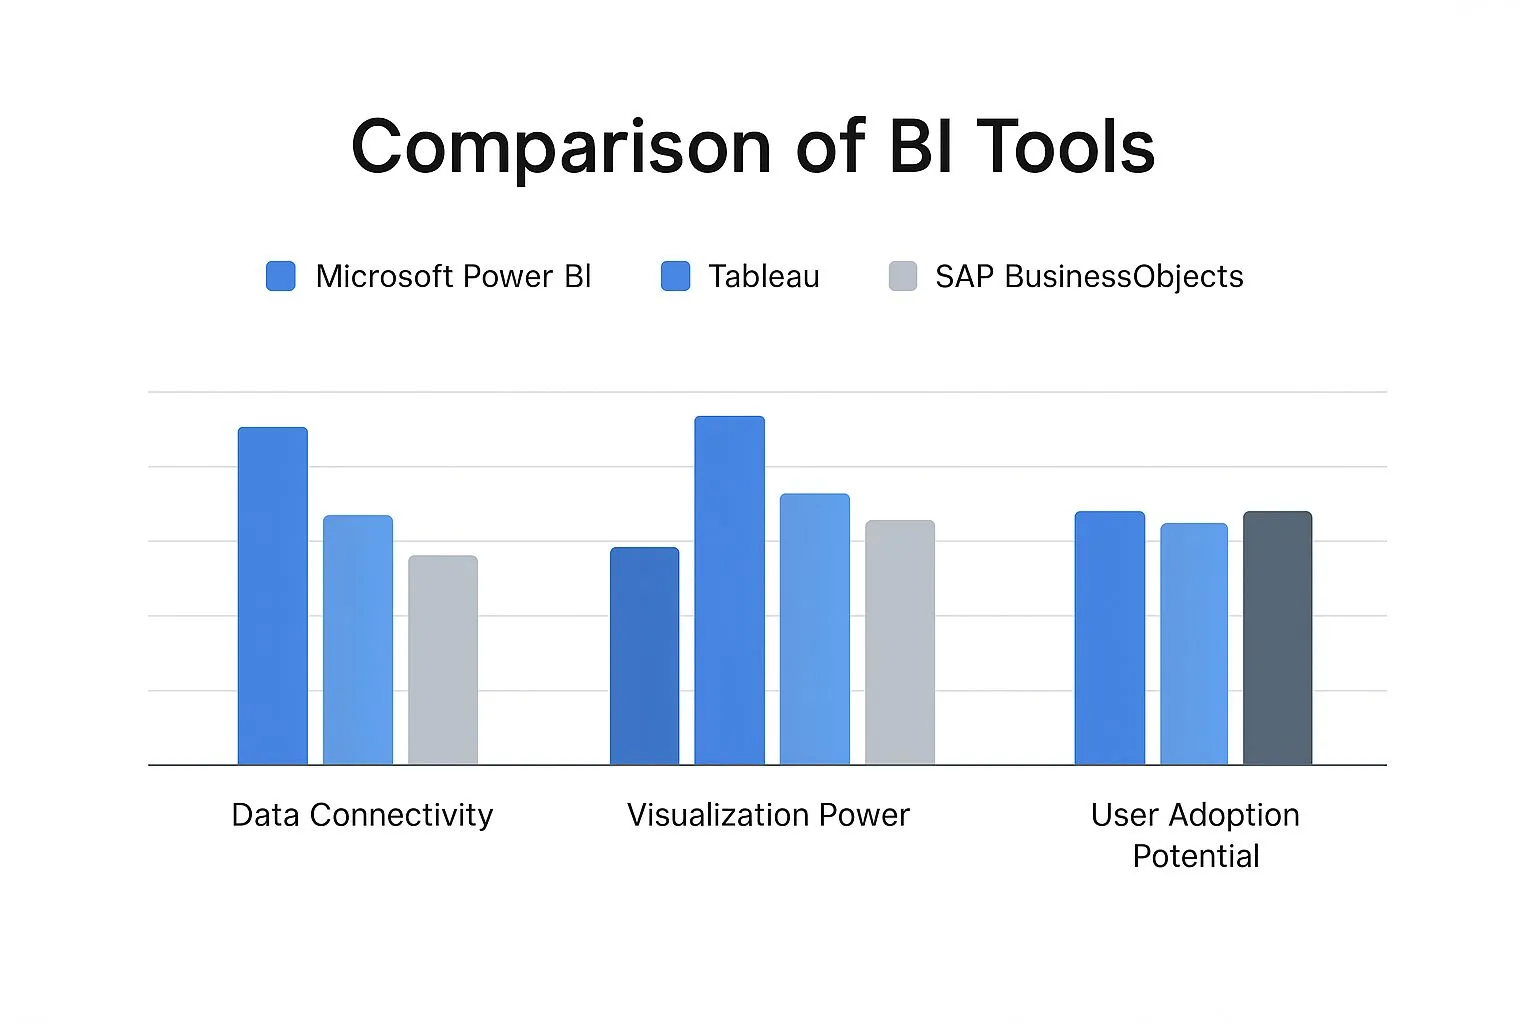
This gives us a quick snapshot of each tool's personality. You can immediately see Power BI and Tableau leading the pack in user-friendliness and visuals, while SAP holds its ground with a solid enterprise focus. Now, let's break these differences down even further.
H3: Microsoft Power BI: The Ecosystem Integrator
Power BI's secret weapon is its deep, native integration with the rest of the Microsoft world. If your organization is already running on Azure, Microsoft 365, and Dynamics 365, Power BI feels less like a bolted-on application and more like a natural part of your existing setup. This tight-knit connection simplifies everything from user permissions to pulling in data.
Its interface is instantly familiar to anyone who’s ever used Excel, which dramatically shortens the time it takes for new users to get comfortable. Power BI is at its best when creating structured, dashboard-driven reports for monitoring key metrics on a regular basis. While its DAX (Data Analysis Expressions) language is incredibly powerful for complex calculations, it does come with its own learning curve.
For any organization already committed to the Microsoft ecosystem, Power BI's value is tough to beat. The combination of cost-effectiveness and seamless integration makes it a low-friction path to getting BI into everyone's hands, making it a fantastic starting point for many.
Where does it fall short? Performance can sometimes get sluggish when you're working with huge datasets from non-Microsoft sources. And while its visuals are solid, they don't quite offer the same level of fine-tuned customization and aesthetic polish that you'll find in Tableau.
H3: Tableau: The Visualization Powerhouse
Tableau built its entire reputation on doing one thing exceptionally well: world-class data visualization. It gives users the power to truly explore data visually, creating beautiful, interactive, and highly customized dashboards that can bring subtle trends and outliers to light. This makes it a go-to tool for data analysts, marketers, and researchers who need to tell a compelling story with their numbers.
The platform's drag-and-drop interface makes it easy to start building visuals, but don't be fooled—mastering its advanced features like Level of Detail (LOD) expressions takes a real commitment to learning. Tableau’s real strength is its flexibility. It connects to a huge range of data sources without breaking a sweat and encourages a more curious, hypothesis-driven style of analysis.
Key Differentiator: Power BI vs. Tableau
Power BI is built for standardized, company-wide reporting, especially within a Microsoft-centric organization. Tableau, on the other hand, is the artist's canvas, perfect for deep, ad-hoc visual exploration and crafting executive-level data stories that need to impress.
H3: SAP BusinessObjects: The Enterprise Reporting Engine
SAP BusinessObjects is the seasoned veteran in this group, built for massive enterprises, especially those already running on SAP ERP systems. Its strength isn't in flashy, interactive dashboards but in generating pixel-perfect, highly structured operational reports. We're talking about financial statements, inventory lists, and complex regulatory documents that need to be exactly right, every time.
It’s less a single tool and more a suite of applications, which can be a double-edged sword. You might use Web Intelligence for ad-hoc queries but switch to Crystal Reports for those precise, paginated report designs. This specialization delivers incredible power but also means a much steeper learning curve and a heavy reliance on your IT department.
BusinessObjects is designed for governance and scale from the ground up. It provides bulletproof security, data management, and scheduling features that are essential in highly regulated industries like finance and healthcare. The trade-off is that its self-service capabilities are way behind modern platforms like Power BI and Tableau, and its interface can feel a bit dated.
H3: Qlik Sense: The Associative Explorer
Qlik Sense brings a completely different philosophy to the table with its patented Associative Engine. Unlike traditional query-based tools that follow a linear path to an answer, Qlik's engine loads all your data into memory and understands the relationship between every single data point.
This has a huge impact on how you interact with your data. When you click on something in a Qlik dashboard, the entire view instantly refilters. Related data is highlighted in green, but more importantly, unrelated data is shown in gray. This "power of gray" is Qlik’s killer feature—it shows you not just what’s connected to your selection, but also what isn't, often revealing hidden insights you would have missed otherwise.
This makes Qlik an amazing tool for unstructured data discovery. It encourages you to ask questions you didn't even know you had. While its visualization tools are strong, they aren’t quite as flexible as Tableau's, and getting the most out of the platform requires a different way of thinking about your data model.
Detailed Feature Comparison of Top BI Tools
To really see where each tool shines, let's put them head-to-head on some key features. This table breaks down how they compare in the areas that often matter most when making a decision.
| Feature | Microsoft Power BI | Tableau | SAP BusinessObjects | Qlik Sense |
|---|---|---|---|---|
| Primary Strength | Microsoft ecosystem integration and affordability. | Unmatched visualization flexibility and aesthetic control. | Robust, enterprise-grade, pixel-perfect reporting. | Associative data exploration and hidden insights. |
| Learning Curve | Low for basic use, moderate for advanced (DAX). | Moderate for basic use, high for mastery (LODs). | High, often requires specialized IT skills. | Moderate, requires understanding the associative model. |
| Self-Service Focus | High, designed for business user empowerment. | Very high, built for analyst-driven exploration. | Low, primarily IT-driven and developer-centric. | High, encourages user-led data discovery. |
| AI & Machine Learning | Strong with Azure ML integration and built-in features. | Good, with Einstein Discovery and statistical functions. | Limited, more focused on traditional reporting. | Strong, with cognitive engine for insight suggestions. |
| Collaboration | Excellent within the Microsoft 365/Teams ecosystem. | Good, with commenting and sharing features. | Basic, focused on report distribution, not interaction. | Good, with shared spaces and storytelling features. |
| Ideal Scenario | A company standardizing BI on the Microsoft stack. | A marketing team analyzing diverse campaign data. | A finance department generating regulatory reports. | A supply chain team looking for hidden inefficiencies. |
As you can see, there’s no single "best" tool—the right choice is completely dependent on your team's needs, budget, and existing tech stack. Each of these platforms is a leader for a reason, but they solve very different problems.
Understanding Pricing and Total Cost of Ownership
https://www.youtube.com/embed/eKdRyS0Nf8Q
When you're comparing business intelligence software, it's easy to get dazzled by flashy features and slick demos. But the real cost of a BI platform runs much deeper than the initial quote. A tool that looks like a bargain at first glance can quickly drain your budget if you haven't considered its Total Cost of Ownership (TCO).
Thinking about TCO means looking at the whole financial picture, not just the sticker price. It's about tallying up everything from the pricing model itself to the subtle, ongoing expenses that will hit your budget for years. Getting this right is the difference between a smart investment and a costly mistake.
Decoding Common BI Pricing Models
BI vendors tend to favor a few common pricing structures, and each one has major implications for your bottom line. What works for a lean startup could be a financial nightmare for a large enterprise, and the other way around.
Here’s a look at the models you'll most likely encounter:
- Per-User Subscription: This is the go-to model for cloud-based tools like Power BI and Tableau. You pay a monthly or annual fee for every person who needs a license. It’s predictable, but the costs can really stack up as your team expands.
- Capacity-Based Pricing: Instead of charging per head, some platforms bill you based on the computing power or data volume you consume. This can be a great deal if you have a lot of casual users, but be warned—your costs can spike unexpectedly if usage surges.
- Freemium or Tiered Models: Many vendors offer a free, feature-limited version to let you test the waters. Paid tiers then unlock more powerful capabilities, additional data connectors, or higher usage caps. It's a fantastic way to try before you buy, but you have to plan carefully to avoid outgrowing your tier and facing a sudden price hike.
The question you should be asking isn't "What does a license cost?" It's "How will our costs scale as our data, user base, and analytical needs grow over the next three to five years?" Planning for that future growth is the key to avoiding budget shock down the road.
Uncovering the Hidden Costs
The license fee is just the tip of the iceberg. The real money is often spent below the surface, on all the resources needed to get the software working and adopted inside your organization. Overlooking these expenses can sink your BI project before it even has a chance to deliver value.
These "hidden" costs catch a lot of people by surprise, especially if they're new to rolling out enterprise-level software. You can dig deeper into these potential expenses by exploring the hidden costs of traditional BI platforms.
Here are the big-ticket items you need to budget for:
- Implementation and Setup: This is way more than just installing software. You're looking at configuring data connections, establishing security rules, and migrating old reports. That work often demands specialized consultants or a significant time commitment from your own IT team.
- Training and Enablement: A BI tool is worthless if your team doesn't know how to use it. You absolutely have to budget for solid training programs to get people comfortable with the data. And it's not a one-and-done deal; you'll need ongoing education as the platform evolves and new people come on board.
- Data Infrastructure: Can your current data warehouse actually handle the workload from a new BI tool? You might find yourself needing to upgrade servers, buy more cloud storage, or add new data prep tools just to keep performance from grinding to a halt.
- Ongoing Maintenance and Support: Beyond what you pay the vendor for their support plan, you'll need people on your payroll to manage the platform day-to-day. This means troubleshooting problems, handling user requests, and performing updates—a permanent operational cost.
By mapping out these factors from the start, you can build a financial forecast that reflects the true TCO and make a much smarter, more sustainable decision.
Matching BI Tools to Business Scenarios
Choosing the right BI platform from any comparison of business intelligence software goes way beyond a simple feature checklist. A tool's real value only shines through when its strengths directly solve a team's day-to-day problems. What works brilliantly for a fast-paced marketing team is almost certainly the wrong fit for a finance department bound by strict regulations.
To close that gap between features on a page and real-world results, let's walk through a few common business situations. By mapping specific needs to what these top BI tools actually do best, you can get a much clearer picture of how each one would function inside your own organization.
The Marketing Team Drowning in Diverse Data
Picture a digital marketing team juggling campaigns across Google Ads, Facebook, HubSpot, and their own sales database. Their biggest headache is trying to stitch all that data together to get one clear view of campaign performance and ROI. They need to build dashboards that don't just show numbers but tell a story to stakeholders who aren't data analysts.
For this team, Tableau is the standout choice.
- Superior Data Blending: Tableau is a beast when it comes to joining data from completely different systems without needing a data engineer to prep everything first. The team can connect to various APIs and databases and blend that information right inside the tool.
- Visual Storytelling: Marketers can use Tableau's incredible visualization engine to build rich, interactive dashboards that map the entire customer journey, from the first ad click to the final sale. This is absolutely critical for proving campaign value.
Sure, a tool like Power BI could get the job done, but Tableau's edge in creative control and deep visual exploration makes it a better fit for a team focused on building a compelling narrative.
The right BI tool doesn't just present data; it empowers a team to solve its most pressing, specific problem. For marketing, that problem is often unifying fragmented data into a cohesive and persuasive story.
The Finance Department Embedded in Microsoft
Now, let's think about a corporate finance department. These folks live in Microsoft Excel, their data infrastructure is built on Azure, and they use Microsoft 365 for everything. Their priorities are rock-solid data accuracy, governance, and creating standardized financial reports for the executive team. They need a tool that feels like it’s already part of their world.
In this case, Microsoft Power BI is the undisputed winner.
Its native integration with the entire Microsoft ecosystem is a massive advantage. Financial analysts can pull data from Excel files or Azure Synapse with a couple of clicks, and they can share secure reports through Microsoft Teams without any friction. The interface is so similar to Excel that the learning curve for the team is significantly shorter. For a department where consistency and reliability are everything, Power BI’s structured, governance-first approach is perfect.
The screenshot below shows a dashboard from SAP BusinessObjects, a tool often found in large enterprises that need highly structured, robust reporting.

You can see how this interface is all about delivering precise, enterprise-grade reports, which is a different philosophy from the fluid, visual exploration you find in other tools.
The Enterprise Juggling Legacy Systems
Finally, imagine a huge manufacturing company with decades of data trapped in on-premise SAP ERP systems and other aging databases. Their main goal is to generate highly structured, pixel-perfect operational reports—think inventory summaries or supply chain deep dives—where every single number has to be exact. Self-service analytics for everyone is less important than powerful, IT-managed reporting.
This is the classic use case for SAP BusinessObjects.
- Deep SAP Integration: BusinessObjects was built from the ground up to connect with the SAP ecosystem. It offers a level of reliability and performance with SAP data that other tools can't easily replicate.
- Enterprise-Grade Reporting: The platform is designed to create the complex, paginated, and heavily formatted reports that large organizations need for regulatory compliance and operational oversight.
It may not have the modern, user-friendly feel of its competitors, but its strength is its industrial-scale power and governance. That makes it the right choice for an enterprise that puts stability and control above all else. The journey from a small business toolset to an enterprise platform is full of these kinds of trade-offs, and you can learn more about how to choose data analysis tools that fit your company's growth stage. As these examples show, the "best" BI software is always situational.
So, How Do You Actually Choose?
After breaking down all the features, pricing, and capabilities, the final decision really boils down to fit. There's no magic "best" BI platform—only the one that clicks with your company's data culture, budget, and what you’re trying to achieve. The trick is to take all this information and filter it through the lens of your own organization.
Let's quickly recap the contenders' core identities. Power BI is a no-brainer if you’re already living in the Microsoft world; it’s affordable and integrates seamlessly. Tableau is the undisputed king of visual analytics and deep-dive data exploration, built for teams that need to ask complex questions of their data.
For massive enterprises running on complex, often older systems, SAP BusinessObjects delivers the kind of robust, enterprise-grade reporting they need. And then there's Qlik Sense, which stands out with its unique associative engine that helps you find connections in your data you didn't even know to look for.
A Framework for Your Final Call
With those personalities in mind, it's time to turn the spotlight on your own team. A brutally honest self-assessment is the fastest way to find the right tool.
- Who is this really for? Think about the end-users. Are they business folks who are masters of Excel and need something intuitive? Or are they seasoned data analysts ready to write complex DAX or LOD expressions? The answer here will immediately point you toward either a user-friendly platform or a high-powered one with a steeper learning curve.
- What's your tech stack look like? A new tool shouldn't create a headache for your IT department. If your entire company runs on Microsoft 365 and Azure, bringing in Power BI will be a much smoother ride. You have to consider the real cost of integration—not just the price tag, but the time and energy it will demand from your technical teams.
- What problem are you actually trying to solve? Get specific. Is the goal to create standardized financial reports for the entire company? That's a completely different challenge than a marketing team trying to build interactive dashboards to prove the ROI on their latest campaign.
The most sophisticated BI tool is worthless if no one uses it. Before you sign a contract, get your hands dirty with a free trial. Nothing beats testing a platform with your own data in your own environment to see if it truly works for you.
This last step is crucial. It takes the decision from a theoretical "on-paper" comparison to a practical, real-world test, ensuring you're not just buying software, but a solution that will actually get adopted and drive results.
Got Questions About BI Software? We've Got Answers
Even after looking at all the feature lists and pricing tables, some very real, practical questions always come up. Let's tackle some of the common ones that pop up right before you pull the trigger on a new BI platform, from getting it up and running to the buzz around AI.
This is where we move past the spec sheets and get into the nitty-gritty of making a BI tool work in the real world.
What's the Single Biggest Hurdle to Implementation?
You might think it’s a technical issue, but it’s not. The biggest challenge, time and time again, is user adoption. Companies get so wrapped up in features and capabilities that they completely overlook the human element of training and change management.
If the people who are supposed to use the tool every day don't see the value in it, the most expensive, powerful platform on the market will just collect digital dust. Real success comes from showing each person how it makes their specific job easier and from building a culture of data literacy with solid, ongoing support.
Is It Okay to Use More Than One BI Tool?
Absolutely. In fact, it’s pretty standard for larger companies to use a mix of tools. For instance, a corporation might use Power BI across the board for financial reporting because it plugs so neatly into their existing Microsoft 365 ecosystem.
At the same time, the marketing team might prefer using Tableau because its visualization engine is second to none for digging into complex customer campaign data.
The secret to making a multi-tool strategy work is solid governance. You have to clearly define which tool gets used for what. Without that clarity, you'll end up with data silos and conflicting reports that cause more confusion than they solve.
How Much Does AI Really Matter in BI Today?
Artificial intelligence and machine learning (ML) are quickly moving from "nice-to-have" to "must-have." Modern BI platforms are leaning on AI to deliver features that seriously speed up analysis and put powerful tools in the hands of non-technical users.
Here’s what that actually looks like:
- Natural Language Querying: This lets you ask questions like "What were our top 5 products in the Northeast last quarter?" in plain English, no code required.
- Automated Insights: The system actively flags unusual spikes, dips, or hidden trends in your data that a human analyst might not have caught.
- Predictive Analytics: The platform can use historical data to forecast what's likely to happen next, giving you a serious leg up on planning.
While you can still get by with basic reporting without these, AI-driven features are what unlock the truly deep insights and make data accessible to everyone. When you're comparing tools, really dig into how mature and genuinely useful their AI features are.
Ready to make analytics accessible to everyone on your team? Querio uses best-in-class AI agents to turn natural-language questions into accurate answers in seconds, eliminating manual work and helping you make faster, better decisions. Learn more and see how it works.