Build a Scalable Analytics Infrastructure with AI
Build a modern analytics infrastructure that scales. Explore components, architectures, and AI tools to eliminate data bottlenecks.
https://www.youtube.com/watch?v=FwOTs4UxQS4
published
Outrank AI
analytics infrastructure, data infrastructure, self-serve analytics, modern data stack, querio
afe1f794-2d95-471c-a882-aa2ada2655e1

Your company is growing, but your analytics process still works like a help desk. Sales wants pipeline by segment. Product wants retention by feature. Finance wants revenue by cohort. Marketing wants attribution cleaned up before the board meeting. Every question lands in the same queue, and the data team becomes the bottleneck.
That's usually the moment founders start shopping for dashboards. The underlying problem is deeper. You don't need another reporting layer sitting on top of chaos. You need analytics infrastructure that turns raw operational data into reliable, governed, self-serve decision support.
For startups, this matters early. If the first version of your stack is a pile of manual exports, one-off SQL, and inconsistent definitions, the cost doesn't show up only in engineering time. It shows up in slower decisions, lower trust, and executives arguing over whose spreadsheet is right.
Table of Contents
What Is Analytics Infrastructure
Monday morning, the founder asks why paid signups dropped. Marketing checks one dashboard. Finance checks another. Product pulls raw events. By noon, the company has three answers and no decision. That is usually the moment a startup realizes analytics infrastructure is not a reporting tool. It is the system that decides whether the business can trust its own numbers.
Analytics infrastructure is the stack that collects, stores, transforms, governs, and delivers data so people can make decisions without rebuilding the truth every time. It includes pipelines, storage, compute, data models, permissions, and the interfaces where teams ask questions and get answers.
City infrastructure is a useful comparison. Roads, water, and power systems do not create demand. They make the city function. Analytics infrastructure plays the same role for data. It moves information out of product databases, ad platforms, billing tools, and support systems, standardizes it, and makes it usable across the company.
When this layer is weak, the symptoms show up fast. Sales and marketing argue over attribution. Product metrics change depending on who wrote the query. Adding a new source turns into a one-off engineering project. Analysts become a human API for every team, translating business questions into SQL and then explaining why the dashboard does not match someone's spreadsheet.
That last problem matters more than founders expect.
Traditional BI setups usually stop at dashboards. They can centralize charts, but they rarely remove the dependency on a small data team to define metrics, join messy source tables, and answer follow-up questions. Agile teams need more than static reporting. They need a system where the data model is governed, the source of truth is clear, and non-technical users can ask new questions without filing a ticket every time. That is why more startups are shifting toward AI-native, file-system-based approaches, including tools like Querio, which sit closer to the actual data structure and reduce the handoff cost between business users and data specialists.
For founders, this is an operating decision with real cost implications. The wrong setup creates duplicate pipelines, metric drift, slow onboarding for new hires, and expensive analyst time spent on repetitive requests instead of higher-value work. The right setup gives the company a reliable path from raw data to action, with enough governance to prevent chaos and enough flexibility to keep pace with the business.
A practical way to evaluate your current state is simple. If a growth lead cannot answer a basic question about campaign performance without waiting on SQL help, self-service does not exist yet. If your team is still sorting out UTM inconsistencies and channel naming by hand, start with how to integrate marketing data. If you want a broader view of how the underlying stack should fit together, this guide to data infrastructure and analytics is a useful reference.
The goal is not more dashboards. The goal is a system that gives teams trusted answers fast, without hiring a large data function just to keep the pipes running.
The Blueprint for Data-Driven Decisions
A usable stack has a simple property. Data moves through it cleanly. If one layer is weak, the rest of the system inherits the damage. Founders don't need to memorize every vendor category, but they do need a mental model of the flow.

The five layers that matter
Start with data sources. These are your transactional database, product event logs, CRM, billing system, support platform, ad platforms, and any third-party application generating business signals. If you're running a startup, these systems rarely agree on naming, timing, or identifiers.
Next is ingestion. This is how data gets from those systems into a central environment. The practical split is ETL or ELT for scheduled loading, and streaming when the business needs fresher updates. According to Domo's overview of analytics data infrastructure, a robust analytics infrastructure mandates a unified data architecture that consolidates sources via ETL/ELT or real-time streaming into a centralized data lake or warehouse, with a data catalog, role-based access control, and automated data quality checks to preserve governance and traceability.
Then comes storage. For most startups, that means a warehouse, a lake, or some combination. The important decision isn't ideological. It's operational. Where will the team look for trusted data, and what workloads does that environment need to support?
After storage comes transformation and modeling, converting raw tables into business-ready datasets. Product events turn into retention models. Billing records become revenue views. CRM tables become pipeline and conversion logic. This layer is a frequent source of significant startup pain because it's easy to let business logic scatter across dashboards, notebooks, and ad hoc SQL. That's a mistake. Put business logic in one governed place.
The last layer is access and consumption. This includes BI dashboards, reporting tools, notebooks, semantic layers, and newer AI-driven interfaces. The point is not merely to expose data. It's to expose it in a way people can use safely.
A dashboard doesn't create trust. Consistent definitions and governed access do.
If marketing data is part of your early stack, the ingestion design matters more than generally anticipated. Marketing platforms often use different IDs, attribution windows, and naming conventions. This guide on how to integrate marketing data is useful because it frames integration as a data design problem, not just a connector problem.
Three patterns founders usually consider
There are a few common ways startups assemble these layers.
Pattern | Works well when | Main upside | Main trade-off |
|---|---|---|---|
Centralized warehouse | One small data team supports the company | Strong governance and simpler metric control | The central team can become a queue |
Modern modular stack | You want flexibility across ingestion, transformation, and access tools | Faster tool-level changes and clearer ownership by layer | More vendor coordination and operational overhead |
Decentralized model | Multiple domains have strong technical ownership | Domain teams move faster within their area | Governance gets harder quickly |
For most startups, the right first move is boring in a good way. Centralize core data, define metrics carefully, and avoid adding architectural complexity before you have a real organizational reason for it. Teams often reach for decentralized patterns too early because they want speed. In practice, they usually buy fragmentation instead.
Choosing Your Architectural Pattern
Architecture choices are really choices about constraints. What are you optimizing for right now: control, flexibility, experimentation, or team autonomy? The wrong pattern isn't the one a conference speaker dislikes. It's the one your current team can't operate.

What each pattern optimizes for
A traditional warehouse-first setup is usually the cleanest place to begin. Data lands in a central warehouse, transformations create trusted models, and dashboards read from those models. This works especially well when the company mainly needs recurring business reporting, operating metrics, and a clear single source of truth. The downside is that the warehouse can become too tightly coupled to reporting needs, which leaves experimentation and advanced analysis feeling awkward.
A data lake approach gives you more flexibility with raw and varied data. It's useful when teams expect to work with logs, documents, machine-generated data, or exploratory workflows that don't fit neatly into BI conventions. The trade-off is governance. If the team doesn't enforce structure, a lake becomes a dumping ground faster than founders expect.
A lakehouse pattern tries to balance those concerns. It gives the team flexible storage characteristics with more warehouse-style reliability for analytics. That's attractive for companies that need both standard reporting and heavier experimentation. It also introduces more design decisions, which can be overkill for a company still trying to define its basic metric layer.
A good summary of the practical design options is this guide to data warehouse architectures. It's useful because founders often confuse “more modern” with “better for us.” Those aren't the same thing.
If your company still argues about the definition of active customer, don't solve that with a more complex architecture. Solve it with tighter modeling and ownership.
How to think about scaling early
There are two scaling levers every founder should understand.
Vertical scaling means giving a single system more power. In warehouse terms, that usually means more compute per workload. This is often the quickest way to handle growth or improve performance, but it can raise costs quickly if teams use it as the default answer to every slow query.
Horizontal scaling means distributing work across more nodes, clusters, or partitions. This usually supports resilience and larger workloads better over time, but it requires more deliberate system design. It's less forgiving of sloppy pipelines and poor data layout.
The right answer is rarely all one or all the other. A startup should design for sensible horizontal patterns where growth is predictable, then use vertical headroom selectively for peak workloads, launches, or urgent analysis windows.
Here's a simple decision frame:
Choose warehouse-first if your priority is dependable business reporting and a lean team.
Choose lake-oriented storage if your data variety is already high and analytics is only one consumer.
Choose a lakehouse-style path if you know you need both governed analytics and flexible technical exploration.
What doesn't work is copying an enterprise reference architecture from a much larger company. Founders do this constantly. They buy complexity before they buy consistency.
Strategies for Scaling and Cost Control
A startup usually notices analytics cost problems after a specific moment. The Monday board dashboard runs late. Product asks why yesterday's funnel is missing. Finance sees the warehouse bill jump again. The stack did not suddenly break. The team let convenience become architecture.
Cost control starts with one rule. Every recurring workload needs an owner, a performance expectation, and a reason to exist. Without that discipline, warehouses absorb bad habits well enough to hide them for months. Then growth turns those habits into real spend.
Where cloud costs usually go wrong
The expensive pattern is familiar. Analysts stack one more dashboard on top of a slow model. Engineers keep full-refresh jobs because they are easier to reason about than incremental logic. Business teams hit the same large tables from BI, notebooks, reverse ETL, and AI workflows, all on shared compute. Nothing looks catastrophic in isolation. Together, they create noisy queues, failed jobs, and bills that rise faster than usage.
The fix is not “buy a bigger warehouse” every time performance slips. That works for a while, and it is often the right short-term move during a launch or close cycle. It also hides poor data layout, weak model boundaries, and workloads that should never share compute in the first place.
A better operating model is straightforward:
Split workloads by business priority. Executive reporting, scheduled transformations, product analytics, and exploratory analysis should not fight for the same resources.
Use incremental processing where the data shape allows it. Full rebuilds are easy to ship and expensive to keep.
Track cost by query pattern and team behavior. Find the dashboards that trigger large scans, the jobs that rerun after failure, and the users who repeatedly hit raw tables.
Tier storage on purpose. Hot data earns premium performance. Old snapshots and low-value history do not.
Set query guardrails early. Limits on concurrency, scan size, refresh frequency, and warehouse auto-scaling prevent one team's habits from becoming everyone's bill.
Standards matter here because they cut waste before anyone opens the finance spreadsheet. Clear naming, model ownership, refresh policies, and warehouse rules make analytics cheaper to run and easier to trust. This guide to data warehouse best practices is a useful reference when you are setting those rules.
Why traditional BI still drives hidden cost
The software bill is only part of the problem. Traditional BI creates a second cost center. Human translation.
A founder asks for pipeline by segment. Sales wants the same metric by territory. Marketing wants paid vs. organic definitions aligned to campaign reporting. An analyst rewrites SQL, patches a dashboard, explains edge cases in Slack, and becomes the interface between the business and the data. The warehouse may be scaled correctly, but decision-making still bottlenecks around a small number of people.
That is why I push startups to evaluate file-system-based and AI-native access patterns earlier than they expect. When the semantic layer, model definitions, and query context are structured so an agent can work with them directly, the data team stops spending its best hours on repetitive translation. Tools like Querio fit this shift well because they reduce dependence on a dashboard-first workflow and give teams a path to self-service without hiring a large reporting function.
How data team responsibilities should change
The operating model has to change with the stack. A small team cannot afford to spend most of its time answering the same question in five formats.
Traditional responsibility | Modern responsibility |
|---|---|
Pull ad hoc numbers for other teams | Build trusted self-serve access paths |
Write one-off SQL for recurring questions | Encode reusable metrics and models |
Fix dashboards after users find inconsistencies | Prevent inconsistencies with governance and testing |
Spend most time answering tickets | Spend more time improving infrastructure and standards |
Operator's view: If your strongest analyst spends the week copying metric logic between dashboards, you do not have a reporting problem. You have an interface problem.
This shift also affects hiring. Teams that invest in better data interfaces can stay lean longer and focus hires on platform, modeling, and reliability instead of constant ticket volume. If you are benchmarking the kind of infrastructure talent that supports this transition, Underdog.io AI jobs gives a useful view of how the market is defining these roles.
Building the Team to Run Your Infrastructure
Monday starts with a board metric request. By Tuesday, sales wants a pipeline cut that excludes partner-sourced accounts. Product asks why activation dipped for one segment, and finance wants the number reconciled to billing. If one analyst is still the only way to get answers, the stack is not the bottleneck. The interface is.
Startups hit this wall early. A capable first data hire often ends up owning reporting, metric definitions, dashboard cleanup, warehouse modeling, and every urgent Slack question. The result is predictable. Response time slows, trust drops, and the team spends more time translating business questions than improving data quality.
The team design that avoids the human API trap
The fix is not hiring more people to fill the queue. It is assigning clear ownership for the work that keeps the system reliable and reusable.
Someone has to own ingestion, orchestration, and warehouse health. Someone has to own transformation logic, tests, and metric consistency. Someone has to work with product, finance, and go-to-market leaders on definitions, adoption, and access patterns. In an early-stage company, one person may cover two or three of those jobs. The functions still need explicit ownership.
That shift changes what “good” looks like for a data team. Strong teams spend less time hand-building answers and more time creating governed paths to answers. In practice, that means reusable models, tested metrics, documented assumptions, and interfaces that let business users explore approved data without opening a ticket every time.
This is also where AI-native, file-system-based workflows change hiring plans. If the stack supports governed self-service well, the team does not need to scale linearly with question volume. Tools built around that model, including systems discussed in AI agents fulfilling self-service analytics, reduce the need for analysts to act as translators between raw tables and business teams. A startup can stay lean longer and put scarce hiring budget into data quality, modeling, and platform reliability instead of report production.
If you're hiring around this model, it helps to look beyond traditional analytics job descriptions. You'll see the market increasingly asking for infrastructure-minded AI roles. This example of Underdog.io AI jobs is useful less for the specific opening and more for what it signals about where platform expectations are heading.
Data Team Roles Traditional vs Modern Infrastructure
Role/Function | Traditional Model (The "Human API") | Modern Model (The "Infrastructure Enabler") |
|---|---|---|
Analyst | Pulls ad hoc reports and rebuilds similar views for each team | Defines metrics, validates business logic, and improves trusted datasets |
Analytics engineer | Often absent or buried inside analyst work | Owns transformation layers, tests, and semantic consistency |
Data engineer | Focuses only on pipelines and storage | Partners on reliability, access patterns, orchestration, and platform standards |
Business stakeholder | Submits requests and waits in queue | Uses governed self-service tools and explores approved data directly |
Data lead | Manages requests and prioritizes backlog | Designs the operating model, governance, and self-service adoption |
One hard trade-off is timing. Hiring too early creates idle specialization. Hiring too late turns the data function into a support desk. For many startups, the practical path is one strong builder who can handle warehouse basics and modeling, then a second hire who adds either analytics engineering depth or business-facing analytics leadership, depending on where the friction is worst.
Avoid the reflex to add more dashboard builders. That usually increases dependency, because every team learns that custom requests are the fastest way to get answers. A better hire is the person who can remove repeated work, tighten data contracts, and set up systems where approved questions no longer require analyst intervention.
Beyond Dashboards with Self-Serve AI Agents
It's Monday morning. The founder wants to know why activation dropped for one customer segment after last week's product change. Marketing wants the same cut by campaign. Finance wants to see whether the drop affects expansion revenue. If the only path to an answer is “ask the analyst,” the stack is already under strain.
Traditional BI handles recurring reporting well. It gives teams a stable view of KPIs, weekly trends, and board metrics. The problem shows up on the next question, the one nobody modeled in advance. Startups ask those questions every day.

Why dashboards stop short
Dashboards are a fixed interface. Someone has to decide the dimensions, filters, definitions, and drill paths before the user arrives. That works for monitoring. It breaks down during investigation, where a team needs to test a hypothesis, inspect edge cases, join context across functions, and keep asking follow-up questions until the answer is clear.
That limitation creates the human API bottleneck. Product, sales, and finance teams keep routing basic analytical work through a small data team because the interface only supports prebuilt questions. The cost is not just slower turnaround. Analysts spend their time rewriting similar queries, copying logic across reports, and translating business intent instead of improving models and data quality.
AI-native self-service changes the interface, not just the presentation layer. Instead of forcing every question through a dashboard or SQL queue, teams can work against governed warehouse data through file-system and notebook-based workflows, with AI agents helping generate queries, explain logic, and assemble lightweight analyses. That approach is what makes self-service realistic for startups without a large analytics org.
A useful example is AI agents for self-service analytics. The important shift is operational. Business users get more freedom to explore approved data, while the data team keeps control over metric definitions, access boundaries, and underlying models. Querio is one product built around that pattern.
Static dashboards still have a place. They are good at tracking known metrics. They are a poor interface for unknown questions.
A practical rollout checklist
Do not replace everything at once. Start where analyst queues are longest and the business question changes every week.
Separate monitoring from investigation
Keep dashboards for recurring metrics, team reviews, and executive reporting.
Move exploratory work into an AI-assisted workflow where users can ask follow-up questions without filing a ticket.
Set hard boundaries on trusted data
Expose approved datasets first.
Publish metric definitions, table ownership, and access rules before opening broader self-service.
Choose one workflow with cross-functional demand
Good first candidates include activation analysis, funnel drop-off investigation, cohort behavior, or pipeline conversion by segment.
These use cases usually reveal whether your current BI layer is helping users think or just helping them view.
Measure reduction in analyst dependency
Track which requests no longer require manual query writing.
If the same questions still bounce back to analysts, the issue is usually weak semantic definitions or unclear access controls, not lack of training.
Train users on judgment
Show teams how to start from approved metrics, inspect assumptions, and escalate when the model itself needs to change.
Self-service works when users know the limits of the system, not when they are given unlimited access.
After the initial rollout, it helps to show users what this interaction model looks like in practice.
The goal is not to retire every dashboard. It is to remove the bad choice between waiting on an analyst and making decisions from an ungoverned spreadsheet.
Your Implementation and Migration Roadmap
Most analytics rebuilds fail because teams try to do everything at once. They migrate tools, redesign models, rewrite dashboards, and retrain users in a single motion. That's too much change for one project. A better roadmap reduces risk by sequencing the work around trust and adoption.
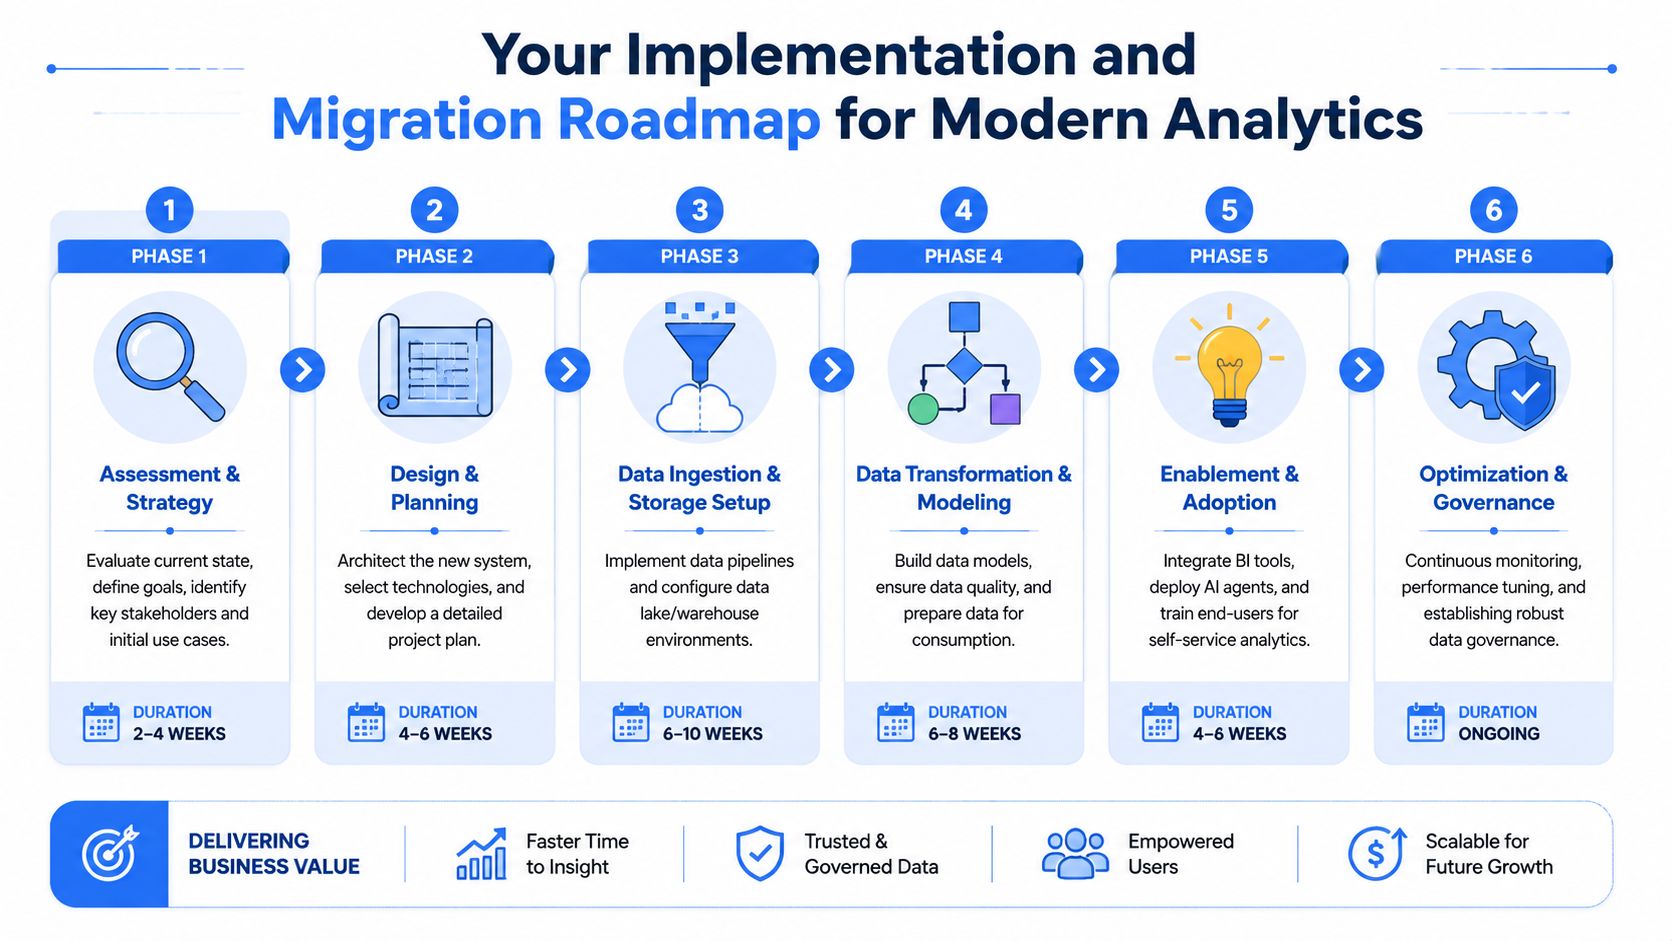
A phased path that works
Start with assessment and strategy. List the decisions the business needs to make regularly, then map the data systems those decisions rely on. Don't begin with vendor demos. Begin with business questions, current bottlenecks, and trust failures.
Move next to design and planning. Define your central data environment, ingestion approach, transformation ownership, governance rules, and access model. Keep the first version narrow. If you try to model every department perfectly, nothing ships.
Then handle ingestion and storage setup. Bring core systems into a central environment first. In most startups, that means product, CRM, billing, and marketing data. Once that base exists, build transformation and modeling around a small set of metrics that matter across teams.
After that, focus on enablement and adoption. Many projects stall at this stage. The stack may be technically sound, but teams keep going back to spreadsheets because nobody changed behavior. Train users on where trusted data lives, what definitions mean, and which workflows are self-serve versus escalated.
Finish with optimization and governance as an operating discipline, not a cleanup phase.
Review access regularly. Permissions drift as teams grow.
Retire unused assets. Old dashboards and stale models create confusion.
Watch query behavior. Usage patterns reveal where your design is helping or hurting.
Refine interfaces. Add dashboards, notebooks, or AI workflows based on actual demand, not assumptions.
A founder's goal isn't a perfect architecture diagram. It's a working analytics infrastructure that gives the company faster answers with less manual dependency. If you build for trust, reuse, and self-service from the start, the stack will stay useful as the company grows.
If your team is stuck in report queues and static dashboards, Querio is one option for moving to warehouse-native, self-serve analytics with AI coding agents and notebook-style workflows. It's designed for teams that want to reduce analyst bottlenecks without building a large data org first.

