Ad Hoc Reporting Definition A Guide for Modern Teams
Unlock the power of your data with this clear ad hoc reporting definition. Learn to ask specific questions and get instant answers without waiting on IT.
https://www.youtube.com/watch?v=Am9WwybfL44
published
Outrank AI
ad hoc reporting definition, self service BI, on demand reporting, business intelligence, data analytics
349add39-4db8-4992-95e8-ecd2708c6679

Think of ad hoc reporting as your business's very own "on-demand" button for data. It's the ability to create a specific, one-off report to answer a question that just popped into your head.
Instead of waiting for the standard weekly sales report to come out, you can instantly investigate why sales dipped last Tuesday. Or, if customer support tickets suddenly spike, you can build a report on the spot to figure out what’s going on.
What Is Ad Hoc Reporting Really

Here's a simple analogy. When you need to find the nearest gas station, you don't pull out a pre-printed road atlas from last year. You ask your GPS for a specific, real-time answer. That’s exactly what ad hoc reporting does for your business data—it gives you a custom answer right when you need it, not days later.
This power is a game-changer. It means teams no longer have to submit a ticket to the data department and wait in a queue. With the right tools, people in finance, product, or operations can explore the data themselves. This self-service approach breaks down those frustrating data bottlenecks and helps build a culture where curiosity drives faster, smarter decisions.
The core idea is simple: empower people with the tools to answer their own questions, right when they think of them. This accelerates problem-solving and uncovers opportunities that might be missed while waiting for a standard report.
This move toward on-demand insights is no longer a luxury; it's a necessity. The global Business Intelligence Software market is expected to hit US$29.51 billion in revenue by 2025, a trend fueled by the demand for tools that deliver immediate answers.
Ad Hoc Reporting At a Glance
So, what are the key characteristics that really define this approach? Understanding these traits helps clarify its unique role in your overall data strategy.
This table breaks down the essentials for a quick overview.
Characteristic | Description |
|---|---|
On-Demand | Reports are generated as needed to answer specific, timely business questions. |
User-Driven | Typically created by business users (e.g., product managers, marketers) without IT help. |
Specific Focus | Designed to answer a single, targeted question rather than provide a broad overview. |
Flexible Format | The layout, data, and visualizations are customized for the specific inquiry. |
In short, it's about speed, specificity, and user empowerment. If you want to dig deeper into the analytical process that powers these reports, you can learn more about what ad hoc analysis entails in our detailed guide.
Why Ad Hoc Reporting Matters Now More Than Ever
In a market that moves at lightning speed, you simply can't afford to wait. When you need data, you need it now. Waiting days—or even a week—for a critical report isn’t just an annoyance; it’s a business risk. A small fire can become an inferno in that time.
This is precisely where ad hoc reporting changes the game. It’s about shifting from slowly reacting to problems to proactively getting ahead of them.
Imagine a product manager, Sarah, who starts her morning by noticing a sudden, alarming dip in user engagement. The old way? She'd have to file a ticket with the data team, get in line, and hope they could dig into it by Friday. By then, who knows how many users would have churned.
From Data Bottlenecks to Immediate Action
Instead, Sarah turns to her ad hoc reporting tool. She can ask a direct question right then and there, in plain English: "Which user segment from our last feature launch is showing the lowest engagement?" In seconds, a custom report appears on her screen, pointing straight to the problem. The drop-off is almost entirely from users on a specific type of mobile device.
Armed with this instant insight, she has concrete evidence to share with the engineering team before their daily stand-up even kicks off. This isn't just a story about convenience. It’s a fundamental shift in how businesses can operate, closing the gap between a critical question and a clear answer.
The real power of ad hoc reporting is transforming a culture of waiting into a culture of knowing. It empowers the people closest to the problem to find the solution the moment it arises.
This also solves a massive operational headache for data teams—the dreaded "ad-hoc request tsunami." For many analysts and data engineers, a staggering 60-70% of their time is spent chasing down these one-off requests. Giving business users the power to find their own answers frees up your data experts to focus on much bigger, more strategic work. To see how this plays out across different departments, you can explore this detailed overview of ad hoc reporting use cases.
Choosing the Right Tool for the Right Question
Not all data reports are created equal. When you're trying to build a solid data strategy, it’s crucial to understand the difference between ad hoc reports, dashboards, and those classic "canned" reports. Each one is designed to answer a different kind of question, and knowing which one to grab will save you a ton of time and frustration.
Think of it like different ways of getting around.
Canned, static reports are like the city bus schedule. They're reliable, predictable, and perfect for routine checks, but they won’t help you if you need to make an unexpected detour.
Dashboards are like the dashboard in your car. They give you a real-time, high-level view of your most important metrics—your speed, your fuel level, your engine temperature. You can see how things are going at a glance, but it won't tell you why the check engine light just came on.
That’s where ad hoc reporting shines. It’s your GPS. When you have a specific, urgent question—like finding the fastest route to a new address right now—you pull it out, ask your question, and get a custom-built answer on the spot. It’s designed for digging deep into a particular problem that just popped up.
This decision tree shows exactly how a real-world business problem flows into a specific question that ad hoc analysis can answer, ultimately leading to a useful insight.
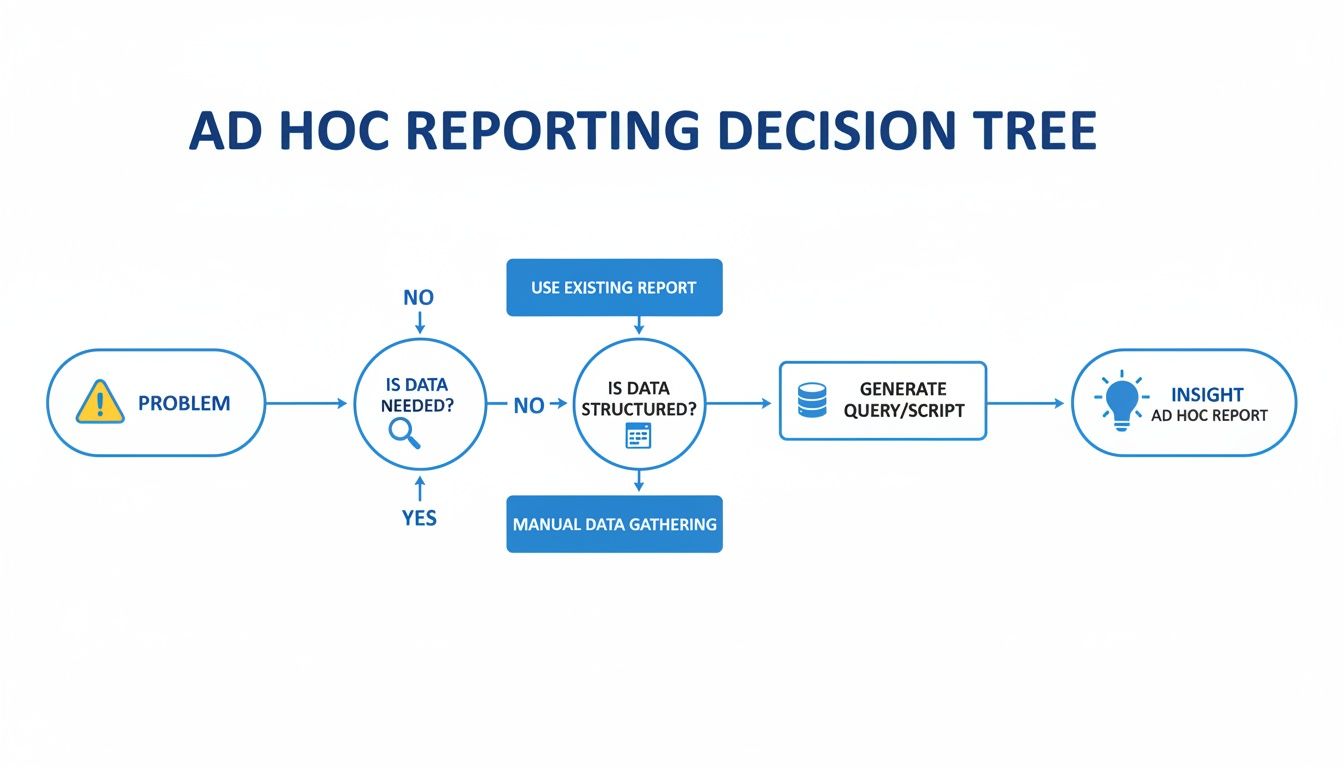
As you can see, the process directly links a pressing business need to a data-driven solution, giving teams the clarity they need to act fast.
Ad Hoc Reports vs Dashboards vs Canned Reports
So, when should you use each tool? Let's get specific. Each format has its place, and they often work together to give you a complete view of what’s happening in the business. For a deeper dive into the software behind these reports, check out this comprehensive business intelligence tools comparison.
To make it simple, here’s a head-to-head comparison.
Aspect | Ad Hoc Reports | Dashboards | Canned Reports |
|---|---|---|---|
Purpose | To answer a specific, one-time question and explore "why" something happened. | To monitor key performance indicators (KPIs) and track goals in real time. | To provide consistent, standardized information on a recurring schedule. |
User | Business users, analysts, and managers who need to investigate an issue. | Executives, team leads, and anyone needing a quick performance snapshot. | Anyone needing routine operational updates (e.g., daily sales figures). |
Flexibility | Highly flexible and customized for a unique, immediate need. | Moderately flexible with interactive filters but predefined metrics. | Inflexible and follows a fixed format and schedule. |
In short, canned reports cover your routine updates, dashboards give you the high-level overview, and ad hoc reports are your go-to for investigating anything that falls outside the norm.
How Different Teams Use Ad Hoc Reporting

The real magic of ad hoc reporting happens when you see it in action across different departments. It’s what lets teams move beyond generic dashboards and ask the specific, burning questions they have right now. Data stops being a static picture and becomes an interactive tool, letting anyone chase down a hunch or validate a strategy on the fly.
Instead of waiting for the next quarterly review to find out what's going on, teams can react to shifts in the market or customer behavior in minutes. That kind of agility is what separates the businesses that lead from those just trying to keep up.
Product Management Questions
For a product manager, everything comes down to user engagement and feature adoption. They live and breathe the "why" behind user actions. Ad hoc reporting lets them drill down into specific behaviors, pulling real-time feedback to shape the product roadmap with actual data, not just educated guesses.
"What's the adoption rate of our new feature among users who signed up in the last 30 days?"
"Show me the exact user journey for customers who churned within a week of that last big update."
"Which step in our onboarding flow has the highest drop-off rate for people using Android devices?"
Operations and Support Inquiries
Operations and support teams are all about efficiency and stamping out problems. When a process hits a snag or a new issue pops up, they need to find the root cause yesterday. Ad hoc queries are their best friend, helping them slice and dice support tickets, inventory levels, or performance logs to pinpoint exactly what went wrong.
"Pull all support tickets related to billing this quarter and tell me their average resolution time."
"Which warehouse has the biggest spike in shipping delays over the last 48 hours?"
"Let's correlate the recent increase in app crashes with specific device models and operating systems."
Finance and Marketing Analysis
Finance and marketing are glued to the numbers that determine ROI and budget allocation. The huge boom in ad hoc reporting is directly linked to the growth of market research services—a sector projected to jump from USD 93.37 billion in 2025 to USD 110.77 billion by 2029. This isn't surprising. These teams need immediate answers to questions that directly impact the bottom line. You can read the full research on the market's expansion to see just how big this trend is.
"Compare our customer acquisition cost (CAC) in North America versus EMEA last month."
"What was the final cost-per-acquisition (CPA) for our holiday social media ad campaigns?"
"Give me a breakdown of our monthly recurring revenue (MRR) by customer segment and geography for Q2."
When you give every department the power to ask its own questions, you build a culture of proactive, data-informed decision-making. Suddenly, everyone on the team has the ability to turn raw data into direct, meaningful action.
The Upside (and Potential Downsides) of Ad Hoc Reporting
When you bring ad hoc reporting into the fold, you’re essentially giving your teams a direct line to the answers they need, right when they need them. This ability to pivot and react to market changes on the fly is a game-changer. Decision-making becomes faster and smarter across the entire organization.
Another huge plus? It takes a massive load off your dedicated data and IT teams. Instead of being bogged down by an endless queue of small report requests, they can finally get back to the big-picture, strategic projects that really move the needle.
This kind of self-service access to data naturally builds a stronger data-driven culture. It encourages curiosity because people know they can actually get an answer. Teams start digging deeper, spotting trends, and solving problems before they even escalate. We cover this in more detail in our guide to the benefits and challenges of self-service business intelligence.
How to Dodge the Common Pitfalls
Of course, with great power comes great responsibility. Unlocking data access without a solid plan can lead to some serious headaches.
The biggest risk? The classic "dueling spreadsheets" problem. This is where the marketing team and the sales team show up to a meeting with reports that tell two completely different stories, all because they pulled slightly different data or used mismatched metrics. Trust in the data evaporates instantly.
Poor data quality is often the culprit. In fact, many organizations run into major challenges of marketing data quality that make reliable reporting a constant struggle. The only way to prevent this chaos is to have a single, governed source of truth—one place where everyone knows the data is clean, consistent, and trustworthy.
To keep things running smoothly, you need a few guardrails in place:
Create a Single Source of Truth: This is non-negotiable. Build a centralized, well-maintained data model that acts as the foundation for every report, ensuring everyone is singing from the same hymn sheet.
Set Up Clear Governance: Not everyone needs access to everything. Implement clear user permissions and access controls to protect sensitive data and guide users to the information that’s relevant to their roles.
Pick the Right Tools: A clunky, complicated BI platform will just gather dust. Choose a tool that’s powerful enough for your data experts but intuitive enough for your business users to actually want to use it.
A Practical Guide to Self-Service Analytics
Rolling out self-service analytics successfully is all about laying the right groundwork. If you just open the floodgates without a plan, you'll end up with a mess. Different teams will pull conflicting numbers, and instead of data-driven clarity, you'll have data-fueled confusion. The idea is to empower people, not bury them in chaos.
It all starts with creating a single source of truth. This isn’t just some tech jargon; it's the absolute first thing you have to get right. By building one clean, central data model, you make sure that when a product manager and a finance lead both ask about revenue, they see the exact same number. That consistency is what builds trust in your data.
Building a Framework for Success
Once your data is in one place, you need to think about governance. Not everyone in the company should see everything. Setting up clear user permissions and access controls is critical for protecting sensitive information and making sure people are only seeing the data that's actually relevant to their jobs.
With that foundation in place, you can start picking the right tools. The best self-service platform in the world is useless if nobody uses it, so you need something that feels intuitive. Look for features that make it easy for non-technical folks to jump in and get answers:
Natural Language Queries: Let users ask questions in plain English, no code required.
Intuitive Visualizations: Simple drag-and-drop interfaces for building charts and graphs on the fly.
Built-in Security: Compliance with standards like SOC 2 isn't just a bonus; it’s a must-have for protecting your company and customer data.
These features are table stakes now. They help you build a secure, scalable data culture where everyone can feel confident participating. For a complete walkthrough, our beginner's implementation guide to self-service analytics offers a more detailed roadmap.
Getting your internal setup right is the key to unlocking bigger data applications. To get a glimpse of where this is all heading, it’s worth exploring advanced trends like the future of customer service analytics and predictive insights, which show just how powerful this kind of data exploration can be.
Answering Your Ad Hoc Reporting Questions
So, you've got the basic definition down. But what does ad hoc reporting actually look like in practice? Let's dig into the common questions that pop up when teams start thinking about bringing this into their daily workflow.
Who Actually Uses Ad Hoc Reporting?
You might think this is just a tool for data analysts, but that’s an outdated view. In reality, ad hoc reporting is most valuable for teams on the front lines who need to make quick, informed decisions.
Product and Marketing Teams: These folks are constantly asking questions. Why did sign-ups drop last Tuesday? Which new feature is getting the most use? They need to dig into user behavior and campaign performance on the fly to figure out what to do next.
Operations and Finance: When a key metric suddenly goes haywire—like a spike in customer support tickets or a weird dip in revenue—these teams need to investigate now. Ad hoc reporting lets them slice the data to find the root cause of the problem.
Founders and Executives: High-level dashboards are great for a snapshot, but leaders often need to understand the "why" behind the numbers. Ad hoc reports help them drill down and get the context they need for big strategic calls.
Essentially, it's for anyone who looks at a dashboard and immediately asks, "Wait, what's going on here?"
Do You Need to Know SQL?
Not anymore, and that's a huge deal. A decade ago, if you wanted a custom report, you probably had to find an analyst or engineer to write a SQL query for you. This created a massive bottleneck.
Modern BI platforms have completely changed the game. With no-code interfaces and natural language query tools, you can often just ask a question in plain English, like, "Show me sales by region for last quarter." The software handles the technical part, translating your question into code and pulling the data back for you.
This shift is what makes a truly data-driven culture possible for everyone, not just the tech-savvy.
How Does It Fit into a BI Strategy?
Ad hoc reporting doesn't replace your standard dashboards—it works right alongside them.
Think of it this way: your dashboards are like the instrument panel in your car. They give you a constant, high-level view of your speed, fuel, and engine temperature. They're perfect for at-a-glance monitoring.
Ad hoc reporting is your GPS. You turn to it when a warning light flashes on your dashboard and you need to investigate a specific problem or find a new route. It’s the tool you grab for a deep-dive analysis when a standard KPI just doesn't tell the whole story.
Ready to empower your teams with on-demand insights? Querio's AI-powered platform lets anyone ask questions in natural language, get instant answers, and build reports without writing a single line of code. Transform your data from a bottleneck into your biggest asset.

