Guide
A B Testing Platform: A Modern Team's Guide
Learn how an A B testing platform helps modern teams run experiments, analyze results, and ship data-driven decisions. Boost your conversion rate today.

Your growth team launches a checkout experiment on Monday. By Friday, the dashboard reports a convincing lift, the product manager drafts the rollout message, and the experiment owner starts preparing a celebratory slide. Then an analytics engineer joins the review, queries the warehouse, and finds that the assignment table tells a different story. The exposure records are incomplete, the user identity mapping differs from the product database, and the estimated treatment effect no longer supports the launch decision.
That situation is more common than most platform demos suggest. The hard part of experimentation isn't moving a slider from control to treatment. It's preserving a trustworthy chain from assignment, to exposure, to metric calculation, to decision. An A/B testing platform should therefore be evaluated as a data pipeline and governance system first, and as a polished interface second.
The category has become substantial. The global A/B testing software market reached approximately USD 850.2 million in 2024, following historical growth at a 9.6% CAGR from 2020 to 2025, with a projected 14% CAGR from 2024 to 2031, according to market data summarized by SHNO. That expansion reflects a shift from occasional conversion optimization toward routine product experimentation. It also raises the cost of choosing a platform that can produce attractive charts but can't reproduce the underlying result.
Table of Contents
- When the Dashboard Says Yes and the Warehouse Says No
- What an A B Testing Platform Actually Is
- Core Architecture Behind a Modern Experimentation Stack
- How Product and Data Teams Evaluate Platforms
- Integrating an A B Testing Platform With Your Data Pipeline
- Running an Experiment From Hypothesis to Decision
- When A B Testing Is the Wrong Tool for the Job
- A Practical Checklist Before You Sign the Contract
When the Dashboard Says Yes and the Warehouse Says No
The experiment looked clean at first. A growth team had changed the checkout sequence, split eligible users between the existing experience and the new flow, and watched the primary conversion metric climb in the vendor dashboard. The result appeared decisive enough for a rollout discussion.
During the review, the analytics engineer rebuilt the analysis from the warehouse. The assignment table showed a different population from the dashboard. Some users had an assignment record but no exposure event. Others had multiple identifiers, so their treatment assignment couldn't be joined reliably to the purchase event. The dashboard's result and the warehouse result weren't competing interpretations of the same data. They were analyses of different datasets.
That distinction matters. A dashboard can calculate a result from the events it receives, but it can't repair an exposure event that never fired, a user key that changed between sessions, or a metric definition that differs between the experiment and the finance model. The warehouse usually contains the broader business context needed to determine whether the test population was eligible, whether treatment was delivered, and whether the outcome definition matches the team's approved metric.
Practical rule: If the platform's result can't be reconstructed from exported assignment and exposure records, it isn't yet a decision system. It's a reporting surface.
This is why experimentation analysis belongs alongside warehouse reporting rather than inside an isolated marketing interface. Teams building a reliable reporting layer can use data warehouse reporting practices to compare platform outputs with canonical business models, inspect joins, and preserve the logic behind a decision.
The reconciliation questions that matter
Before anyone asks whether the interface is intuitive, ask:
- Assignment: Which stable identity received each variant, and under what eligibility rule?
- Exposure: Did that identity encounter the treatment?
- Metric: Does the platform calculate the outcome from the same event and time window used by the warehouse?
- Population: Are bots, employees, internal accounts, and excluded cohorts handled consistently?
- Replayability: Can an analyst rerun the result after the experiment closes?
The central failure isn't necessarily a bad statistical method. It's often a broken data lineage. A platform that randomizes users correctly but loses exposure events can still produce a persuasive, unusable number. A beautiful experiment editor can't compensate for identity resolution that breaks at login, device switching, or server-side rendering.
What an A B Testing Platform Actually Is
An A/B testing platform coordinates four functions that feature flag systems often separate or omit. It assigns eligible users to variants, records actual treatment exposure, estimates the treatment effect, and maintains shared definitions for the metrics used to judge the result.
The first function is a randomization service. It should assign users deterministically, so the same user remains in the intended variant when the experiment requires stickiness. The assignment record needs an experiment identifier, a variant identifier, an identity key, eligibility context, and a timestamp that downstream systems can interpret.
The second is exposure logging. Assignment doesn't prove that a user saw a treatment. A server can assign a variant before a request fails, a client can receive a flag after the page has rendered, or a user can become ineligible before the experience appears. Exposure events capture the treatment delivery that supports causal analysis.
The third is a statistics engine. It should calculate treatment effects, uncertainty, and diagnostic checks under documented assumptions. A feature flag can answer, “Which configuration should this user receive?” It doesn't automatically answer, “Did this configuration cause a change in the primary metric?”
The fourth is a metrics registry. This layer defines metrics such as activation, retained usage, revenue, or checkout completion in a form that product, data, and finance teams can share. Without a registry, two dashboards can use the same metric name while counting different events, users, or time windows.
Platform and flag system compared
| Capability | A/B Testing Platform | Feature Flag System |
|---|---|---|
| Variant assignment | Assigns users for controlled comparison | Toggles a configuration or release |
| Exposure semantics | Records treatment delivery for analysis | May record evaluations without proving exposure |
| Statistical inference | Computes treatment effects and uncertainty | Usually outside the core flag function |
| Metric definitions | Maintains experiment-ready metric references | Often depends on external analytics |
| Guardrails | Supports primary and safety metrics | Usually requires separate monitoring |
| Warehouse analysis | Exports assignment and exposure data for replay | May export flag events, but causal context can be limited |
This distinction becomes especially important when teams move beyond two variants or need a structured comparison of multiple treatments. A focused resource on how to validate product changes with A/B/n testing is useful because the same exposure and inference requirements become harder to manage as variant combinations expand.
A modern platform may support web visual editors, server-side SDKs, or product experimentation workflows. Tools in the Optimizely category often emphasize web experiences, while platforms such as Statsig, GrowthBook, and Eppo are commonly evaluated for product and engineering use cases. This guide focuses on the latter category, where assignment, telemetry, warehouse integration, and statistical governance matter more than editing page copy in a browser.
Core Architecture Behind a Modern Experimentation Stack
A reliable stack has four layers. Each layer creates a different engineering trade-off, and the trade-offs are more consequential than the interface shown in a sales demo.
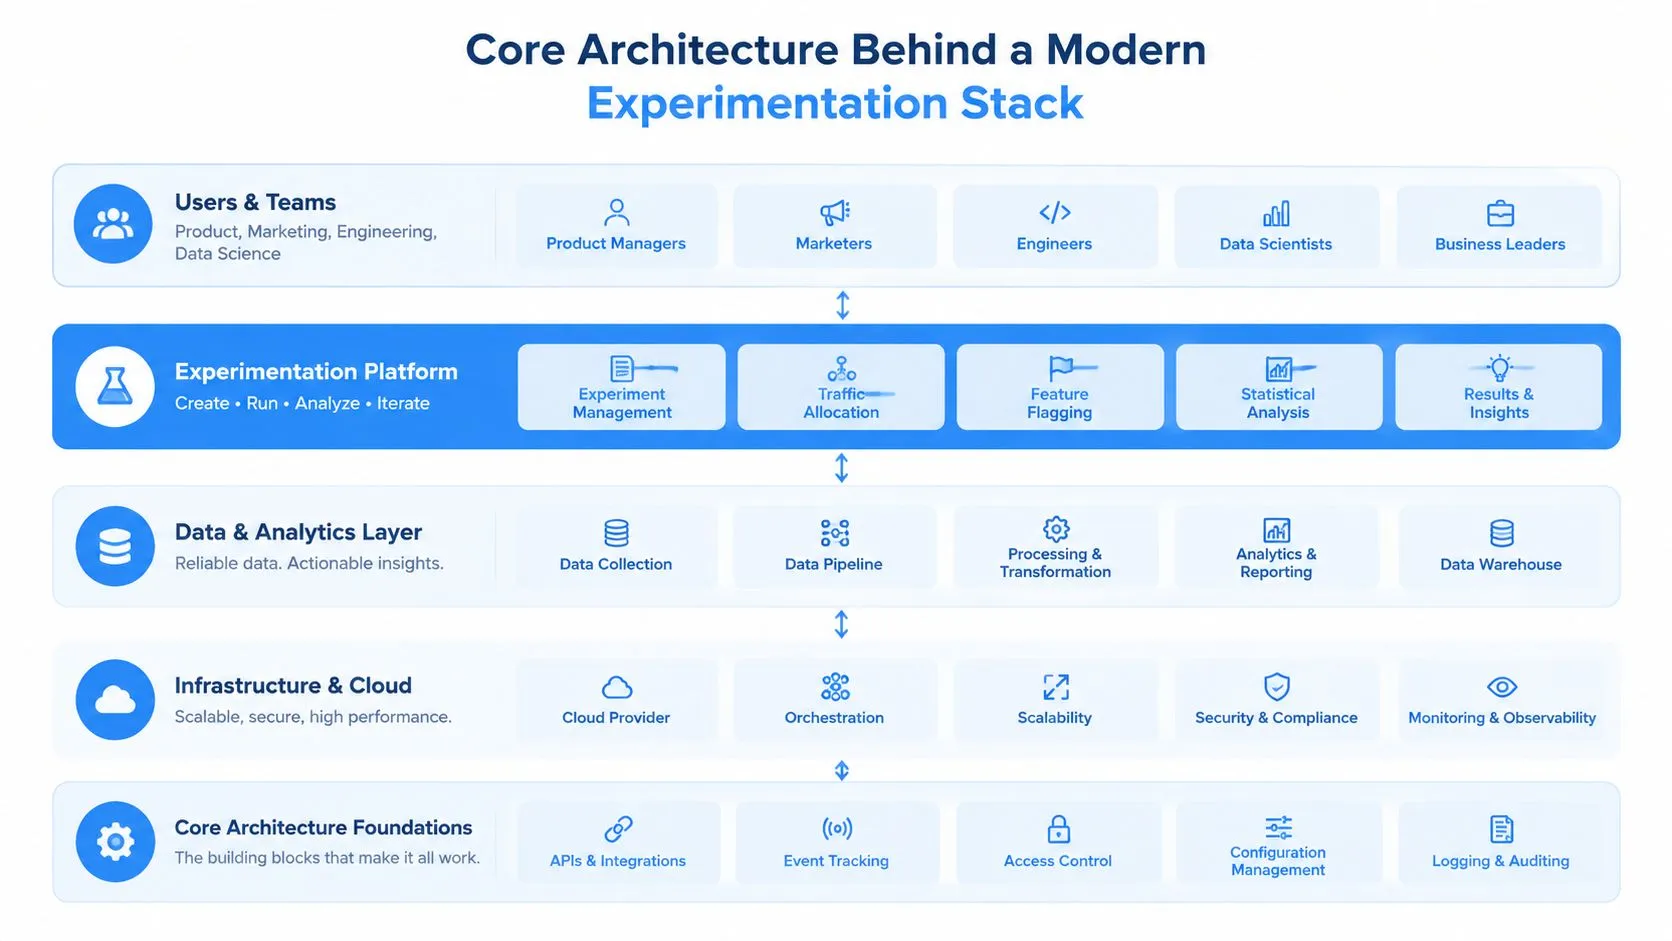
The SDK layer chooses where decisions happen
The client or server SDK evaluates eligibility and retrieves an assignment. Client-side evaluation can support fast iteration on web interfaces, but it introduces concerns around bundle size, page timing, and the availability of an assignment before the experience renders. Server-side evaluation gives engineering more control over sensitive logic and non-UI surfaces, but it adds dependency on service availability and request latency.
Mobile applications create another constraint. A user may remain offline, use a cached configuration, or receive an assignment before the latest experiment definition reaches the device. The platform must make that behavior explicit. Otherwise, analysts may treat stale assignments as current exposures.
The assignment service controls identity and stickiness
The assignment layer determines how users enter variants. Deterministic hashing can keep an identity in the same treatment across sessions, while salt management determines whether two experiments are independent or accidentally correlate. Re-randomization may be useful for some lifecycle designs, but it can also contaminate interpretation if the platform changes a user's assignment during an active test.
Identity resolution deserves its own design review. A browser identifier, account identifier, device identifier, and server user key may all refer to one person, but they don't automatically join together. Teams should document which identity controls randomization and how the platform handles anonymous-to-authenticated transitions.
The statistics engine turns events into evidence
The statistics engine determines how the platform handles uncertainty, sequential monitoring, and variance reduction. Frequentist and Bayesian approaches can both be valid when their assumptions and stopping rules are documented. The dangerous option is an opaque system that allows users to repeatedly inspect a metric, stop when the result looks favorable, and present the final chart as if the stopping process had no effect.
Variance reduction can improve sensitivity without changing the treatment assignment. CUPED uses pre-experiment covariates to adjust outcomes, reducing estimator variance without biasing the treatment-effect estimate. Microsoft Research reports that CUPED can reduce variance by about 50%, which can effectively double statistical power or halve required traffic or duration, as described in the CUPED research paper.
Warehouse synchronization preserves the audit trail
The warehouse layer receives assignment, exposure, metric, and diagnostic data. It enables reconciliation in Snowflake, BigQuery, or Databricks, where analysts can compare platform calculations with canonical models and inspect sample-ratio mismatch or stop-loss conditions.
Most vendor demos spend their time on the SDK and interface. The operational risk sits in the assignment service, statistical rules, and warehouse export. Teams evaluating developer documentation for SEO already understand the value of inspectable implementation details. Experimentation buyers should apply the same standard. Documentation should show schemas, retry behavior, identity handling, and export guarantees, not only screenshots of result cards.
How Product and Data Teams Evaluate Platforms
The three common platform archetypes solve different problems.
A vendor SaaS platform usually offers the quickest path to a managed workflow. The provider operates the assignment service, dashboard, permissions, and statistics layer. The trade-off is dependency. If exposure data, metric definitions, or experiment history can't be exported in a usable form, the team may discover that switching vendors requires rebuilding its historical analysis.
An open-source platform gives engineering teams more control over deployment and extension. That control can be valuable when privacy, infrastructure, or custom statistical methods matter. It also transfers responsibility for upgrades, reliability, security patches, documentation, and on-call support to the adopting organization.
A warehouse-native platform keeps more analysis close to the data models the company already trusts. This can reduce duplication between product analytics and experimentation, but it may require more work to deliver low-latency assignments and application-safe evaluation paths.
Score the architecture, not the demo
| Criterion | Vendor SaaS | Open-Source | Warehouse-Native |
|---|---|---|---|
| Statistical rigor | Often packaged and accessible, but inspect stopping rules | Customizable, with more implementation responsibility | Strong fit for custom analysis, with application integration work |
| Governance | Provider features may include roles and audit history | Depends on the deployment and internal controls | Can align closely with warehouse permissions and lineage |
| Warehouse fit | Varies by export quality and latency | Depends on connectors and engineering effort | Usually central to the design |
| Operational burden | Lower infrastructure ownership | Higher internal ownership | Shared between data and product engineering |
| Portability | Must be verified contractually | Typically more inspectable | Usually strong if schemas remain under team control |
The platform's “AI-powered” tier deserves separate scrutiny. An audit of 14 platforms found that 71% heavily marketed AI, while 58% of AI features were chat wrappers, 37% represented new capabilities, and 5% were fully agentic, according to the Marketers Index analysis of AI in A/B testing. Those figures don't prove that a particular vendor's feature is weak, but they do provide a useful evaluation filter.
Ask what the AI changes. Does it generate a draft hypothesis, detect a sample-ratio mismatch, select a metric, recommend a stop rule, or execute a rollout? A natural-language assistant can save time, but it shouldn't obscure the variance model or make an unsupported “winner” decision.
Vendor test: Ask the representative to show the raw exposure schema, the metric definition, the stopping policy, and the warehouse export before asking for an AI demonstration.
Integrating an A B Testing Platform With Your Data Pipeline
Integration should begin with the identity model, not the JavaScript snippet. Before installing an SDK, define the user key that analysts already trust and document how anonymous visitors become authenticated users. If the platform assigns by device while the warehouse reports by account, the team needs a deliberate bridge between those grains.
The implementation should then follow the path an experiment takes through the product.
- Install the evaluation path. Decide whether the assignment happens in the browser, on the server, in a mobile client, or across multiple surfaces. Keep the decision close enough to the experience that exposure can be recorded accurately.
- Emit assignment and exposure events. An assignment event records the allocation. An exposure event records the delivered treatment. Don't collapse them unless the product behavior guarantees that assignment means exposure.
- Resolve identity. Map the platform key to the user model used by analytics, billing, customer success, and finance. Preserve the original identifiers so analysts can debug failed joins.
- Create the exposure table. Store experiment ID, variant ID, stable user key, exposure timestamp, eligibility context, and schema version. Add fields required for later diagnostics rather than relying on a dashboard export.
- Sync to the warehouse. Streaming feeds can support low-latency monitoring, while batch loads offer reproducibility and controlled transformation. Many teams need both, but they shouldn't confuse a fast dashboard with a complete historical record.
Within the first month, analysts will usually ask for two fields before they ask for a more elegant interface: a stable user_key and an unambiguous variant_id. If either field changes meaning across products or over time, the team can't reliably reconstruct who belonged to which treatment.
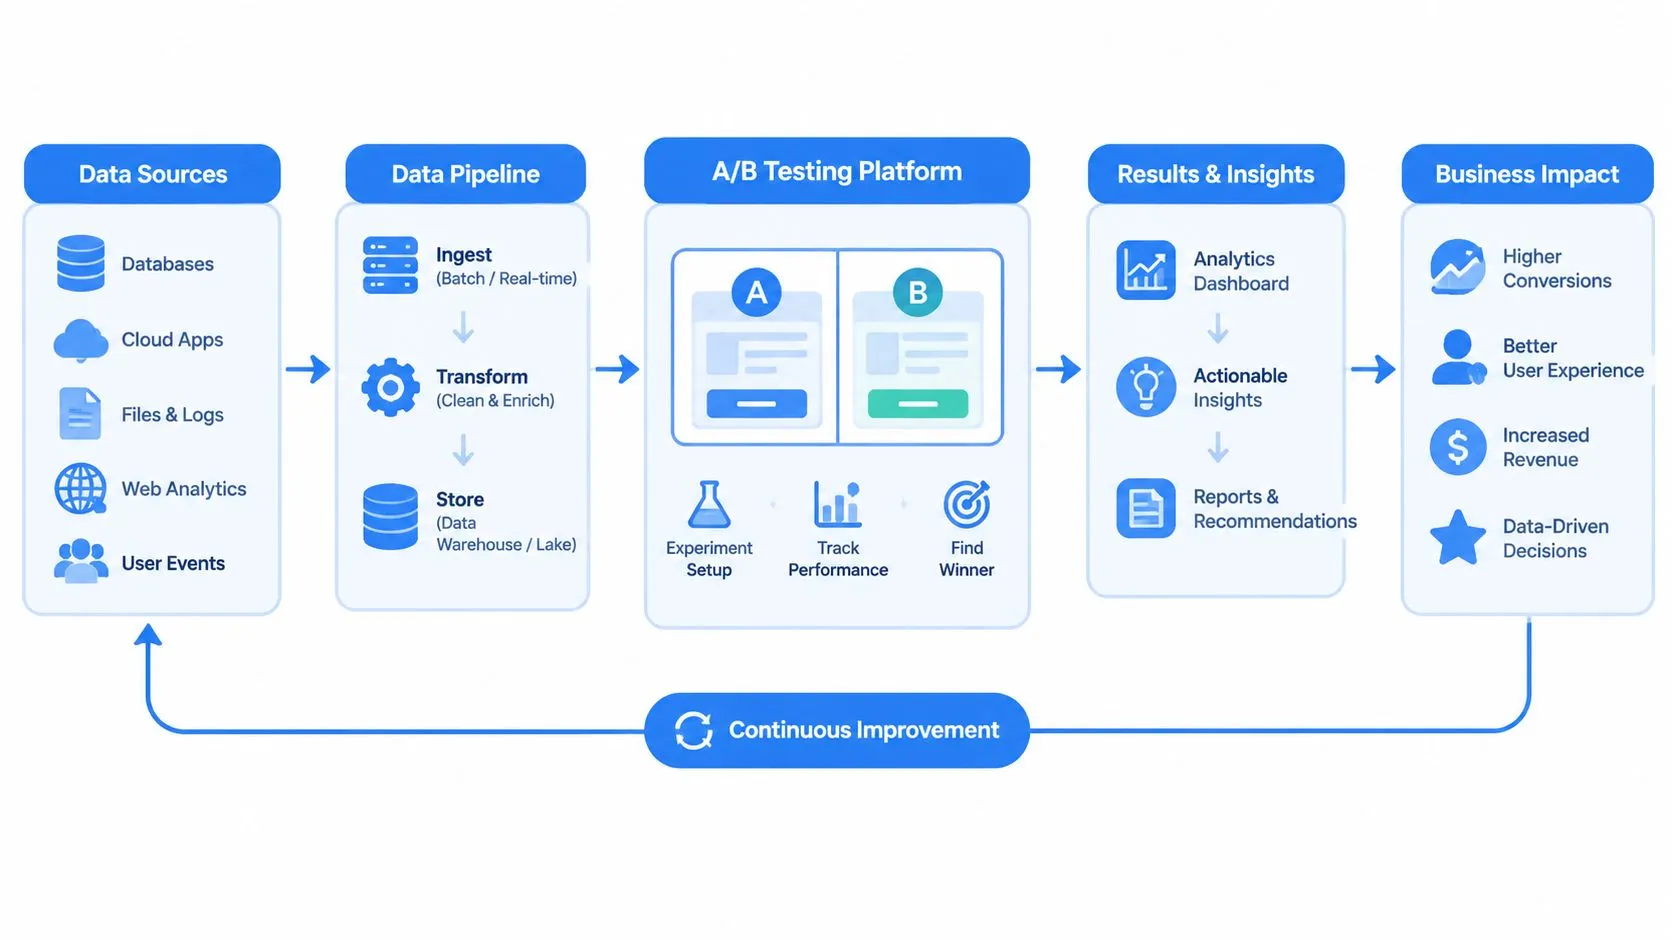
The integration failure that survives launch
The most persistent failure is an assignment table that exists inside the platform but never reaches the warehouse. The product team can view a result, yet analysts can't join it to orders, subscriptions, support contacts, or retention models. When the business later challenges the decision, the team has no independent path to reproduce it.
A separate architecture review should cover warehouse tooling and lineage, including data pipeline tools for analytics teams. The objective isn't to send every raw event everywhere. It's to preserve the specific records needed to validate eligibility, exposure, outcomes, and exclusions without asking the vendor to rerun history.
Running an Experiment From Hypothesis to Decision
An experiment becomes auditable when every stage produces an artifact. The platform supports the workflow, but the team owns the reasoning.
Start with a registered question
Write the hypothesis before opening the visual editor. State the mechanism, the population, the primary metric, the expected direction, and the conditions that would make the change unsafe. Link the hypothesis to the metric registry rather than typing a free-form metric name into the experiment screen.
A useful pre-registration entry should identify the control, treatment, eligibility rule, exposure event, primary outcome, guardrails, and intended analysis method. A short consultation on hypothesis testing explained can help teams separate a testable prediction from a general product preference.
Protect the interpretation
Estimate whether the available traffic and expected effect can support a useful decision. If the smallest effect worth acting on is too subtle for the population or time available, the answer isn't to keep checking the dashboard until a favorable result appears. The team should change the question, choose a more sensitive metric, use a variance-reduction method where appropriate, or select another research design.
CUPED-style adjustment belongs here, before the result becomes a rollout argument. If pre-experiment behavior predicts the outcome, the statistics engine can use that covariate to reduce noise while preserving an unbiased estimate, provided the implementation and assumptions are documented.
Diagnose before deciding
The exposure-table query should check assignment balance, missing exposure records, duplicate exposure, identity joins, metric completeness, and sample-ratio mismatch. A result with a strong point estimate but a broken population isn't a strong result.
The decision memo should include the treatment estimate, uncertainty, primary metric, guardrail movements, data-quality findings, and a clear action. The action may be ship, hold, iterate, or stop. It shouldn't be reduced to a single p-value or a green label.
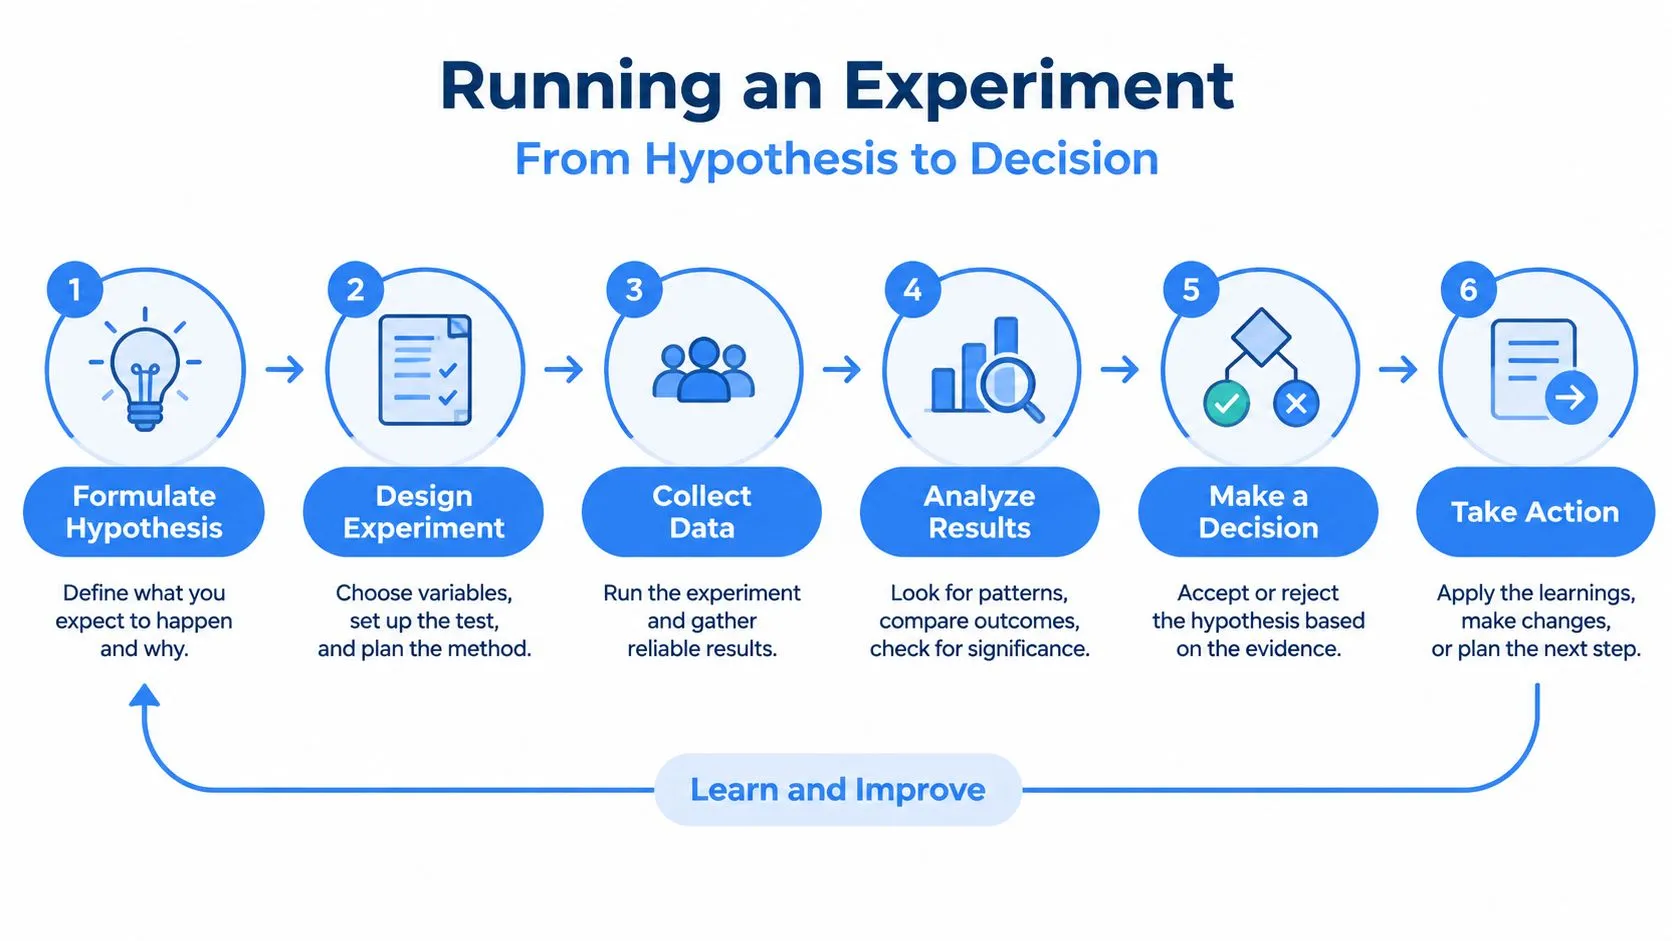
Decision standard: The platform's job is to produce a trustworthy lift estimate. The team still decides whether the change is valuable, safe, reversible, and strategically aligned.
This workflow also changes how teams interpret inconclusive tests. An inconclusive result can indicate insufficient sensitivity, a weak hypothesis, a noisy metric, or a real absence of meaningful effect. The platform should preserve enough evidence for the next decision rather than forcing every experiment into a winner-versus-loser narrative.
When A B Testing Is the Wrong Tool for the Job
A/B testing isn't the universal answer to a product question. It requires an identifiable population, a measurable outcome, credible exposure tracking, and enough information to distinguish a useful effect from ordinary noise. If telemetry is missing or the baseline doesn't exist, a randomized comparison may produce a precise-looking answer to the wrong question.
The practical blockers are substantial. A recent Ascend2 survey lists limited traffic for significance at 51%, lack of resources at 47%, and time-consuming execution at 38% among the leading A/B testing challenges, as reported in the Ascend2 A/B testing research. These constraints make method selection an operating decision, not a matter of preference.
Choose the design that matches the question
| Question Type | Best Method | When A/B Is Overkill |
|---|---|---|
| Does the concept solve a known user problem? | Interviews, usability research, prototype testing | Before the product has measurable baseline behavior |
| Is a feature safe to release gradually? | Feature flag rollout with monitoring | When the question is deployment risk, not causal impact |
| Does a marketplace change affect supply and demand together? | Switchback or holdout design | When user-level randomization creates interference |
| Did an operational change affect an existing outcome? | Causal analysis on observational data | When randomization wasn't feasible and historical data is rich |
| Does a mature product change improve a core metric? | Controlled A/B test | Rarely overkill when exposure and outcomes are reliable |
| Is the decision high-risk for trust or compliance? | Controlled rollout plus guardrails | It may be mandatory even when statistical power is limited |
Pre-launch products often benefit more from qualitative research than from a platform. A prototype can reveal comprehension problems before the team has enough real usage to estimate a stable behavioral effect. A holdout cohort can be more practical when the company needs a long-term comparison, while a switchback design can address situations where one user's treatment changes another user's experience.
The stakes also matter. A low-risk wording change may justify a confident ship when instrumentation costs more than the decision. Pricing, trust, safety, and compliance changes deserve controlled rollout discipline even when traffic is limited, because the purpose is not only to maximize statistical power. It is to limit exposure, monitor harm, and preserve a defensible record of what happened.
A Practical Checklist Before You Sign the Contract
Vendor evaluation should end with a live data test, not a feature checklist. Ask the vendor to replay an exposure stream into the warehouse, join it to a canonical metric, and reconcile the result with the dashboard. Use the warehouse your team operates, whether that's BigQuery, Snowflake, or Databricks.
Five areas deserve a hard requirement
- Statistical rigor: Confirm sequential-testing rules, peeking controls, CUPED or other variance-reduction support, confidence intervals, and sample-ratio mismatch detection. Ask for formulas and assumptions, not only a “confidence” badge.
- Pipeline fit: Verify assignment and exposure exports, stable identity handling, schema versioning, event replay, write-back behavior, and the ability to join platform records to canonical user and metric models.
- Governance: Look for role-based access, audit logs, experiment registries, PII controls, approval workflows, and explicit ownership of holdout groups.
- Operational cost: Clarify event-volume billing, debugging support, SDK failure behavior, assignment latency, data retention, and the work required to investigate a missing exposure event.
- Vendor risk: Test export portability, uptime commitments, security documentation, deployment options, and the practical fallback if the platform becomes unavailable or the contract ends.
A platform that can't pass a warehouse reconciliation should not pass procurement. During the evaluation, deliberately create a known edge case, such as an anonymous visitor who later authenticates, a repeated exposure, or a user excluded after assignment. See whether the platform records enough context to explain the outcome.
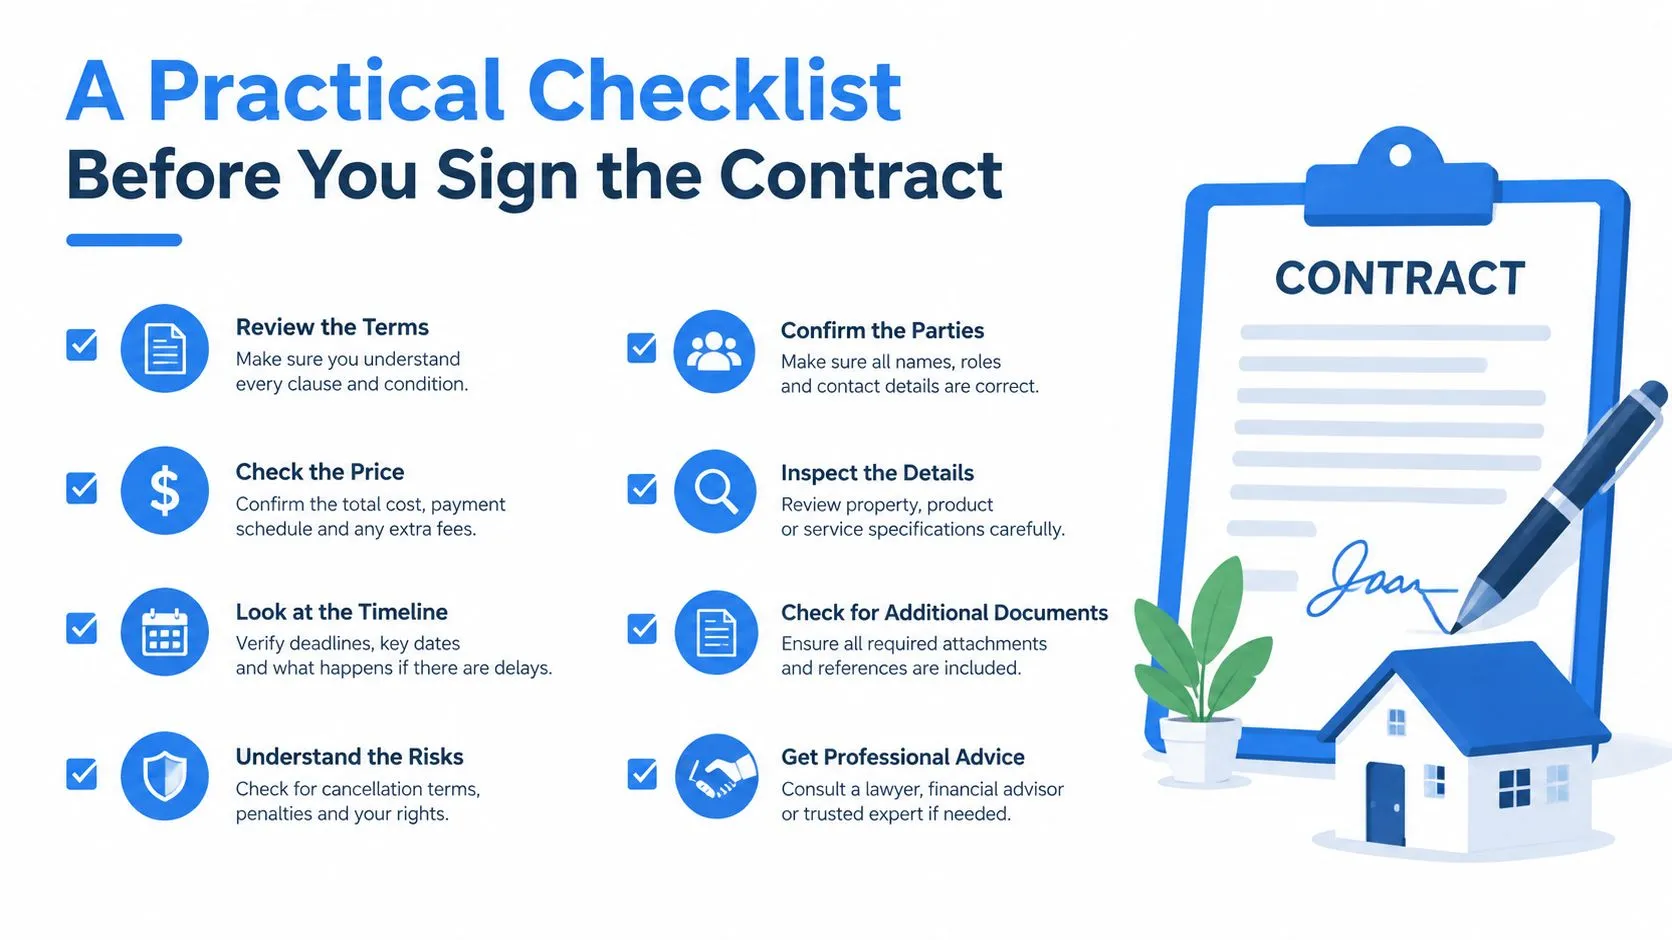
For broader software procurement criteria, the embedded analytics vendor selection guide offers a useful reminder: integration, governance, and portability should be evaluated as operating requirements, not decorative add-ons.
Finally, apply an AI-skepticism filter. Ask the vendor to demonstrate how an “auto-optimize” or “AI winner” feature behaves under noisy metrics, missing exposures, changing traffic, and an inconclusive result. If the answer is a recommendation without a documented statistical basis, treat it as workflow assistance, not experimentation intelligence.
Querio lets data teams analyze warehouse data through notebooks, including comparisons between test and control groups and metrics such as conversion rate or GMV. Visit Querio to see how a warehouse-centered workflow can support experiment reconciliation and self-serve analysis.