Business Intelligence
BigQuery native BI for startups that can't afford a full data stack
Build fast, low-cost BI on BigQuery: pay-as-you-go queries, BI Engine speedups, Looker Studio dashboards, and Querio governance.
Startups often struggle with expensive data systems. BigQuery offers a low-cost, serverless solution for managing and analyzing data without the need for heavy infrastructure or dedicated teams. Here’s why it works:
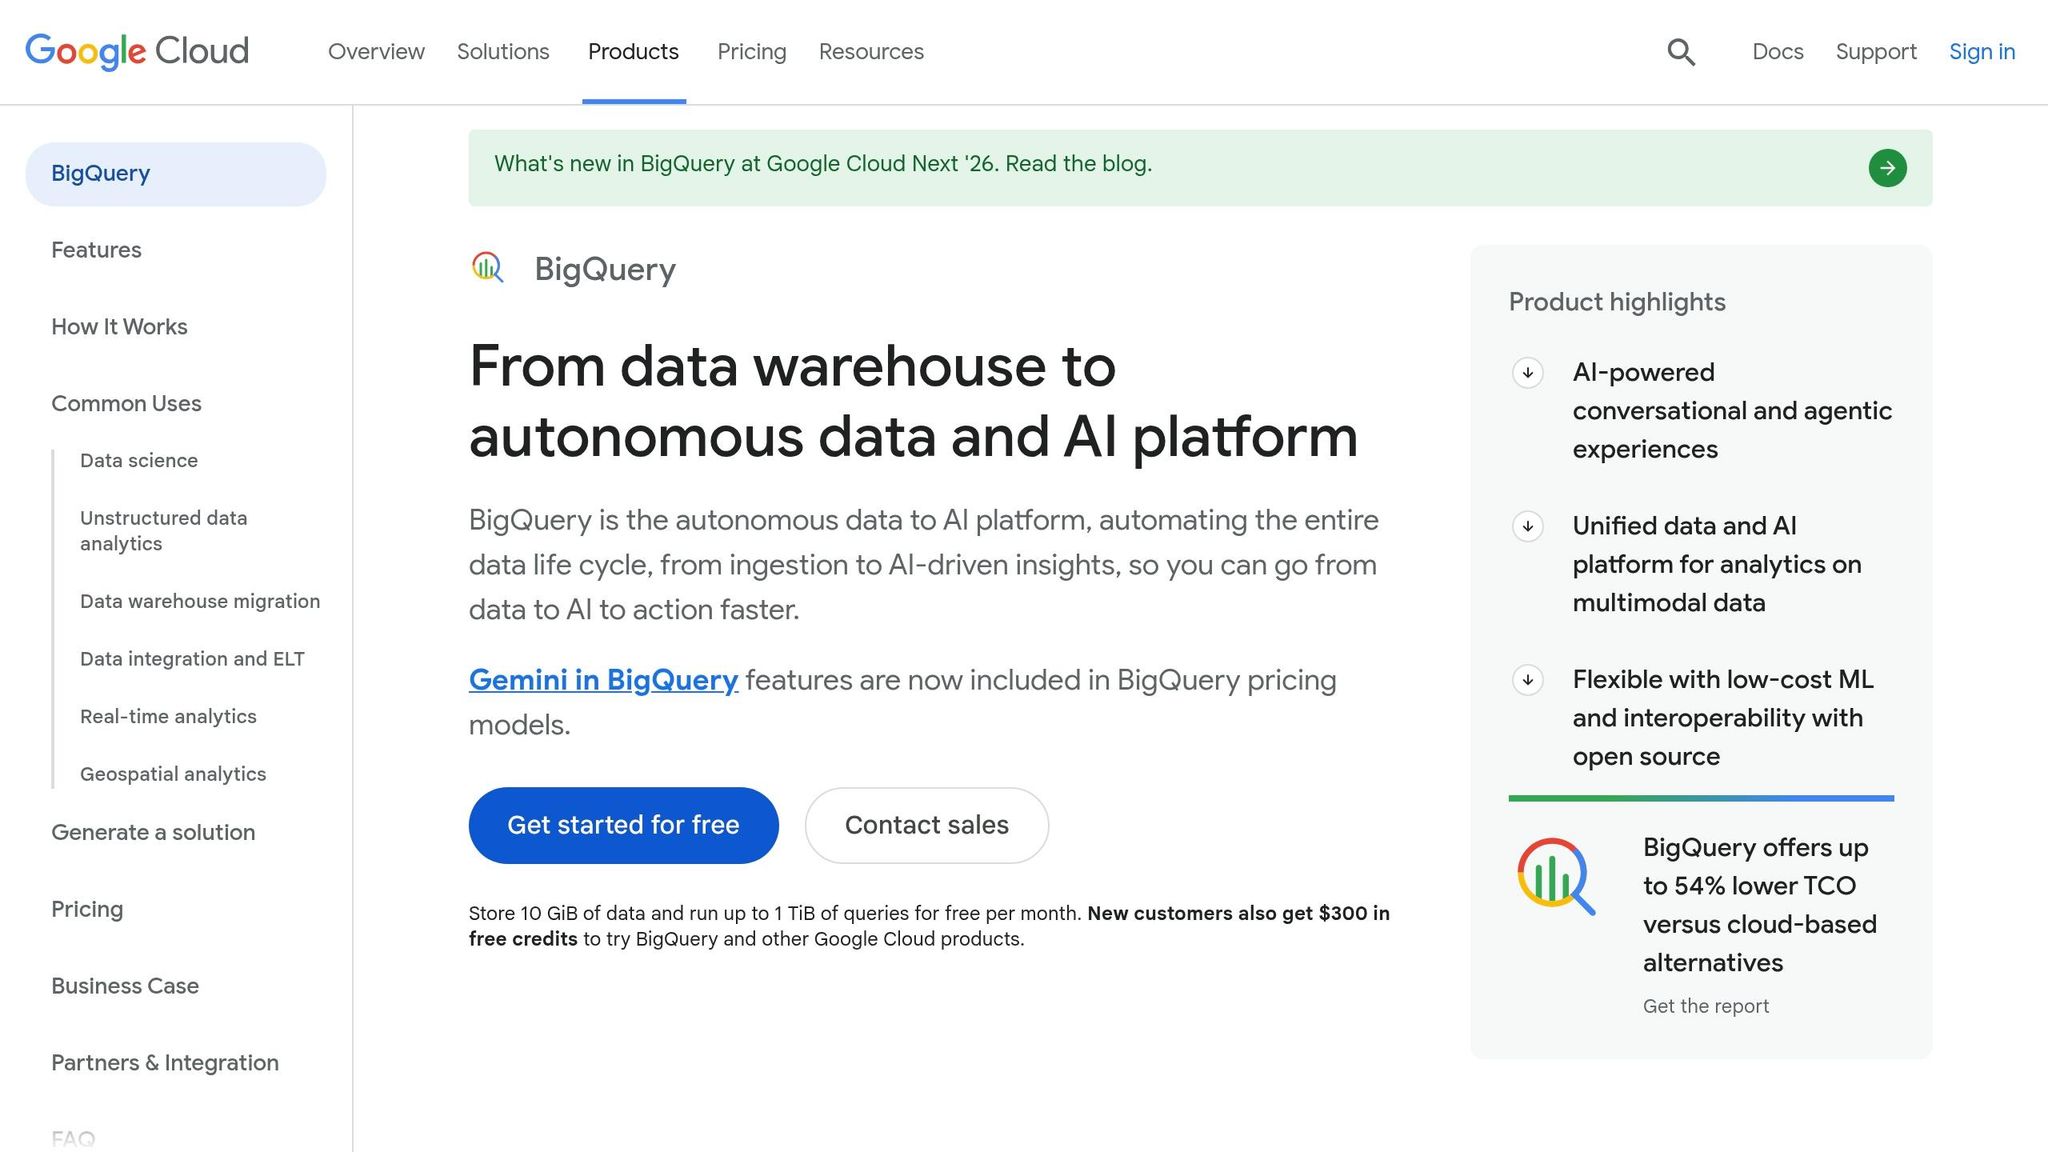
Pay-as-you-go pricing: Only pay for the data you query. The free tier includes 10 GB storage and 1 TB of query processing monthly.
Cost-saving features: Partitioning, clustering, and caching reduce query expenses by up to 90%.
Fast analytics:BI Engine boosts query speed and supports interactive dashboards for as little as $30/month.
Built-in tools: BigQuery supports advanced SQL, machine learning, and natural language queries, simplifying analytics for non-technical teams.
Visualization: Connect to Looker Studio for free, user-friendly dashboards. This makes it one of the best self-service analytics tools for lean operations.
With BigQuery, startups can scale their data capabilities without overspending. The article outlines a four-step roadmap to get started.
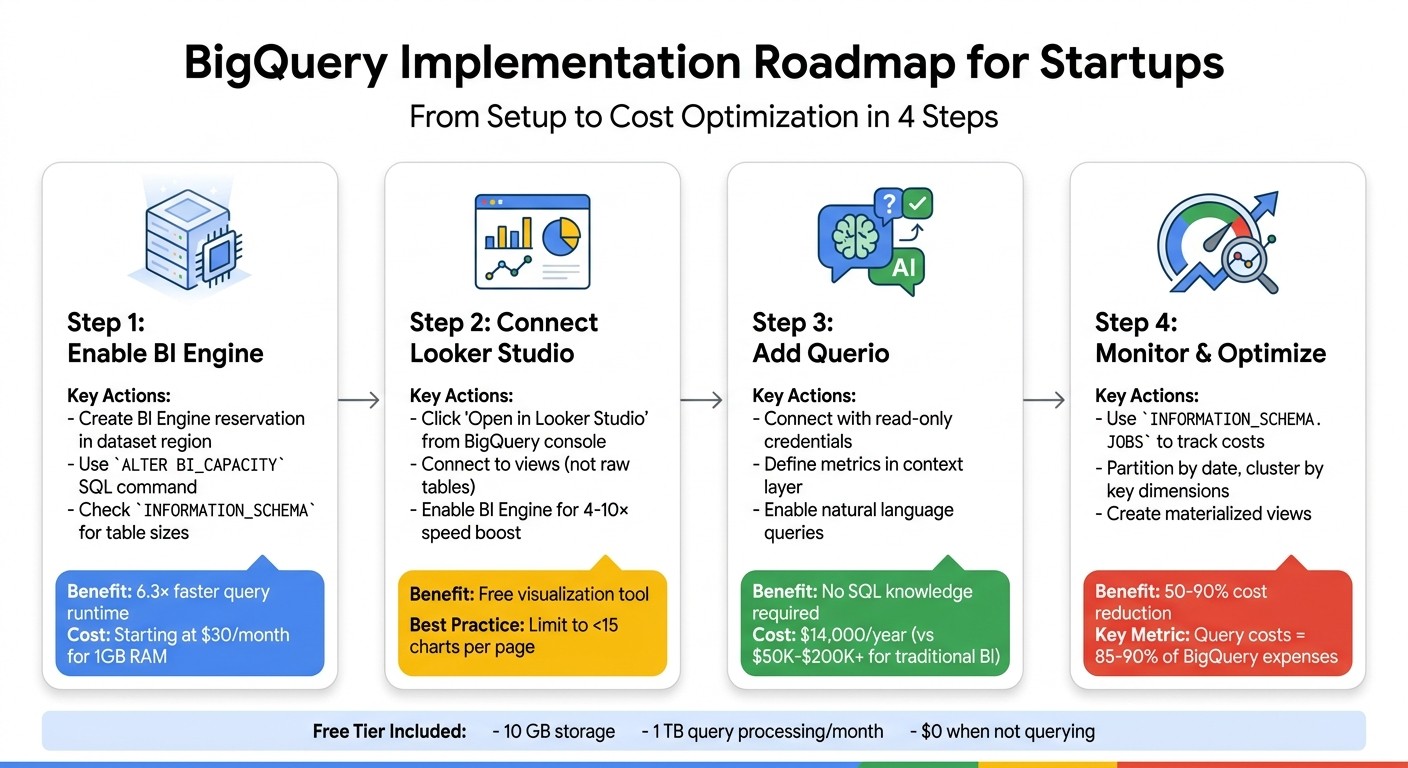
4-Step BigQuery Implementation Roadmap for Startups
Why BigQuery Works for Startup Budgets
Pay-As-You-Go Pricing Model
BigQuery’s pricing is designed with flexibility in mind, making it a great fit for startups. With its on-demand model, you’re only charged for the data your queries actually scan - no need to worry about provisioning servers or locking into long-term commitments. And when you’re not running queries? Costs drop to zero. Vince Gonzalez, Data & Analytics Engineering Manager at Google Cloud, sums it up perfectly:
"On-demand slots scale to zero when you're not querying, and it happens instantly. You don't need to wait for an inactivity timeout." [5]
Here’s how the pricing works: beyond the free tier, you’re charged $6.25 per terabyte scanned [4]. Thanks to BigQuery’s columnar storage, you only pay for the specific columns you query. For example, if you analyze just email addresses and signup dates from a larger table, you’re only billed for those two columns. Plus, before running a query, you can perform a "dry run" to estimate costs at no charge. To avoid unexpected expenses, you can also set daily quotas at the project level. This is especially helpful for preventing costly mistakes, like a poorly written query on a 10 TB table that could rack up $62.50 in just seconds [7][8].
This pricing structure, combined with BigQuery's free tier, makes it an affordable choice for startups looking to scale.
Free Tier and Affordable Scaling
The free tier in BigQuery is generous enough to cover many early-stage startups' needs. For instance, data that remains unchanged for 90 days is automatically moved to long-term storage, which costs about $0.01 per GB per month - half the price of active storage [6]. What’s great is that this transition happens automatically without affecting query performance.
BigQuery also offers additional ways to save. You can use the "Preview" tab to explore your tables for free, batch load data from Cloud Storage to avoid streaming insert costs, and take advantage of the 24-hour query cache, which lets you retrieve results at no extra charge.
These cost-saving features work hand-in-hand with BigQuery’s BI Engine, which boosts analytics performance.
BI Engine for Fast Analytics
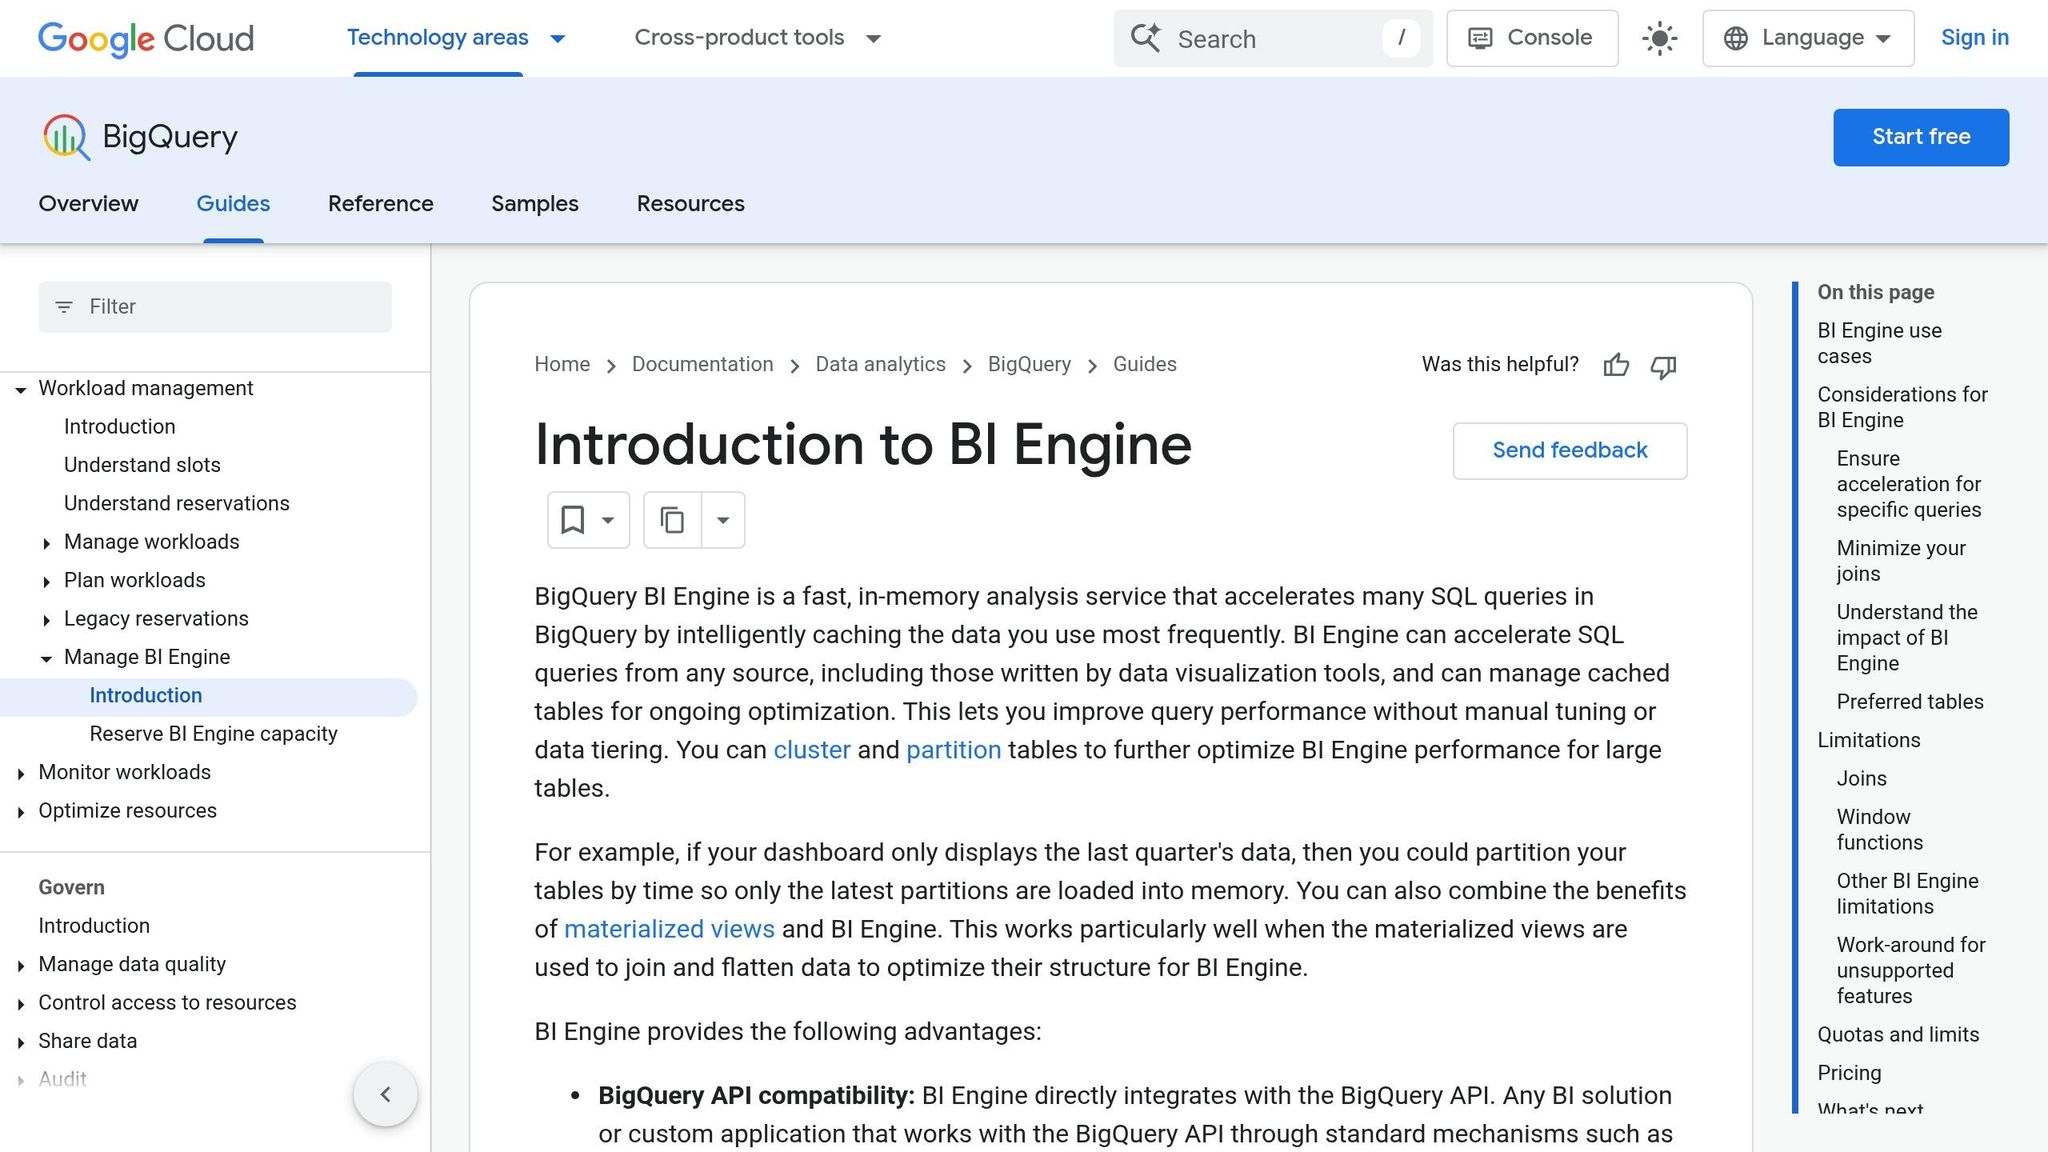
BI Engine is BigQuery’s in-memory acceleration service, and it’s a game-changer for startups needing fast, interactive dashboards. For as little as $30 per month, you can reserve 1 GB of RAM to achieve sub-second response times for reports [11]. Startups typically see query speeds improve by about 2×, with many responses clocking in under 200 milliseconds. Even better, BI Engine can reduce costs by 8× to 20× compared to on-demand processing [10].
Lak Lakshmanan, Director of Analytics & AI Solutions at Google Cloud, highlights its value:
"At $30-$300/month, additional BI Engine capacity is a very cost-effective way to make your BigQuery reservations go further, and get a speedup too." [10]
BI Engine takes care of caching automatically, and with table partitioning, it focuses on loading only the most recent data into memory. This ensures top-notch performance, even with modest BI Engine reservations [9].
Using BigQuery's Built-In Analytics Features
SQL Features for Data Analysis
BigQuery offers a range of SQL tools that go well beyond basic querying, making it a powerful choice for startups. One standout feature is materialized views, which precompute and store query results. BigQuery automatically rewrites incoming queries to use these precomputed results, delivering faster performance and reducing costs. Even better, these views update automatically, saving time and effort [13][14].
BigQuery also supports ARRAY and STRUCT data types, along with the JSON_EXTRACT_SCALAR function for parsing JSON data. This means you can analyze API responses and event streams directly, without the need for complex ETL pipelines [15][16]. For tasks like calculating running totals or rankings, window functions like LEAD() and LAG() eliminate the need for costly self-joins [17][3]. If speed is critical and slight imprecision is acceptable, APPROX_COUNT_DISTINCT provides results with 1% to 2% accuracy but is much faster than exact counts [13].
A particularly exciting feature is SQL-native machine learning. With CREATE MODEL statements, you can build models for predicting customer churn or forecasting demand directly in BigQuery - no need for Python environments or separate ML tools [12][1]. This integration simplifies workflows and avoids the extra costs of maintaining multiple infrastructures.
Optimizing these capabilities can lead to even greater cost savings.
Query Optimization and Caching
While BigQuery's advanced SQL features are impressive, managing query costs is especially important for startups. Understanding how BigQuery charges for queries is key. Data engineer Samarth Sinha explains:
"Bytes read is your primary cost lever - not query complexity, not JOINs, not UDFs. If you read fewer bytes, you pay less. Period." [13]
One of the most effective ways to cut costs is through partitioning and clustering. For example, Shopify once optimized a query projected to cost $949,000 per month. By clustering the columns used in their WHERE clauses, they reduced the bytes scanned from 75 GB to just 508 MB - a 150× improvement [3]. Implementing these techniques can slash BigQuery bills by 60% to 90% [13].
BigQuery's 24-hour query cache is another cost-saving tool. When a query hits the cache, results are returned instantly at no extra charge [18]. To maximize cache usage, ensure query text remains identical (even whitespace matters) and avoid non-deterministic functions like CURRENT_TIMESTAMP() [18]. Additionally, specifying columns instead of using SELECT * can reduce data processed by over 90% on wide tables [17][19].
Before running queries, use the --dry_run flag to check how many bytes will be processed [13][15]. To avoid accidental full-table scans, set the require_partition_filter = true option at the table level [3][19]. These simple steps can prevent costly mistakes.
AI and Machine Learning in BigQuery
On top of optimized queries, BigQuery's AI tools make advanced analytics accessible, even for startups without specialized expertise. One of the newest additions is Gemini integration, enabling natural language querying - what Google calls "vibe querying." As ML Engineering Manager Gautam Gupta puts it:
"This feature makes writing queries using natural language – 'vibe querying' – a reality." [21]
BigQuery also includes functions like AI.CLASSIFY and AI.SCORE, which simplify complex analyses. For instance, AI.CLASSIFY can map customer demographics and spending data to marketing personas without the need for lengthy rule engines or CASE statements [20]. Similarly, AI.IF enables semantic filtering, allowing you to identify transactions tied to "winter holidays" without manually coding date ranges [20].
For text analysis, AI.GENERATE_TEXT supports sentiment analysis, classification, and even content generation directly in SQL. This eliminates the need for Python scripts or external APIs [20]. In recent benchmarks using Gemini 2.5 Flash, BigQuery delivered strong accuracy at an average cost of just $0.55 per workload [20]. As Customer Engineer Ravish Garg aptly states:
"BigQuery isn't just storing your data anymore - it's understanding it." [20]
Building Dashboards with Looker Studio

Connecting Looker Studio to BigQuery
Connecting Looker Studio (formerly Data Studio) to BigQuery is a straightforward way to tap into BigQuery's analytic capabilities while keeping costs in check. The standard version of Looker Studio is free, making it a practical choice for startups comparing BigQuery BI tools. You can establish this connection by selecting a table or view, writing custom SQL, or using the "Explore with Looker Studio" button directly within BigQuery [22].
To optimize performance, connect Looker Studio to views in BigQuery rather than raw tables. For instance, in February 2026, OneUptime created a daily_sales_summary view that pre-aggregated key metrics. This setup allowed business users to create dashboards with metrics like unique_customers and revenue - no SQL required.
"The key to making self-service work is setting up the connection properly so users can build their own reports without needing help from the data team for every chart." [24]
For managing access, sharing reports using "Owner's credentials" ensures team members can view dashboards without needing individual Google Cloud IAM permissions. This simplifies access for non-technical users. To further enhance performance, enable BI Engine with at least 1GB of capacity. For example, in February 2026, OneUptime's team used a 2GB BI Engine reservation to support real-time event tracking with just 1-minute data freshness [25].
Now, let’s explore how Looker Studio makes self-service dashboards a reality.
Creating Self-Service Dashboards
Once the connection is set up, Looker Studio's drag-and-drop interface makes it easy for anyone to build interactive dashboards. Features like cross-filtering (where selecting a data point in one chart filters the entire dashboard), date range controls, and hover-over tooltips provide dynamic and detailed insights.
To maintain speed and manage costs, perform aggregations within BigQuery before visualizing data in Looker Studio. Using partitioned tables is another smart move - Looker Studio automatically detects date partitions and only queries the necessary data, which helps reduce costs. The BigQuery connector has a 2-million-row limit and caches results for around 15 minutes, though this can be adjusted for real-time needs.
For tracking costs, queries from Looker Studio are tagged with the job label "requestor:looker_studio", making it easier to monitor dashboard-related expenses in your BigQuery billing. Additionally, clicking the "Powered by BigQuery" icon on any chart reveals the SQL query, runtime, and slots used - giving you deeper insight into query performance and resource usage.
Extending BigQuery with Querio
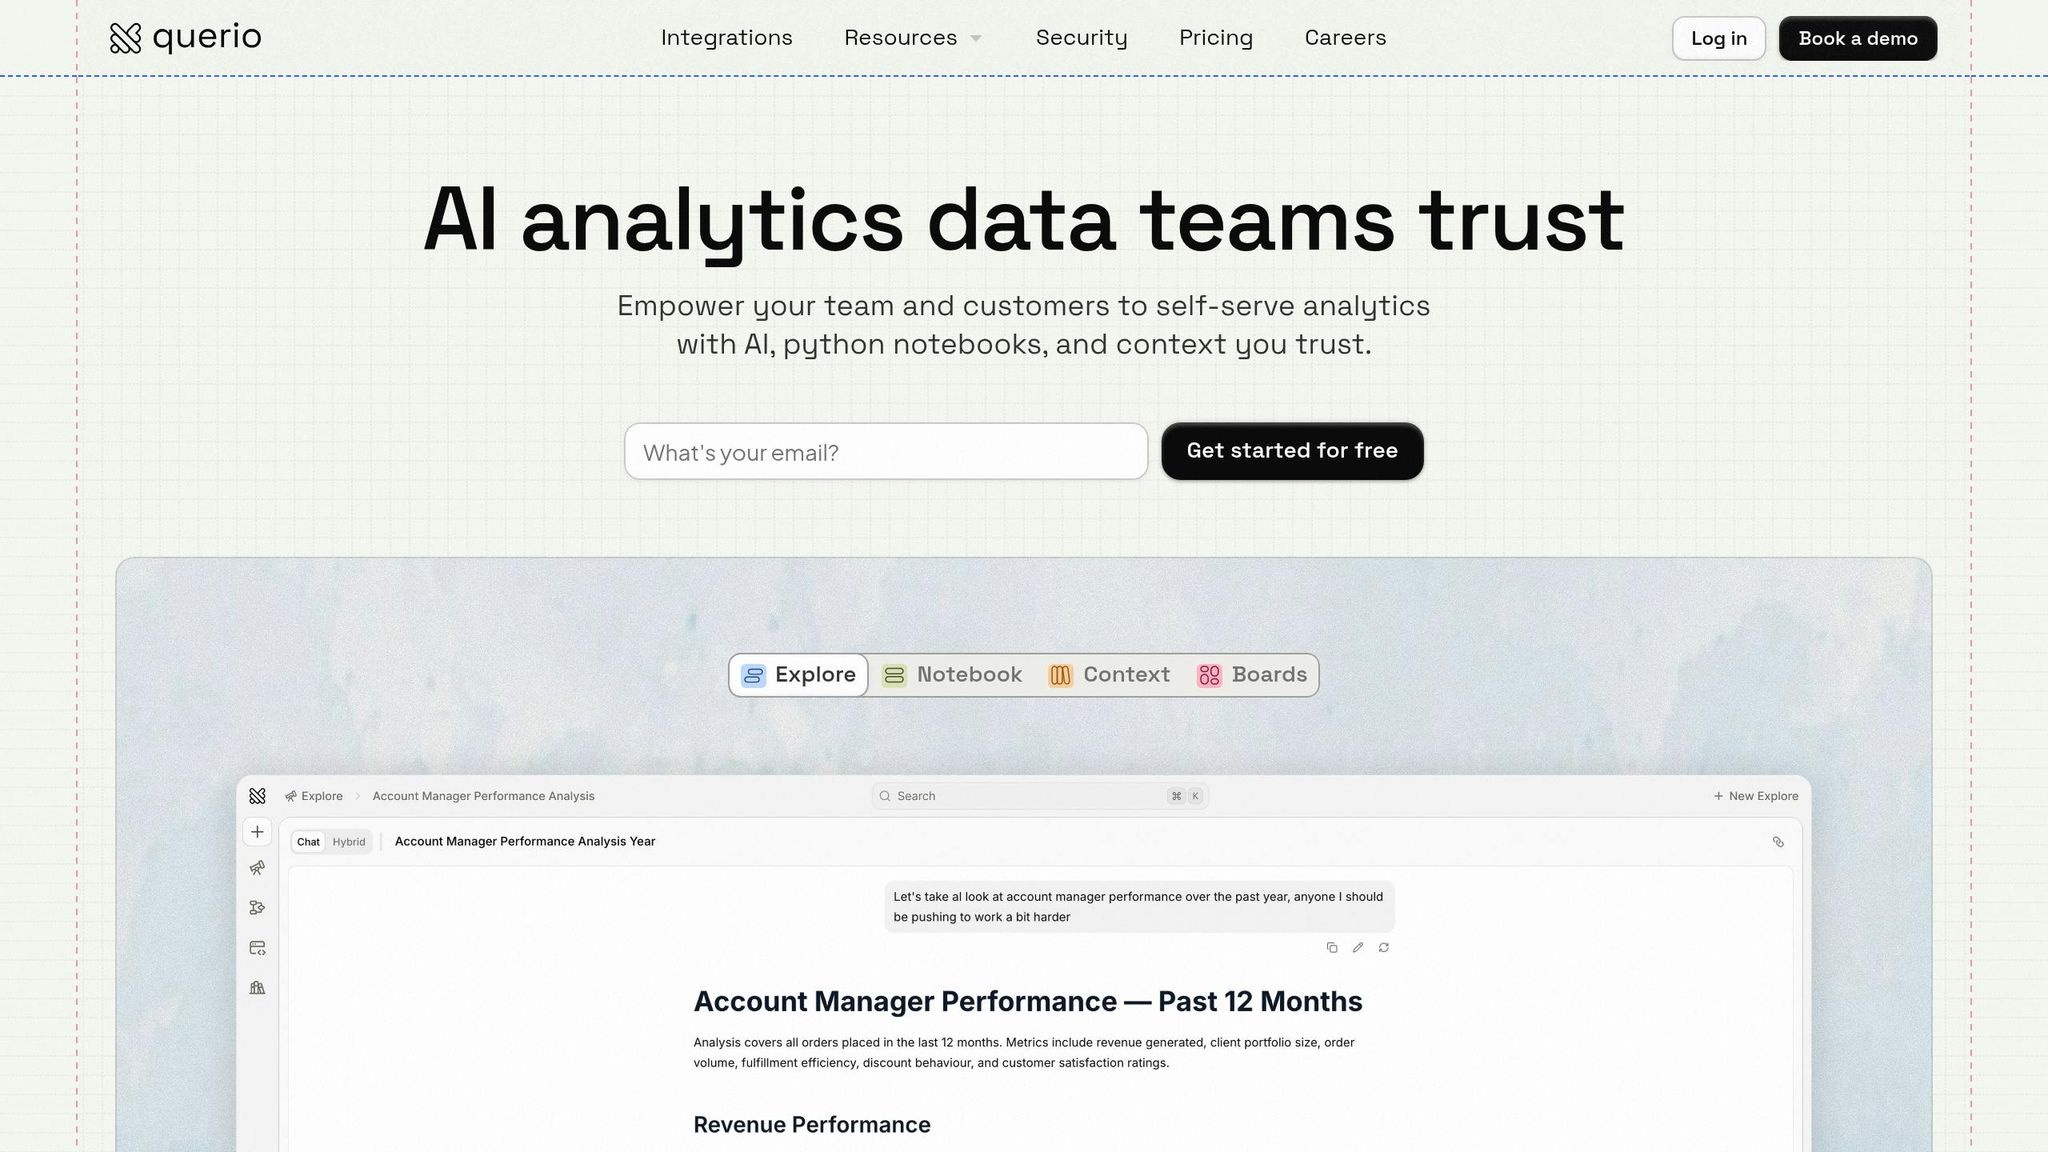
AI-Driven Analytics with Querio
Querio turns BigQuery into answers by providing an AI-powered layer that simplifies analytics for startups with limited resources. It enables anyone on your team to ask questions in plain English - like, "What was our revenue last month by product category?" - and receive accurate answers, backed by real SQL. This means business users don’t need to know SQL to get actionable insights.
What sets Querio apart is its transparency. Every answer comes with the underlying SQL or Python code, so users can review the logic and see exactly what’s being queried. This is crucial for startups, where trust in data is key to making informed decisions. The platform translates natural language into live queries that run directly against your BigQuery warehouse, ensuring secure, read-only access.
This straightforward interface also supports consistent data governance, making it easier to maintain accuracy and trust across teams.
Governance and Semantic Layer
Querio addresses a common startup challenge: inconsistent metrics across departments. Its context layer allows you to define key business terms, calculations, and joins - like what constitutes "active users" or how to calculate "monthly recurring revenue" - in one place. These definitions are then applied universally, whether someone is asking a question or building a dashboard.
This shared semantic layer eliminates the confusion of having "five different revenue numbers" floating around the company. It also works seamlessly with BigQuery features like require_partition_filter, helping you avoid costly full-table scans. Plus, all changes to these shared definitions are versioned, ensuring updates are tracked and consistently applied across your analytics and dashboards.
Improving Analyst Productivity
Querio doesn’t just simplify analytics; it also makes your team more efficient. With its reactive notebook, analysts can work with SQL and Python in one place, and results update instantly as logic changes. This eliminates the need to juggle multiple tools or rewrite scripts, speeding up the iteration process.
The platform also automates scheduled reports and dashboards using live data, cutting out manual exports and repetitive tasks. For startups, this means you can get more done without needing to hire additional analysts.
Querio’s flat-rate pricing - starting at $14,000 annually with unlimited viewers - offers a budget-friendly alternative to traditional BI tools, which often charge $50,000 to $200,000+ in per-user licensing fees. With real-time queries, automated optimization, and minimal IT overhead, Querio is designed to help startups scale their analytics capabilities without increasing costs or headcount.
Implementation Roadmap for Startups
Step 1: Enable BI Engine in BigQuery
Start by creating a BI Engine reservation in your dataset’s region. You can do this through Administration > BI Engine in the Google Cloud Console or by executing the SQL command ALTER BI_CAPACITY ... SET OPTIONS (size_gb = X) [26]. Be sure the reservation region matches your dataset, such as region-us [26].
To determine the right capacity, check INFORMATION_SCHEMA using TOTAL_LOGICAL_BYTES to find the logical size of your most frequently queried tables [26]. Keep in mind, you don’t need to reserve memory for all your data - BI Engine efficiently caches only the data necessary for queries [27]. Testing has shown that combining BI Engine with slot reservations can cut job runtime by 6.3× compared to setups without reservations [27]. Use Cloud Monitoring to compare Reservation Total Bytes with Reservation Used Bytes and adjust capacity as needed [26][27].
Step 2: Connect Looker Studio for Dashboards
To create dashboards, go to the BigQuery console, run a query, and click Open in > Looker Studio. Alternatively, you can add a BigQuery data source directly in Looker Studio [23][22]. You can connect to specific tables, views, or even use Custom SQL for advanced queries - though Custom SQL comes with a 3–5 minute timeout limit [22].
Each chart in a dashboard generates a separate BigQuery query [30]. To control costs, limit dashboards to fewer than 15 charts per page and use the Extract Data feature for reports that don’t require real-time updates [30]. Looker Studio queries are labeled with requestor:looker_studio for easy cost tracking [22][28]. Additionally, Looker Studio users get 1GB of BI Engine capacity for free, which can speed up queries by 4× to 10× [29].
Once your dashboards are set up, you’ll be ready to expand your analytics capabilities.
Step 3: Add Querio
Querio takes your BigQuery data and Looker Studio dashboards to the next level by enabling natural language queries. It connects directly to BigQuery using encrypted, read-only credentials, allowing team members to ask questions in plain English - no SQL required. Querio’s context layer ensures consistency by defining key metrics like "monthly recurring revenue" once and applying them across all queries and dashboards.
The platform also includes a reactive notebook environment, where analysts can use SQL and Python together. Results update instantly as logic changes, eliminating the need to switch between tools or rewrite scripts.
After integrating Querio, focus on tracking and fine-tuning your costs.
Step 4: Monitor and Optimize Costs
Cost monitoring is crucial from the start. Use INFORMATION_SCHEMA.JOBS to identify which Looker Studio reports are driving expenses by leveraging the looker_studio_report_id and looker_studio_datasource_id labels [23][30]. Partition your data by date and cluster it by key dimensions like region or product category to limit the amount of data BigQuery scans [9][24][30].
To improve efficiency, create materialized views that pre-join and pre-aggregate data, allowing dashboards to query thousands of rows instead of millions [24][30]. Quick dashboard performance is essential - slow reports can push users back to requesting manual queries from data teams [30]. Set custom BigQuery quotas for users to prevent unexpected query spikes, and regularly review your BI Engine usage to ensure your reservations are appropriately sized [24][27].
Master Google BIGQUERY Skills from Scratch In 30 Minutes [2025]!
Once you've mastered the basics, you can further accelerate your workflow by using the best AI BI for BigQuery to automate complex analysis.
Conclusion
For startups grappling with expensive data infrastructure, BigQuery presents a practical solution. Its serverless design eliminates the hassle of managing infrastructure, while the pay-as-you-go pricing - offering 1 TB of free query processing each month - ensures costs remain manageable and predictable [31]. By leveraging features like partitioning and clustering, startups can cut query expenses by 50–90%, all without needing a dedicated data engineering team [2].
The four-step roadmap - enabling BI Engine, connecting Looker Studio, integrating Querio, and monitoring costs - turns raw data into actionable insights. Each step tackles common startup challenges head-on: BI Engine speeds up queries affordably, Looker Studio provides free and user-friendly visualization tools, Querio simplifies analytics for non-technical teams, and consistent cost monitoring prevents financial surprises. Querio's natural language interface empowers teams to access metrics quickly while maintaining centralized governance for data accuracy and security.
Real-world examples highlight how optimizing queries can significantly reduce scanned data and lower compute expenses. The same strategies apply universally: enforce partition filters, avoid SELECT *, and rely on summary tables to manage compute costs, which often comprise 85–90% of BigQuery expenses [2][3].
With costs under control and insights readily available, startups gain the ability to scale efficiently. BigQuery's built-in BI tools combined with Querio's AI-powered analytics provide enterprise-level insights without the hefty price tag. From reactive notebooks for in-depth analysis to unlimited dashboard viewers without extra licensing fees, this combination offers the flexibility and scalability startups need as they grow.
FAQs
How do I stop a single bad query from blowing up my BigQuery bill?
To keep your BigQuery costs in check, take advantage of cost control strategies. Start by using the dry run feature to estimate query costs before running them. This allows you to anticipate expenses ahead of time. Set query limits to restrict the amount of data processed, and make your queries more efficient by using techniques like partitioning, clustering, and selecting only the columns you actually need.
Additionally, keep an eye on your spending by monitoring real-time billing reports. These reports can help you spot expensive queries early and take action before costs spiral out of control. Together, these steps can make a big difference in managing your BigQuery expenses effectively.
Do I need BI Engine if I’m only building a few dashboards in Looker Studio?
No, BI Engine isn't required if you're just building a handful of dashboards in Looker Studio. It’s specifically designed to boost query performance for high-volume, frequent workloads. For smaller-scale use cases, such as a limited number of dashboards, the cost may not justify the benefits.
How can I keep metrics like MRR and active users consistent across teams in BigQuery?
To keep metrics like Monthly Recurring Revenue (MRR) and active users consistent in BigQuery, it’s crucial to standardize definitions, data models, and processes. Automating pipelines with SQL transformations and setting up scheduled data refreshes can make this process smoother. Centralizing dashboards in tools like Looker Studio ensures data is accessible and clear. By sharing well-defined metric calculation rules across teams, you minimize discrepancies and ensure everyone works with reliable, current data.
Related Blog Posts


