10 Examples of Good Data Visualization to Elevate Your Analytics in 2026
Discover 10 powerful examples of good data visualization, from interactive dashboards to cohort heatmaps. Learn why they work and how to apply them.
https://www.youtube.com/watch?v=BbplhqDCWOM
published
Outrank AI
examples of good data visualization, data visualization, analytics dashboards, business intelligence, data analysis
db8fecdd-21f3-4b69-96ad-1789e657a664

In a world overflowing with data, effective visualization is not about creating beautiful charts. It's about turning raw information into clear, actionable insights that drive critical business decisions. The best data visualizations compress complexity, reveal hidden patterns, and empower teams to answer urgent questions without needing a data science degree. It is the essential bridge between raw numbers and strategic action.
But what separates a merely adequate chart from a truly transformative one? It comes down to clarity, purpose, and the ability to guide the viewer to an insight. A well-designed visualization doesn't just present data; it tells a story, highlights a key performance indicator, or exposes an anomaly that requires attention. It is the fastest path from data to decision, enabling product managers, startup founders, and data leaders to move with confidence and precision.
This guide moves beyond theory to explore 10 powerful examples of good data visualization that modern product, data, and operations teams rely on daily. We will dissect the strategic 'why' behind each example, from interactive dashboards to cohort heatmaps and natural language query interfaces. For each, we'll provide a tactical breakdown, common mistakes to avoid, and practical steps for implementation. You will learn not just what works, but how to apply these principles to your own data, unlocking the insights needed to accelerate growth and optimize performance.
1. Interactive Dashboards with Drill-Down Capabilities
Interactive dashboards with drill-down capabilities are a prime example of good data visualization because they transform static reports into dynamic, exploratory tools. Instead of presenting a single, fixed view, they allow users to start with a high-level summary, such as total quarterly sales, and click into specific components to uncover the underlying details, like sales per region, then per store, and finally down to individual transactions. This layered approach empowers users to answer their own questions without needing new reports.
This method excels by giving stakeholders a sense of control and discovery. It puts the power of analysis directly into the hands of decision-makers, fostering a data-driven culture where curiosity is rewarded with immediate answers. For teams aiming to build such sophisticated interfaces, understanding the application of modern design aids, including AI UI UX tools, can streamline the creation of intuitive and user-friendly dashboards.
When to Use This Approach
Operational Analytics: Tracking daily performance metrics where managers need to quickly identify and investigate anomalies.
Product Performance Tracking: Allowing product managers to see overall user engagement and then drill down into specific features or user segments.
Financial Reporting: Enabling finance teams to view top-line revenue figures and then explore expense categories or departmental spending in detail.
Actionable Tips for Implementation
Structure by Questions: Design your drill-down paths to answer the most common follow-up questions. If users always ask "which region contributed most?" after seeing total sales, make that the first drill-down level.
Maintain Context: Use consistent colors and labels across different levels of detail. If "North America" is blue in the summary chart, it should remain blue in all subsequent detailed views to avoid user confusion.
Optimize Performance: Pre-aggregate data for higher-level views to ensure the dashboard loads quickly. Slower-loading, detailed data should only be queried when a user actively drills down.
2. Natural Language Query Interfaces ('Ask Your Data')
Natural Language Query (NLQ) interfaces, often called 'Ask Your Data' features, represent a major leap forward in making data accessible. This approach allows users to ask questions in plain English, such as "show me our top-selling products in Germany last quarter," and receive an immediate, relevant visualization. By translating conversational language into complex data queries, these interfaces eliminate the need for users to understand SQL or navigate complicated menus, truly democratizing data access.
This method stands out as an example of good data visualization because it removes the technical barrier between a question and its answer. It empowers non-technical stakeholders in product, operations, and finance to perform their own analyses without relying on a data team. This fosters a culture of self-service analytics and accelerates decision-making. To dive deeper into their transformative potential, you can learn more about why natural language interfaces are the future of BI and how they are reshaping business intelligence.
When to Use This Approach
Self-Serve Analytics for Non-Technical Teams: Perfect for sales, marketing, or operations teams who need quick answers without waiting for a data analyst.
Embedded Analytics in SaaS Products: Empowering your customers to explore their own data within your application, adding significant value and stickiness.
Rapid Data Exploration: Ideal for initial data discovery, where analysts or executives want to quickly test hypotheses and explore trends from various angles.
Actionable Tips for Implementation
Build a Robust Business Glossary: The AI needs to understand your company's terminology. Define key metrics (e.g., "Active Users," "MRR") and dimensions so the system translates questions accurately.
Provide Smart Defaults and Examples: Guide users by suggesting common questions like "What was our monthly recurring revenue last year?" to help them get started and understand the feature's capabilities.
Implement a Feedback Loop: Allow users to rate the accuracy of the answers or visualizations. This feedback is crucial for training the model and improving its performance over time.
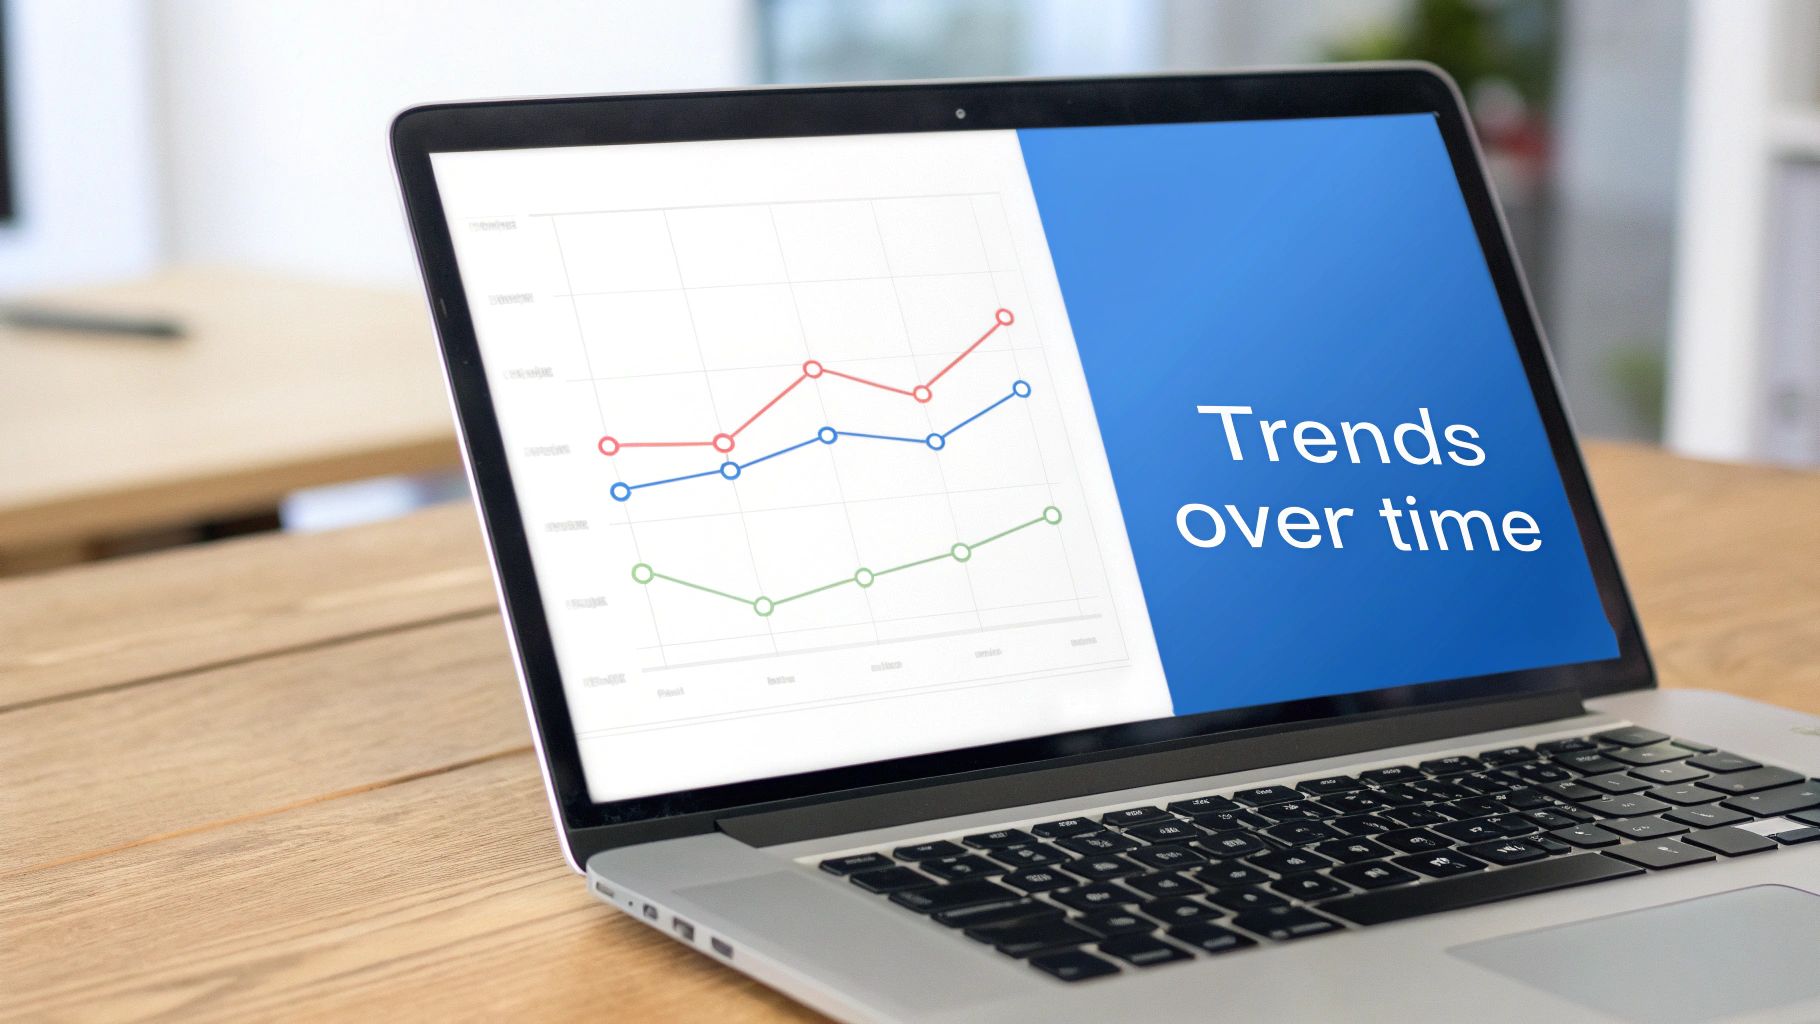
3. Time-Series Line Charts for Trend Analysis
Time-series line charts are a cornerstone of effective data visualization, representing a metric's progression over consistent time intervals. They are fundamental for tracking performance, identifying patterns, and understanding momentum. By plotting data points chronologically and connecting them with a line, these charts clearly illustrate growth, decline, seasonality, and other critical trends, making them indispensable for business intelligence and product analytics.
This method is powerful because it tells a story over time in a universally understood format. From a financial dashboard tracking monthly recurring revenue (MRR) to a product manager monitoring daily active users (DAU), the line chart offers an intuitive snapshot of performance. For those new to charting, understanding how to select the right visualization is key; you can explore a comprehensive data visualization guide for choosing the right charts to build a strong foundation.
When to Use This Approach
Product Growth Monitoring: Tracking key metrics like DAU, MAU, or user retention curves to assess product health and the impact of feature launches.
Marketing Campaign Analysis: Visualizing website traffic, conversion rates, or social media engagement over the duration of a campaign to measure its effectiveness.
Financial Performance Tracking: Plotting revenue, profit, or transaction volume over months or quarters to identify financial trends and forecast future performance.
Actionable Tips for Implementation
Keep It Simple: Use a maximum of 2-3 colors to avoid cognitive overload. If comparing multiple series, ensure they are easily distinguishable.
Provide Context: Include reference lines or shaded areas to mark important events like product updates, marketing campaigns, or business targets. This helps correlate changes in the trend with specific actions.
Ensure Clear Labeling: Always label the X and Y axes clearly with the time unit (e.g., Days, Weeks, Months) and the metric being measured. An unlabeled chart is meaningless.
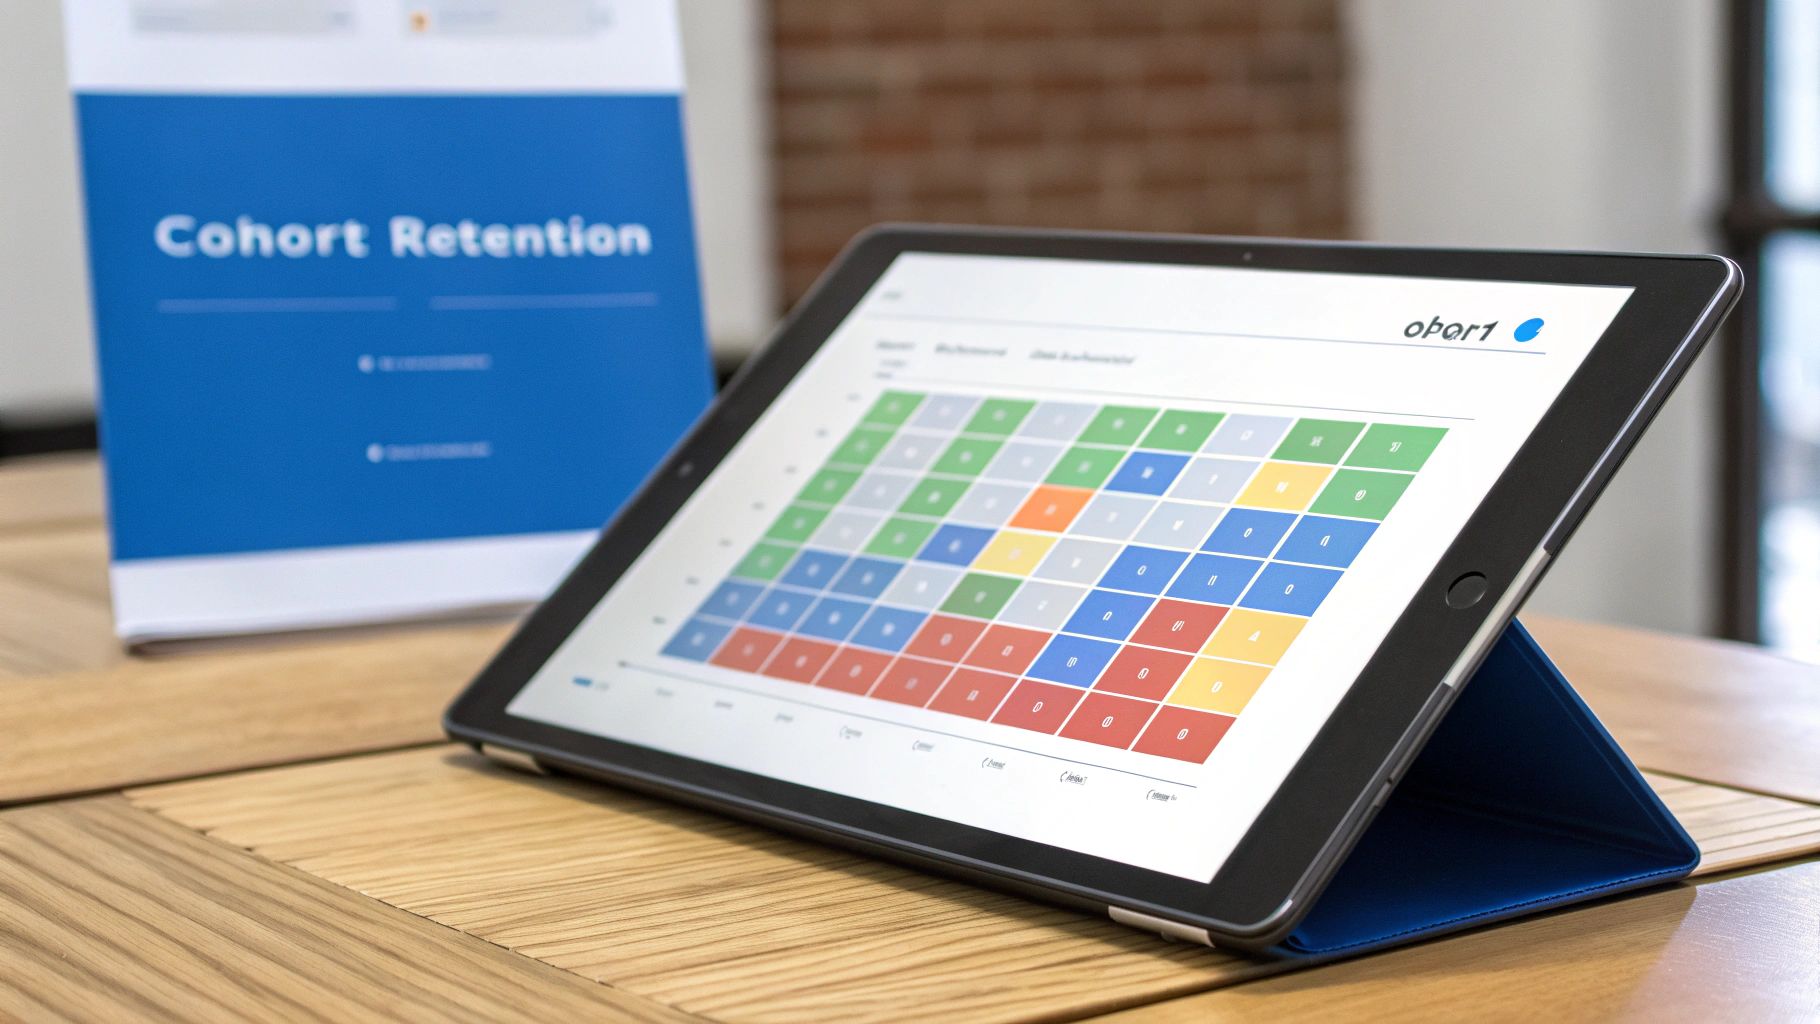
4. Cohort Analysis Tables and Heatmaps
Cohort analysis is a powerful form of behavioral analytics that breaks down data into groups of people with common characteristics over time. A cohort analysis heatmap is an exemplary form of data visualization because it elegantly displays complex user behavior patterns, like retention or engagement, in a single, easily digestible grid. Instead of looking at cumulative metrics, this method isolates user groups (e.g., users who signed up in January) and tracks their activity over subsequent weeks or months, using color intensity to reveal trends at a glance.
This approach excels at answering critical business questions about user loyalty and the impact of product changes. It allows product managers and marketers to see if recent feature launches improved long-term retention or if a new onboarding flow is more effective than the last. By visually representing how each group's behavior evolves, stakeholders can quickly spot high-performing cohorts and diagnose issues with underperforming ones, making it an indispensable tool for data-driven product development.
When to Use This Approach
User Retention Analysis: Tracking the percentage of users who return week-over-week or month-over-month, grouped by their signup date.
Feature Adoption Tracking: Monitoring how different user cohorts engage with a new feature over its lifecycle to understand its long-term value.
Marketing Campaign Effectiveness: Assessing the long-term value and engagement of users acquired from different campaigns or channels.
Actionable Tips for Implementation
Use a Diverging Color Palette: Employ a color scale like red-yellow-green to instantly distinguish between poor, average, and strong performance. This makes identifying problem areas or successes intuitive.
Normalize Your Data: When comparing cohorts of different sizes, present metrics as percentages (e.g., percent of users retained) to ensure fair, apples-to-apples comparisons.
Include Sample Sizes: Add the initial size of each cohort (N=) to provide context. A high retention rate in a very small cohort may not be as statistically significant as a slightly lower rate in a much larger one.
5. Funnel Charts for Conversion Flow Analysis
Funnel charts are a powerful example of good data visualization because they clearly illustrate user progression through a series of predefined steps. By representing each stage as a diminishing portion of a whole, they instantly show where users are "dropping off" in a process, such as an e-commerce checkout or a SaaS signup flow. This visualization makes it easy to pinpoint the biggest friction points in a conversion path.
This method excels by translating complex, multi-step user journeys into a simple, intuitive graphic that anyone can understand. It helps product and marketing teams focus their optimization efforts on the stages with the most significant leaks, making it a critical tool for improving conversion rates. The visual metaphor of a funnel effectively communicates the concept of attrition, allowing stakeholders to grasp performance at a glance and prioritize improvements that will have the greatest impact on business goals.
When to Use This Approach
E-commerce Checkout Analysis: Tracking users from adding an item to their cart to completing a purchase to identify and fix checkout abandonment issues.
SaaS User Onboarding: Monitoring the journey from initial sign-up to feature activation to improve new user retention and time-to-value.
Marketing Campaign Conversion: Visualizing how potential customers move from an ad click to a landing page visit, form submission, and final conversion.
Actionable Tips for Implementation
Define Meaningful Stages: Base your funnel stages on key business objectives and user actions, not just technical events. For example, use "Profile Created" instead of "database row inserted."
Segment Your Funnels: Analyze funnels for different user segments (e.g., by marketing channel, device type, or user cohort) to uncover more nuanced insights. You might find mobile users drop off at a different stage than desktop users.
Track Time Between Steps: Include data on how long it takes users to move from one stage to the next. A long delay between steps can indicate friction or confusion, even if users don't drop off entirely.
6. Scatter Plots for Correlation and Segmentation
Scatter plots are powerful examples of good data visualization because they excel at revealing the relationship between two continuous variables. By plotting individual data points on a two-dimensional graph, they immediately show patterns, concentrations, and outliers that might be hidden in aggregated statistics. This makes them ideal for identifying correlations, such as whether higher customer acquisition costs lead to higher lifetime value.
This visualization method is particularly effective for strategic analysis. When a third categorical variable is introduced through color-coding, a simple scatter plot transforms into a sophisticated segmentation tool. For instance, coloring points by user segment or marketing channel allows decision-makers to see not just the overall relationship, but how it differs across distinct groups, enabling precise targeting and resource allocation.
When to Use This Approach
Customer Segmentation: Plotting customer LTV against acquisition cost to identify the most and least profitable segments.
Product Analytics: Correlating feature adoption rates with user engagement scores to determine which features drive retention.
Sales Strategy: Analyzing the relationship between company size and contract value to help sales teams prioritize high-value leads.
Actionable Tips for Implementation
Quantify the Relationship: Always include a trend line and the R-squared value to provide a clear, statistical measure of the correlation's strength. This moves the analysis from purely visual to quantitatively supported.
Leverage Color for Insight: Use color to represent a third dimension, like a user cohort or product category. This adds a layer of segmentation that can uncover hidden patterns specific to certain groups.
Provide Interactive Controls: Implement zoom and filter capabilities to allow users to investigate dense clusters or specific outliers. This transforms the static chart into an exploratory tool.
Maintain Statistical Context: Clearly label your axes and include the total sample size (N) in the chart's title or notes. This helps the audience gauge the statistical significance of the observed patterns.
7. KPI Cards and Summary Cards with Sparklines
KPI cards and summary cards with sparklines are a powerful example of good data visualization because they distill complex metrics into a single, digestible snapshot. Instead of forcing users to interpret a full chart, these cards prominently display a key figure, like "Monthly Revenue: $2.4M," and enrich it with essential context. This often includes a comparison to a previous period, a trend indicator, and a miniature sparkline chart to show recent performance at a glance.
This approach excels by delivering critical information with maximum efficiency, making it perfect for high-level executive dashboards or team scorecards. By presenting the most important numbers upfront, stakeholders can quickly assess performance without getting lost in the weeds. Deciding which metrics to feature is crucial, and understanding what metrics really matter and how AI can surface them can help teams focus on what truly drives business success.
When to Use This Approach
Executive Dashboards: Providing a top-level summary of business health across departments like sales, marketing, and finance.
SaaS Performance Tracking: Monitoring core metrics like Monthly Recurring Revenue (MRR), Churn Rate, and Customer Acquisition Cost (CAC) in real-time.
Product Team Scorecards: Tracking daily product health metrics, such as Daily Active Users (DAU), conversion rates, and feature adoption.
Actionable Tips for Implementation
Always Provide Context: A number without context is meaningless. Always include a comparison, such as "vs. last month" or "vs. target," to give the metric significance.
Use Color Intentionally: Reserve strong colors like red and green for clear status indicators. Use neutral colors for the primary metric to avoid creating unnecessary alarm or celebration.
Incorporate a Sparkline: This micro-trend indicator shows the metric's recent trajectory over time, adding a layer of insight without cluttering the card.
Enable Drill-Through: Allow users to click on a KPI card to navigate to a more detailed report or chart that explains the "why" behind the number.
8. Waterfall Charts for Composition and Change Analysis
Waterfall charts are a powerful example of good data visualization because they clearly illustrate how an initial value is affected by a series of intermediate positive and negative changes. Instead of just showing a starting and ending point, a waterfall chart breaks down the journey between them, visually explaining the "story" behind the net change. This makes them indispensable for financial analysis, inventory tracking, and understanding user base fluctuations.
This visualization excels at providing a clear, sequential narrative of change. For stakeholders trying to understand what factors drove an increase in revenue or a decrease in profit, a waterfall chart offers an intuitive, step-by-step explanation. It isolates each component, such as new sales, expansion revenue, and customer churn, making it easy to pinpoint the most significant contributors to the overall movement.
When to Use This Approach
Financial Performance Reporting: Deconstructing net profit by showing how it's built from gross profit and then reduced by various operating expenses and taxes.
User Growth Analysis: Explaining changes in a user base by charting starting users, new signups, reactivations, and churn to arrive at the ending user count.
Budget vs. Actual Variance Analysis: Starting with a budgeted amount and showing how savings and overages in different categories lead to the final actual spending.
Actionable Tips for Implementation
Order by Impact: Arrange the intermediate bars (the changes) from the largest to the smallest impact to immediately draw attention to the most significant drivers.
Use Color Intentionally: Employ a standard color scheme to denote positive and negative changes. Green for increases (like new revenue) and red for decreases (like costs or churn) is a universally understood convention.
Keep It Clean and Labeled: Ensure each bar has a clear data label showing its precise value. Avoid clutter by grouping smaller, less significant factors into a single "Other" category to maintain focus.
9. Embedded Analytics and White-Label Dashboards
Embedded analytics are a powerful example of good data visualization because they bring insights directly into a user's existing workflow. Instead of forcing users to switch to a separate business intelligence tool, this approach integrates charts, dashboards, and reporting capabilities natively within an application or customer portal. White-labeling takes this a step further by ensuring the analytics components seamlessly match the host application's branding, creating a cohesive and professional user experience.
This method is critical for modern SaaS platforms, as it transforms data from a byproduct into a core product feature. By embedding analytics, companies like HubSpot or Stripe provide direct value to their customers, helping them track performance and make better decisions without ever leaving the platform. This increases product stickiness and empowers users by making data an integral, accessible part of their daily operations. For an in-depth look at this trend, our guide to embedded analytics covers implementation strategies and top tools.
When to Use This Approach
SaaS Product Features: Offering customers in-app reporting on their own data, such as marketing campaign performance or sales trends.
Customer Portals: Providing clients with self-serve access to their usage data, account status, or project progress.
Internal Tools: Embedding operational dashboards directly into CRMs or project management software so teams can monitor KPIs in the tools they already use.
Actionable Tips for Implementation
Prioritize Customer Use Cases: Design dashboards that answer your specific customer's most pressing questions, not generic business metrics. A marketing platform's analytics should focus on lead generation, not just revenue.
Ensure Data Security: Implement robust row-level security to guarantee that users can only see the data they are authorized to access, preventing critical data leaks between customers.
Optimize for Performance: Embedded analytics must be fast. Monitor dashboard load times and use aggressive query caching to ensure a snappy, responsive experience that doesn't slow down the host application.
10. Geographic Maps and Regional Heatmaps
Geographic maps and regional heatmaps are powerful examples of good data visualization that bring spatial context to business metrics. By overlaying data onto a map, they instantly reveal regional trends, disparities, and concentrations that would be lost in a standard table or chart. This approach uses color gradients to represent data intensity, allowing stakeholders to quickly identify high-performing territories, underserved markets, or areas with emerging issues.

This method is highly effective because it leverages our natural ability to process spatial information. It transforms abstract numbers, like sales figures or user counts, into a tangible, relatable visual. This makes it an indispensable tool for global companies managing regional sales teams, logistics managers optimizing supply chains, or product leaders tracking user adoption across different markets. It connects data directly to real-world locations, making insights more intuitive and memorable.
When to Use This Approach
Sales and Marketing Analytics: Visualizing sales performance by territory, lead concentration, or campaign effectiveness across different regions.
Logistics and Supply Chain: Tracking shipment routes, delivery times, and inventory levels across a distribution network.
Market Expansion Planning: Identifying customer clusters and untapped markets to guide strategic growth and resource allocation.
Operational Monitoring: Monitoring support ticket volumes or service outages by geographic area to pinpoint localized problems.
Actionable Tips for Implementation
Use Appropriate Color Scales: Employ a sequential color scale (light to dark) for metrics that progress from low to high, like revenue. Use a diverging scale (e.g., red-white-blue) to show deviations from a baseline, such as performance against a target.
Provide Context with Layers: Don't just show your data. Overlay it with relevant demographic data, competitor locations, or infrastructure maps to create a richer, more insightful narrative.
Avoid Area-Based Distortion: Be mindful that large regions like states or countries can visually dominate a map, even if their data value is small. Consider using bubble maps, where the size of a circle represents the metric, to avoid this bias.
Enable Interactive Exploration: Allow users to zoom and pan. Incorporate tooltips that reveal precise data points on hover and enable drill-downs from a country level to states and even cities for detailed analysis.
Comparison of 10 Effective Data Visualizations
Solution | 🔄 Implementation Complexity | ⚡ Resource Requirements | 📊 Expected Outcomes | 💡 Ideal Use Cases | ⭐ Key Advantages |
|---|---|---|---|---|---|
Interactive Dashboards with Drill-Down Capabilities | 🔄 Medium–High: requires careful data model and navigation design | ⚡ Moderate–High: BI platform, optimized queries, UX design | 📊 Fast self-serve insights; reduces time-to-answer from weeks to minutes | 💡 Cross-functional exploration, operational analytics, ad-hoc follow-ups | ⭐⭐⭐⭐⭐ Centralizes insights; enables non-technical exploration; supports follow-ups |
Natural Language Query Interfaces ('Ask Your Data') | 🔄 High: NLP + intent mapping + metadata management | ⚡ High: ML models, business glossary, continuous tuning | 📊 Democratizes access; rapid Q&A and iterative exploration | 💡 Non-technical users, embedded analytics, quick ad-hoc questions | ⭐⭐⭐⭐⭐ Removes SQL barrier; instant answers; iterative dialogue |
Time-Series Line Charts for Trend Analysis | 🔄 Low: standard visualization with time-aligned data | ⚡ Low: aggregated time-series data, minimal compute | 📊 Clear trend/seasonality detection and anomaly spotting | 💡 Growth monitoring, DAU/MAU tracking, revenue trends | ⭐⭐⭐⭐ Familiar and communicative; easy comparison across metrics |
Cohort Analysis Tables and Heatmaps | 🔄 Medium: event aggregation and cohort alignment | ⚡ Medium: event-level data, cleaning, retention calculations | 📊 Reveals retention patterns, cohort degradation, feature impact | 💡 Retention analysis, onboarding quality, feature launch evaluation | ⭐⭐⭐⭐ Highlights cohort behavior and churn risk; effective for product decisions |
Funnel Charts for Conversion Flow Analysis | 🔄 Medium: stage definition and event sequencing | ⚡ Medium: event tracking, segmentation, step-level data | 📊 Identifies drop-offs and quantifies conversion rates | 💡 Conversion optimization, A/B testing, onboarding flows | ⭐⭐⭐⭐ Pinpoints bottlenecks; enables stage-level optimization and comparisons |
Scatter Plots for Correlation and Segmentation | 🔄 Low–Medium: plotting and encoding multiple dimensions | ⚡ Medium: sufficient sample size, labels, optional regression | 📊 Reveals correlations, clusters, and outliers for segmentation | 💡 LTV vs CAC, feature adoption vs engagement, hypothesis testing | ⭐⭐⭐⭐ Exposes relationships and outliers; supports segmentation and hypothesis validation |
KPI Cards and Summary Cards with Sparklines | 🔄 Low: simple aggregations and visual components | ⚡ Low: aggregated metrics, periodic refresh | 📊 At-a-glance status; quick signal for executive actions | 💡 Executive dashboards, team scorecards, daily monitoring | ⭐⭐⭐⭐ Concise, shareable metric snapshots with trend context |
Waterfall Charts for Composition and Change Analysis | 🔄 Medium: ordered decomposition and grouping logic | ⚡ Low–Medium: aggregated contributions and labeling | 📊 Explains drivers of change and variance between periods | 💡 Financial variance analysis, revenue decomposition, board presentations | ⭐⭐⭐ Clear decomposition of changes; narrative-friendly for stakeholders |
Embedded Analytics and White-Label Dashboards | 🔄 High: SSO, RLS, SDK/embed work, theming | ⚡ High: engineering, security, performance optimization | 📊 Increased product engagement and potential monetization | 💡 SaaS products embedding analytics for customers or partners | ⭐⭐⭐⭐⭐ Seamless UX, brand-consistent analytics, multi-tenant isolation |
Geographic Maps and Regional Heatmaps | 🔄 Medium: geocoding, mapping layers, drill levels | ⚡ Medium: geo-data, tiles, possible performance tuning | 📊 Reveals spatial patterns and regional disparities | 💡 Regional sales, market expansion, location-based product decisions | ⭐⭐⭐ Intuitive spatial insight; effective for localization and regional prioritization |
From Insight to Impact: Making Data Visualization Work for You
Throughout this curated gallery, we've explored a powerful collection of examples of good data visualization. From the macro view of an interactive dashboard to the granular detail of a cohort heatmap, each format serves a distinct strategic purpose. The journey from raw data to a clear, compelling chart is not just an aesthetic exercise; it's a fundamental business process that separates high-growth startups from their slower-moving competitors.
The core principle unifying all these examples is purpose-driven design. A visualization is only "good" if it answers a specific business question efficiently and accurately. A funnel chart excels at pinpointing drop-off in a user journey, while a waterfall chart is purpose-built to explain the cumulative effect of positive and negative changes on a metric. Choosing the right chart is the first and most critical step in transforming data from a passive asset into an active driver of strategy.
Your Strategic Visualization Toolkit
The visualizations we've dissected are more than just static images; they are analytical tools. Think of them as a strategic toolkit for your business:
For High-Level Oversight: KPI cards and embedded analytics dashboards offer an immediate, at-a-glance pulse on business health, perfect for executive-level reporting and team-wide alignment.
For Deep-Dive Analysis: Cohort analysis, scatter plots, and interactive maps empower product and data teams to move beyond what is happening to understand why. These tools are essential for segmentation, correlation analysis, and identifying hidden patterns in user behavior.
For Performance and Process Tracking: Funnel charts and time-series line charts provide a clear narrative of performance over time or through a process. They are indispensable for growth marketing, sales operations, and product management teams focused on optimization.
A recurring theme is the power of interactivity. Static charts provide a snapshot, but modern tools allow for drill-downs, filtering, and natural language queries that enable a dynamic conversation with your data. This interactivity is what bridges the gap between observation and true understanding, empowering non-technical users to conduct their own analysis without waiting in a data team's queue. To truly unlock the power of data and move from raw numbers to actionable insights, specialized tools and advanced statistical analysis are often required. For instance, focusing on Opta Player Stats demonstrates how detailed data can transform understanding in specific domains. This same principle of using granular, well-structured data applies directly to business analytics, where every user action can be a data point waiting to reveal an insight.
Putting These Examples into Action
Mastering these concepts is not an academic pursuit; it delivers a tangible competitive advantage. When your product managers can instantly visualize user conversion funnels, they can iterate on the user experience faster. When your executives can ask "What were our top 10 highest-value customers last quarter?" in plain English and get an immediate, visualized answer, decision-making velocity accelerates across the entire organization.
The ultimate goal is to cultivate a culture where data-informed curiosity is not just encouraged but enabled. This happens when the tools for analysis are as accessible as the questions themselves. The true impact of these examples of good data visualization is realized when they become a daily part of your team's workflow, sparking discussions, validating hypotheses, and guiding every decision with objective evidence. Start small: pick one critical question your team grapples with, select the appropriate visualization from this guide, and build it. That single chart can be the catalyst for a profound shift in how your entire company operates.
Ready to move from inspiration to implementation? Querio is an AI-powered analytics platform designed to help you create all the powerful visualizations explored in this article, often in seconds. Connect your data, ask questions in plain English, and build interactive dashboards that empower every team to make smarter, faster decisions. Explore Querio and see how easy it is to bring your data to life.

