How Do You Standardize Data: how do you standardize data for reliable analytics
Discover how do you standardize data with a practical guide to turning messy datasets into clean, reliable analytics for smarter decisions.
https://www.youtube.com/watch?v=v67JHa4MrnQ
published
Outrank AI
how do you standardize data, data standardization, data governance, data quality, business intelligence
804b8bea-828f-4ae6-aa06-33c0fe9308c9

Data standardization is all about getting your data into a single, coherent format. Think of it as creating a universal translator for your business. It means defining a common set of rules for data types, formats, and business definitions so that everyone in the organization is speaking the same language.
Why Inconsistent Data Silently Kills Growth

Before we jump into the "how," it's essential to grasp the "why." Messy, unstandardized data isn't just a minor annoyance; it’s a fundamental roadblock that grinds growth to a halt. It quietly breeds confusion and erodes trust in the very numbers leaders need for smart decisions.
Without a shared set of rules, every team ends up in its own data silo.
Picture this all-too-common scenario: The Product team defines an "active user" based on application logins. At the same time, the Operations team is tracking them through a separate CRM, and Finance is calculating the same metric from subscription payments. Suddenly, you're in a leadership meeting with three different numbers for the exact same metric.
That kind of misalignment stops progress dead in its tracks. Which number is right? Is user engagement actually growing? The conversation immediately derails from strategy to data forensics, and any confidence in the analytics just evaporates.
The Real Cost of Data Chaos
This isn't just a hypothetical. For startup founders and data leaders, getting conflicting Excel sheets from Product, Ops, and Finance is a daily headache. The consequences are staggering—it's estimated that a shocking 85% of BI projects fail, often due to poor data quality and the mistrust it creates.
Data standardization is the antidote to this chaos. It's the disciplined work of establishing and enforcing a common format, structure, and meaning for data across every system. This creates the single source of truth you need for confident, data-driven decision-making.
The payoff of a standardized approach is huge. By implementing one, you can get past many of the common data analysis bottlenecks and finally turn your data into an asset you can count on.
To truly understand the stakes, it helps to see the direct contrast between a business struggling with data chaos and one that has established a solid, standardized foundation.
The Cost of Inconsistent Data vs. The Payoff of Standardization
Problem Area | Impact of Unstandardized Data | Benefit of Standardized Data |
|---|---|---|
Decision-Making | Leaders hesitate or make gut calls due to conflicting reports. Meetings turn into data debates. | Decisions are made quickly and with confidence, based on a single, trusted source of truth. |
Operational Efficiency | Analysts waste countless hours cleaning and reconciling data instead of finding insights. | Data teams focus on high-value analysis and strategic projects, not manual data janitor work. |
Team Collaboration | Cross-functional projects are plagued by miscommunication and metric misalignment. | Product, Marketing, and Sales work from the same playbook, driving toward unified goals. |
Reporting & BI | Dashboards are unreliable and often ignored, leading to a low ROI on analytics tools. | Analytics become a trusted, central hub for business performance, driving adoption and action. |
Scalability | As the company grows, data problems multiply, making it impossible to get a clear, company-wide view. | A clean data foundation scales with the business, supporting more complex analysis and new initiatives. |
Ultimately, investing in standardization isn't just a technical exercise—it's a strategic move that pays dividends across the entire organization.
Building a Foundation for Reliable Analytics
The goal is simple: move from a state of data conflict to one of absolute clarity. Every department must agree on what key metrics mean and, just as importantly, how they're calculated.
This is exactly what modern business intelligence tools are designed to solve.
They work by creating a centralized, standardized analytics layer that sits on top of all your raw data sources. This ensures that when anyone—from any team—asks a question, they get an answer pulled from the same trusted, consistent definitions. This layer stops discrepancies before they ever make it to a dashboard, turning data from a source of friction into a catalyst for unified action.
Build Your Foundation With a Unified Data Dictionary

Before you touch a single line of code or clean one row of data, everyone needs to be working from the same blueprint. A data dictionary is that blueprint. It’s the foundational document that creates a shared language for data across your entire organization.
Forget thinking of it as just a technical spreadsheet. It’s a strategic tool that forces critical conversations, builds consensus, and gets everyone on the same page. It’s the constitution for your data, explicitly defining every key metric and field so there’s no room for the dangerous ambiguity that leads to conflicting reports and bad decisions. Without it, you’re just flying blind.
From Ambiguity to Alignment
The real power of a data dictionary becomes obvious when you get different teams in a room to define a metric that seems simple on the surface. Take Customer Lifetime Value (CLV)—a classic example of a term everyone thinks they understand.
The Finance team might calculate CLV based purely on historical revenue minus acquisition costs. Over in the Product department, their version includes a predictive component based on recent user engagement. Both are legitimate views, but if they aren't aligned, the company is operating with two completely different versions of reality.
Creating a data dictionary forces these discussions out into the open. By establishing a single, agreed-upon definition, you eliminate these conflicts at the source. The process turns a documentation chore into a powerful strategic exercise.
The point of a data dictionary isn't just to list fields and data types. It's to create a single, undisputed source of truth that every team—from marketing to engineering—can build upon with total confidence.
This is where true data standardization begins. It's the bedrock for every transformation, analysis, and dashboard that follows.
Key Components of a Practical Data Dictionary
A useful data dictionary doesn't need to be overly complicated, but it absolutely must be comprehensive. Think of it as a living document that's easy for anyone in the company to access. If you need some help structuring your definitions, exploring a quality data glossary builder for clear terms can make sure your hard work actually sticks.
At a minimum, here are the essential fields to include for every metric or data point:
Metric Name: The clear, user-friendly name, like "Monthly Active Users."
Business Definition: A plain-English explanation of what the metric represents and why it matters. This must be co-written with business stakeholders.
Calculation Logic: The exact formula or query used to generate the number. For CLV, this would detail precisely which revenue streams are included and how costs are attributed.
Data Type: The technical format, such as
INTEGER,VARCHAR, orTIMESTAMP.Source System: Where the raw data comes from (e.g., Salesforce, Stripe, company database).
Data Owner: The specific team or person accountable for the quality and accuracy of this data (e.g., Finance, Product Analytics).
A Template for Standardizing a Metric
Let's see how this works in the real world by applying it to our Customer Lifetime Value example.
Field | Entry for Customer Lifetime Value (CLV) |
|---|---|
Metric Name | Customer Lifetime Value (CLV) |
Business Definition | The total net profit a customer is predicted to generate for the company over their entire relationship with us. |
Calculation Logic |
|
Data Type |
|
Source System | Calculated field in our data warehouse, using data from Stripe (transactions) and our app database (user activity). |
Data Owner | Finance Team |
Just like that, the ambiguity is gone. Now, everyone knows exactly what CLV means, how it’s calculated, and who to talk to if they have questions. This clarity is the cornerstone of building trust in your data.
Of course, a dictionary is just the start. You'll also want to look into implementing robust data governance best practices to ensure long-term data health and security.
Getting Your Hands Dirty: Data Cleaning and Transformation
Alright, you've got your data dictionary and a solid plan. Now comes the real work—the part where we roll up our sleeves and start wrangling the raw data into shape. This is where we take all those chaotic, inconsistent inputs and start methodically cleaning and transforming them to match the standards you just defined.
Think of it as the foundational work before building a house. Without this step, your data dictionary is just a nice-looking blueprint, and any analysis you build on top will be on shaky ground. This is about more than just fixing typos; it's a systematic process of enforcing uniformity.
Normalizing Data to Create a Level Playing Field
One of the most common headaches I see is trying to compare apples and oranges—or, more accurately, dollars and euros from markets of completely different sizes. Imagine your North American team reports revenue in USD, while your European team uses EUR. Just plotting those numbers on a chart is not only unhelpful, it's downright misleading.
This is exactly where normalization becomes your best friend. It’s a technique for rescaling numeric data to a common range, usually between 0 and 1. This lets you make fair, direct comparisons, no matter the original scale.
A go-to method for this is min-max scaling. The formula is straightforward but incredibly effective: you take a data point, subtract the minimum value in the dataset, and then divide by the range (maximum minus minimum). For finance leaders trying to automate board reports, this is a game-changer. Standardizing financial metrics this way ensures everything aligns perfectly, which can slash reporting errors by as much as 50%.
Normalization strips away the distortion caused by different scales. Suddenly, a
0.8score is a clear high performer, whether that originally represented $10 million in a huge market or €500,000 in a smaller one. It’s all about context.
The Essential Task of Deduplication
Duplicate records are the silent killers of data quality. They sneak in when you merge data from different systems—a customer in your CRM from a sales call and the same person in your marketing platform from a newsletter signup. Before you know it, you have two different versions of the truth.
These duplicates will absolutely wreck your analytics. You'll end up with inflated customer counts, messy segmentation, and a skewed view of reality.
The fix is deduplication, which is just a fancy word for finding and merging these redundant records. The game plan usually looks like this:
Find a Unique Identifier: First, pick a field you can rely on to identify a unique person or company. A customer's email address or a company's domain name are often good bets.
Match and Group: Next, group all the records that share that unique identifier. For example, pull together all entries where the
emailis 'jane.doe@example.com'.Merge and Consolidate: Finally, create a single "golden record" by picking and choosing the best, most up-to-date information from all the duplicates.
Getting this right is absolutely critical for building a true single customer view. When you're making big changes, it’s always smart to follow database migration best practices to make sure you don't lose or corrupt anything along the way.
Unifying Inconsistent Data Formats
Finally, let's talk about inconsistent formats—the bane of every analyst's existence. Dates are the classic offender. You’ll have one system storing dates as MM/DD/YYYY (04/15/2024), another using YYYY-MM-DD HH:MI:SS (2024-04-15 14:30:00), and maybe even a third storing it as a text string like "April 15, 2024".
Good luck trying to filter or analyze a date range with that mess. It’s impossible.
The solution here is type coercion and format unification. This just means forcing all those different date fields into one, standard format. The ISO 8601 standard (YYYY-MM-DD) is the industry best practice for a reason: it's unambiguous and sorts correctly every single time.
Here's a quick look at how you might do this with a bit of SQL:
SELECT
order_id,
-- Assuming order_date is a messy text field
CAST(PARSE_DATE('%m/%d/%Y', order_date) AS DATE) AS standardized_order_date
FROM
raw_orders;
This simple query takes a jumbled date string and transforms it into a clean, reliable date format that you can actually use for analysis. These cleaning techniques are foundational, and for a deeper look, our guide on how to clean up data effectively is a great resource. By systematically applying these rules, you ensure every piece of data plays by the same rules, which is the key to trustworthy insights and scalable automation.
All that hard work defining metrics and cleaning data? It'll all fall apart if you treat it like a one-off project. Real, lasting data standardization isn’t a single event. It's a continuous, automated process that defends the integrity of your data, day in and day out. The only sustainable way to do this is by building solid data pipelines.
Think of these pipelines as the operational backbone of your entire standardization strategy. They are automated workflows that pull, transform, and load data, systematically applying the cleaning and formatting rules you've already established. By automating this, you stop playing catch-up and constantly fixing errors. Instead, you move to a proactive footing where consistency is just built into the system.
It's like an assembly line for your data. Raw, messy information goes in one end, and clean, standardized, analysis-ready data comes out the other. No more constant manual firefighting.
The Modern Toolkit for Data Transformation
The good news is that building these pipelines has never been more straightforward, thanks to the modern data stack. A couple of tools, in particular, have become the go-to combination for this work: dbt (data build tool) for the transformations themselves and an orchestrator like Apache Airflow to schedule and manage everything.
dbt for Transformation: This is where the magic happens. dbt lets analysts and engineers transform data right inside their warehouse using the SQL they already know. You can write modular, reusable code to apply all your standardization logic—things like casting data types, renaming columns to match your new data dictionary, and joining datasets correctly.
Airflow for Orchestration: If dbt is the musician, Airflow is the conductor. It's the brain that schedules and manages your data pipelines. It ensures your dbt transformations run at the right time (say, every night at 2 AM), in the correct order, and gracefully handles any dependencies or failures along the way.
Put them together, and you have a powerful, automated system that enforces your standards around the clock. The data your team relies on is always fresh and, more importantly, always trustworthy.
The diagram below breaks down the core steps you'd typically build into a pipeline like this, showing how raw data gets systematically refined.
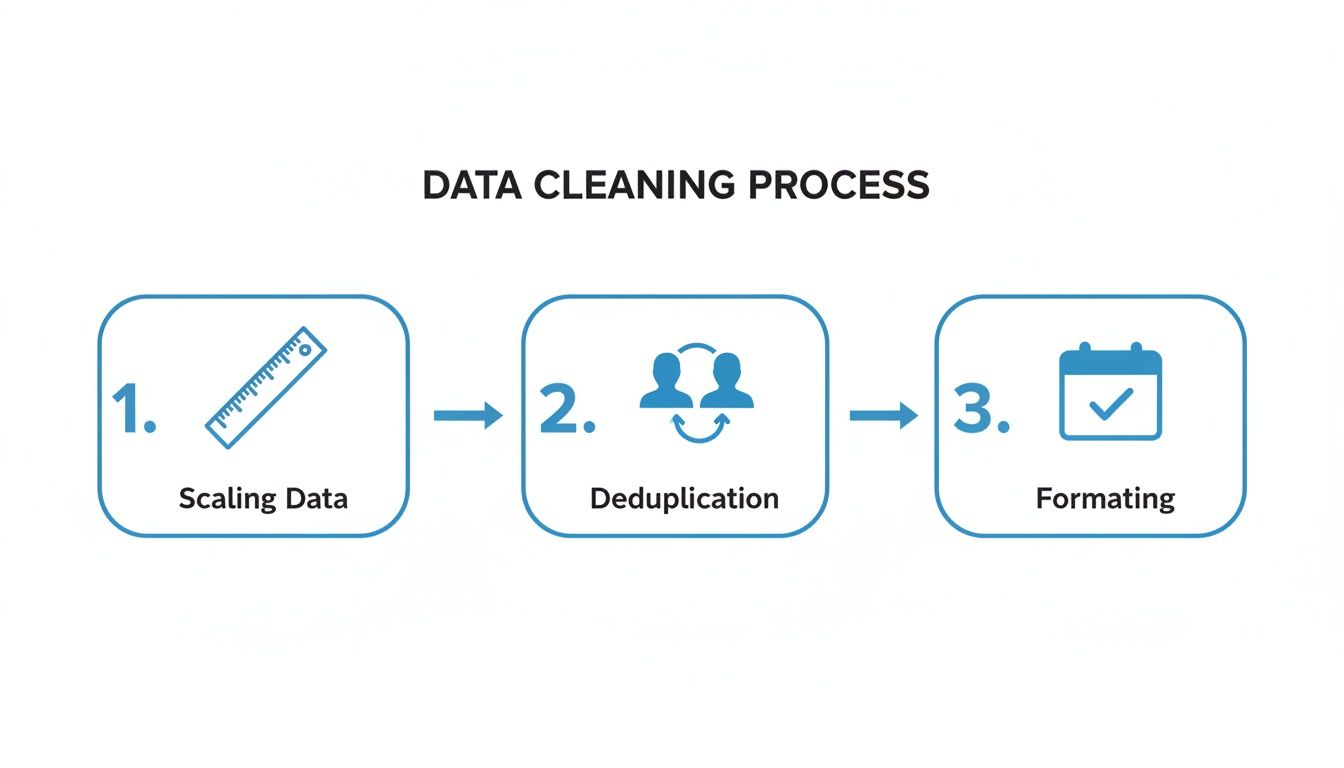
This flow—from scaling and deduplication to final formatting—is the engine that turns messy, inconsistent inputs into reliable, trusted assets.
Shifting to Proactive Quality With Data Contracts
Of course, even the best-automated pipeline can break. And when it does, the culprit is almost always an unexpected change in the source data. A developer on another team renames a column, changes a data type, or removes a field in an upstream application, and suddenly, your downstream dashboards and reports are all broken.
This puts the data team in a frustrating, never-ending cycle of firefighting. You're always reacting to problems you didn't create.
The solution is a concept that’s rapidly gaining traction: data contracts.
A data contract is pretty much what it sounds like: a formal agreement between the people who produce the data (like a product engineering team) and the people who consume it (like the analytics team). It clearly defines the schema, the meaning of the data, and the quality expectations for a specific dataset, essentially acting as a stable, binding API for your data.
A data contract fundamentally shifts responsibility. Instead of the data team discovering a problem downstream after it has caused chaos, the producing team is now responsible for ensuring their changes don't violate the agreed-upon contract. It stops breakage before it ever happens.
This single change in approach can completely transform your data culture from reactive to proactive, saving countless hours and building genuine trust between teams.
A Simple Data Contract Template
Getting started with data contracts doesn't require a massive, complex initiative. It can begin with a simple, documented agreement for your most critical datasets. Here’s a basic structure you can steal and adapt:
Contract Field | Example |
|---|---|
Dataset Name |
|
Owner / Producer | Core Engineering Team |
Consumer(s) | Analytics Team, Marketing Team |
Description | Contains one record per registered user. Updated in real-time. |
Schema Definition |
|
Data Quality Rules |
|
Change Protocol | Any breaking changes require 2 weeks notice to consumers. |
By establishing these contracts, you create a system of shared accountability. When data producers know their changes have real downstream consequences, they become partners in maintaining data quality. It's a simple governance layer, but it might just be the most powerful step you can take to make sure your standardization efforts actually stick.
Enabling Self-Serve Analytics with a Standardized BI Layer
So, why go through all the trouble of standardizing data? The real win isn't just a tidy database. The ultimate payoff for all that hard work—defining metrics, cleaning data, and building pipelines—is empowering your team to make better, faster decisions through trustworthy self-serve analytics. This is where your investment in consistency stops being a backend chore and becomes a strategic asset everyone can use.
A modern business intelligence (BI) tool is the final, crucial piece of this puzzle. Think of it as the gatekeeper and the main entryway for your newly standardized data. It ensures all the rules you’ve meticulously established are actually followed at the point of analysis, preventing that old, familiar chaos from creeping back in.
From Ad-Hoc Requests to Instant Answers
Before you have a solid BI layer, data teams often feel like they're drowning in a sea of one-off requests. A product manager needs a quick cut of user engagement for a presentation right now. A finance analyst needs a specific revenue number for the board report. Each request means a custom query, which creates bottlenecks and, worse, a high risk of inconsistent answers floating around.
A platform like Querio completely flips this dynamic on its head. By connecting directly to your clean, standardized data warehouse, it becomes the single source of truth where business logic is defined once and then applied everywhere. It’s the user-friendly interface that sits right on top of all your foundational data work.
This approach gives everyone access to information without sacrificing accuracy. For example, an AI-powered BI tool can build a deep contextual understanding of your data model. This allows non-technical users from sales, marketing, or operations to ask complex questions in plain English.
A question like, "What was our user engagement in Q2 by region?" no longer requires a data analyst to get sidetracked writing a complex SQL query. Instead, anyone can ask the question and get an accurate, consistent answer in seconds. Why? Because the underlying data is already standardized and the BI tool knows exactly how to interpret it.
Enforcing a Single Source of Truth
The real magic of a BI layer is its ability to enforce your data dictionary at scale. Once you define a metric, every single report, dashboard, and chart across the entire company uses that exact same definition. There's simply no room for someone to spin up their own version of "active users" in a rogue spreadsheet.
Platforms like Querio make this happen through centralized dashboards and knowledge bases. When a key performance indicator (KPI) like "Customer Acquisition Cost" is built, its calculation logic—pulled from your standardized data—is locked in. From that moment on, anyone who pulls that metric gets the exact same number, every single time.
This is what it looks like in practice: an intuitive interface where users can directly explore standardized data without needing to know what’s happening under the hood.

This centralized approach makes your analytics trustworthy and scalable, ensuring every team is working from the same playbook.
This concept is often called a semantic layer—a business-friendly map of your data that translates complex database schemas into terms everyone understands. It’s the bridge between your technical data model and the everyday questions your business teams need answers to. To dig deeper into this, check out our guide on exploring semantic layers in business intelligence and see how they create that crucial consistency.
The True Impact of Standardized Self-Serve Analytics
Reaching this final stage has a massive impact that ripples through every corner of the organization. It's about much more than efficiency; it’s about finally building a true data-driven culture.
For Product Teams: They can track feature adoption and user behavior on their own, without waiting in a queue for the data team. This means they can iterate faster and make product decisions based on real-time, reliable insights.
For Finance Leaders: Automating board reports becomes simple and error-free. They can trust that the metrics are consistent with those used by every other department, which finally puts an end to those last-minute scrambles to reconcile numbers.
For Operations Teams: They can monitor performance and spot inefficiencies using live dashboards, moving away from those cumbersome and often outdated Excel files they've been wrestling with for years.
When you successfully standardize your data and pipe it through a user-friendly BI layer, you’re doing more than just cleaning up a database. You’re breaking the endless cycle of manual reporting, ending the arguments over whose numbers are right, and turning your data from a chaotic liability into a powerful engine for growth.
A Few Common Questions About Data Standardization
Even with a solid game plan, you're bound to run into a few tricky spots on the road to standardized data. Let's tackle some of the most common questions that pop up, clearing the air so you can keep moving forward.
What Are The Most Common Data Standardization Methods?
When you get down to the nitty-gritty of standardization, you'll find a handful of core techniques do most of the heavy lifting. Think of these as the essential tools in your data quality workshop. Each is built for a specific kind of mess, and knowing which one to grab is half the battle.
Here are the methods you'll use most often:
Z-Score Normalization: This is a statistical approach for rescaling numbers so they have a mean of 0 and a standard deviation of 1. It’s incredibly useful for many machine learning models and statistical tests that work best when your data follows a normal distribution.
Min-Max Scaling: A much simpler but equally powerful technique. This method squishes numeric values into a fixed range, usually 0 to 1. This is a lifesaver when you need to compare features on totally different scales, like a customer's age versus their lifetime spending.
Categorical Data Encoding: Business data is full of text labels—"USA," "Canada," "Mexico"—that algorithms can't crunch. Methods like One-Hot Encoding or Label Encoding are your translators, converting these text-based categories into numbers that models can actually understand.
Date and Time Unification: Ah, the classic headache. This is all about getting every date and time field into one, single format and timezone. Your best bet is to adopt the ISO 8601 format (
YYYY-MM-DD) and convert everything to UTC. It’s the gold standard for a reason.Text Cleaning: For any free-text field, this process involves making the text consistent. That means doing things like converting everything to lowercase, stripping out punctuation, and maybe even stemming words to their root (turning "running" and "ran" into "run").
How Do You Handle Standardization Across Different Departments?
Let's be honest: getting different departments to agree on data definitions is more of a people problem than a tech problem. The issue usually boils down to perspective. What "customer" means to Sales can be wildly different from what it means to Finance. The solution is to create a formal structure for collaboration and shared ownership.
The first step is to assemble a Data Governance Council. This isn't just another meeting on the calendar; it’s a dedicated, cross-functional team with a representative from every key department—think Product, Finance, Sales, and Operations. Their mission? To build, own, and maintain that central data dictionary we talked about earlier.
Securing buy-in from leadership is absolutely critical here. This council needs the authority to make final calls on metric definitions. Without that top-down support, its decisions are just suggestions, and you’ll end up right back where you started.
This council should spearhead workshops to hash out the definitions for the company's most important KPIs, like "Monthly Active User" or "Net Revenue." Once everyone agrees, that definition gets locked down in a central, easy-to-find place. The final piece is enforcement, where your automated data pipelines and BI tool step in to ensure this single source of truth is the only version of the data anyone can access.
What Is The Difference Between Data Standardization And Data Normalization?
This one trips a lot of people up, but the distinction is pretty straightforward once you see it. The terms are related, but they operate at different scales. It’s like the difference between "transportation" and "a car."
Data standardization is the big picture. It's the entire, overarching process of bringing all your data into a common format and meaning to ensure consistency. It’s the whole project—an umbrella term covering everything from cleaning data and removing duplicates to unifying date formats and getting everyone to agree on business terms. It’s about making your data make sense across the whole organization.
Data normalization, on the other hand, is a specific tool you use during that larger process. It specifically refers to the mathematical task of rescaling numeric data to fit a certain range or distribution. Both Min-Max scaling and Z-score standardization are types of normalization.
So, in a nutshell, normalization is just one of the many techniques in your standardization toolkit. You might normalize a few numeric columns, but you standardize your entire data ecosystem.
Ready to stop debating whose numbers are right and empower your team with a single source of truth? Querio is an AI-powered BI platform that connects to your standardized data, allowing anyone to get instant, accurate answers just by asking questions.
Discover how Querio can transform your data into a strategic asset

