Guide
7 Real-World Example of Sales Forecasting Methods (2025)
Explore a real-world example of sales forecasting for 7 different methods, from AI to regression analysis. See how top companies improve accuracy.
Sales forecasting often feels like a mix of art and science, but the right methods can turn uncertain predictions into a reliable strategic advantage. Poor forecasting leads to stockouts, bloated inventory, missed targets, and misallocated resources. Getting it right, however, aligns your entire organization from marketing spend and hiring plans to production schedules and cash flow management. This is because every accurate forecast relies on a foundation of clean, reliable information. For real-world sales forecasting to be effective, it’s crucial to understand how to properly collect and leverage accurate information. Discover how to effectively improve data quality for B2B growth, as reliable data is the backbone of any precise forecast.
This article moves beyond theory to provide a deep dive into seven distinct sales forecasting methods. For each one, we'll break down a concrete example of sales forecasting, revealing the strategic analysis, tactical implementation, and actionable takeaways you can apply to your own business. We'll explore how giants like Amazon and Coca-Cola build their models and how you can leverage similar principles, even without their massive resources. We'll also see how modern BI tools are democratizing access to complex forecasting, allowing teams to analyze data and get answers in seconds, not weeks.
1. Time Series Forecasting with Moving Averages
Time series forecasting is a statistical method that uses historical data points collected over time to predict future outcomes. The moving average technique, a core component of this approach, calculates the average of a specific number of recent data points, effectively smoothing out random, short-term fluctuations and highlighting longer-term trends or cycles. This makes it an invaluable example of sales forecasting for businesses with extensive historical sales data.
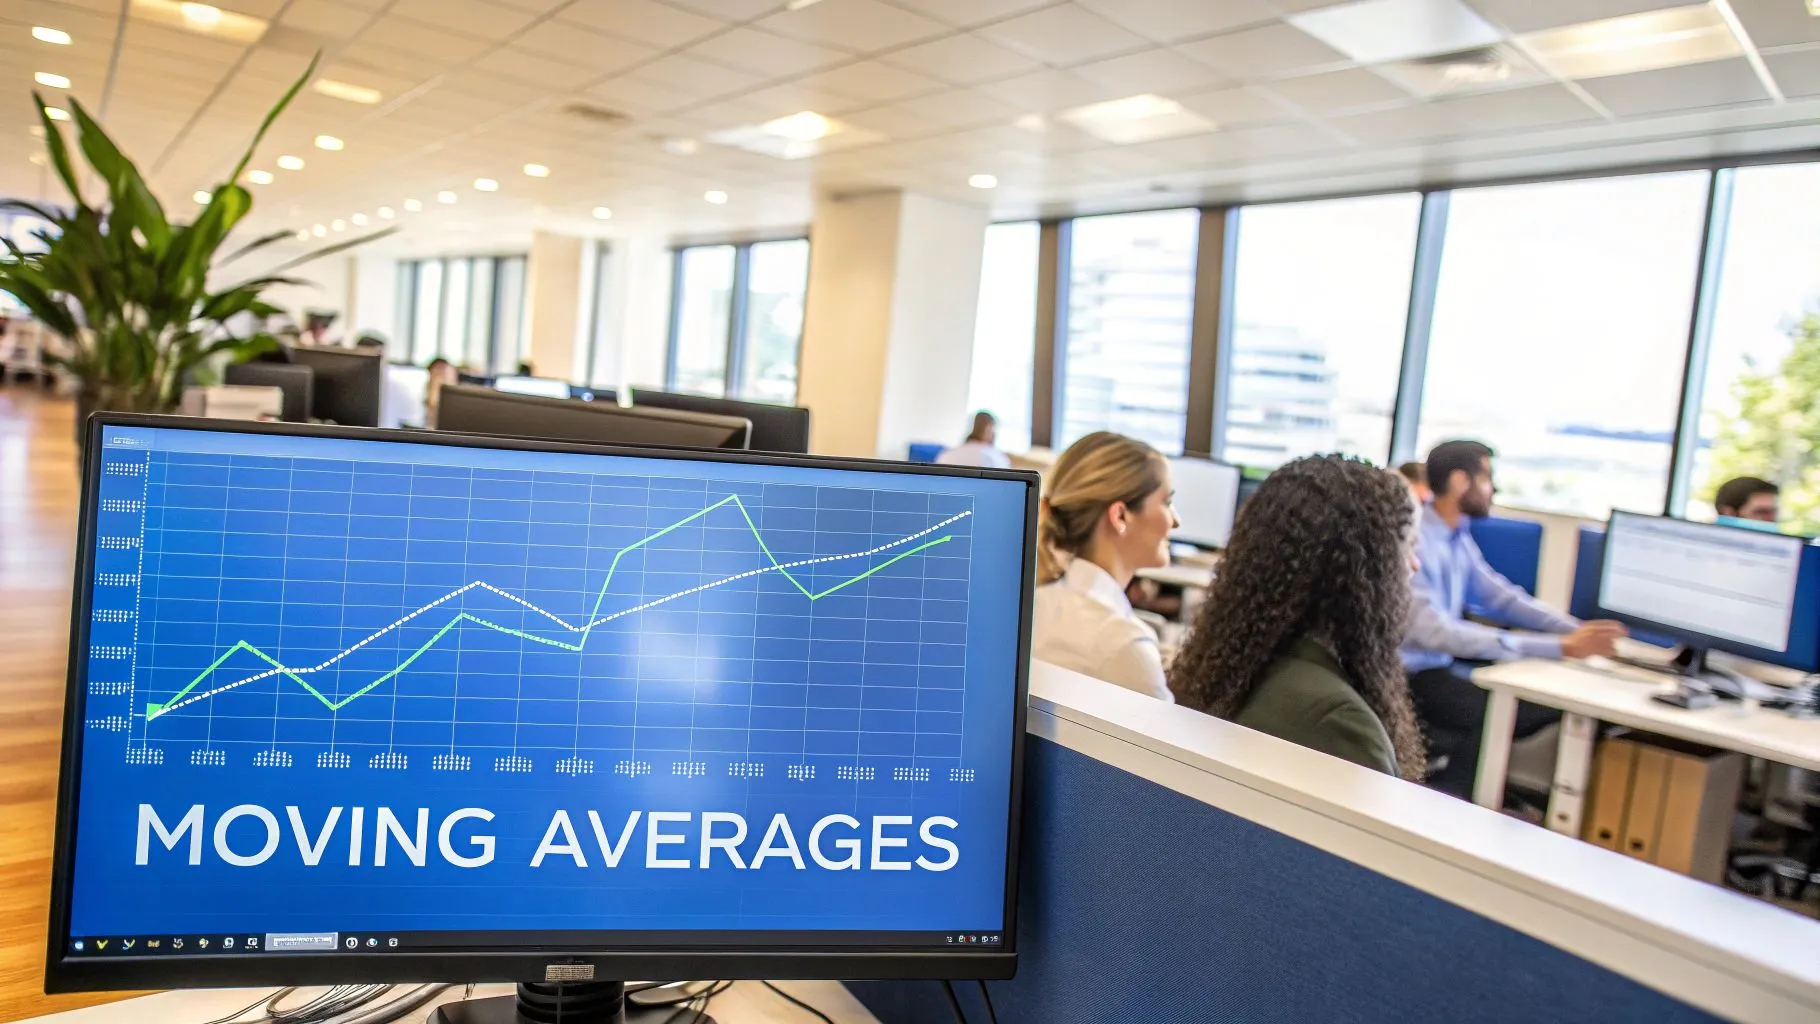
The core principle is simple: the average of past performance is a reliable indicator of future performance. For instance, a 3-month moving average would average the sales of the last three months to forecast the next month. This method is particularly effective for identifying stable trends and seasonality.
Strategic Breakdown & Real-World Application
This technique is a cornerstone for many large-scale retail and CPG companies. For example, Walmart reportedly uses moving average models as part of its sophisticated inventory planning system. By analyzing historical sales data for tens of thousands of individual products (SKUs), the company can forecast demand at a granular level, ensuring optimal stock levels and minimizing carrying costs.
Similarly, McDonald's applies this method to forecast demand for seasonal menu items like the McRib or Shamrock Shake. By averaging sales data from previous promotional periods, they can more accurately predict consumer demand, optimize their supply chain, and plan marketing campaigns for maximum impact.
Key Insight: Moving averages excel at providing a stable, smoothed baseline forecast. They filter out the "noise" from daily or weekly sales spikes, revealing the true underlying sales trajectory. This stability is crucial for strategic decisions in inventory, staffing, and marketing budgets.
Actionable Takeaways & Best Practices
To effectively implement this forecasting model, consider the following tactics:
-
Select the Right Time Period: Use a shorter period (e.g., 3-month moving average) for short-term forecasts and volatile products. Use a longer period (e.g., 12-month) to identify long-term trends and smooth out significant seasonality.
-
Apply Seasonal Adjustments: For businesses with strong seasonal peaks like holidays, adjust the moving average forecast with a seasonal index to improve accuracy.
-
Combine with Other Methods: While powerful, moving averages can lag behind new trends. For a more robust forecast, combine it with other qualitative or quantitative methods.
This method is best suited for businesses with at least one to two years of consistent sales data.
2. CRM-Based Pipeline Forecasting
CRM-based pipeline forecasting is a modern sales forecasting method that leverages data from a Customer Relationship Management (CRM) system. It predicts future revenue by analyzing the current sales pipeline, including deal stages, opportunity values, and historical win rates. This approach uses real-time opportunity data to generate a dynamic and forward-looking example of sales forecasting that is directly tied to active sales efforts.
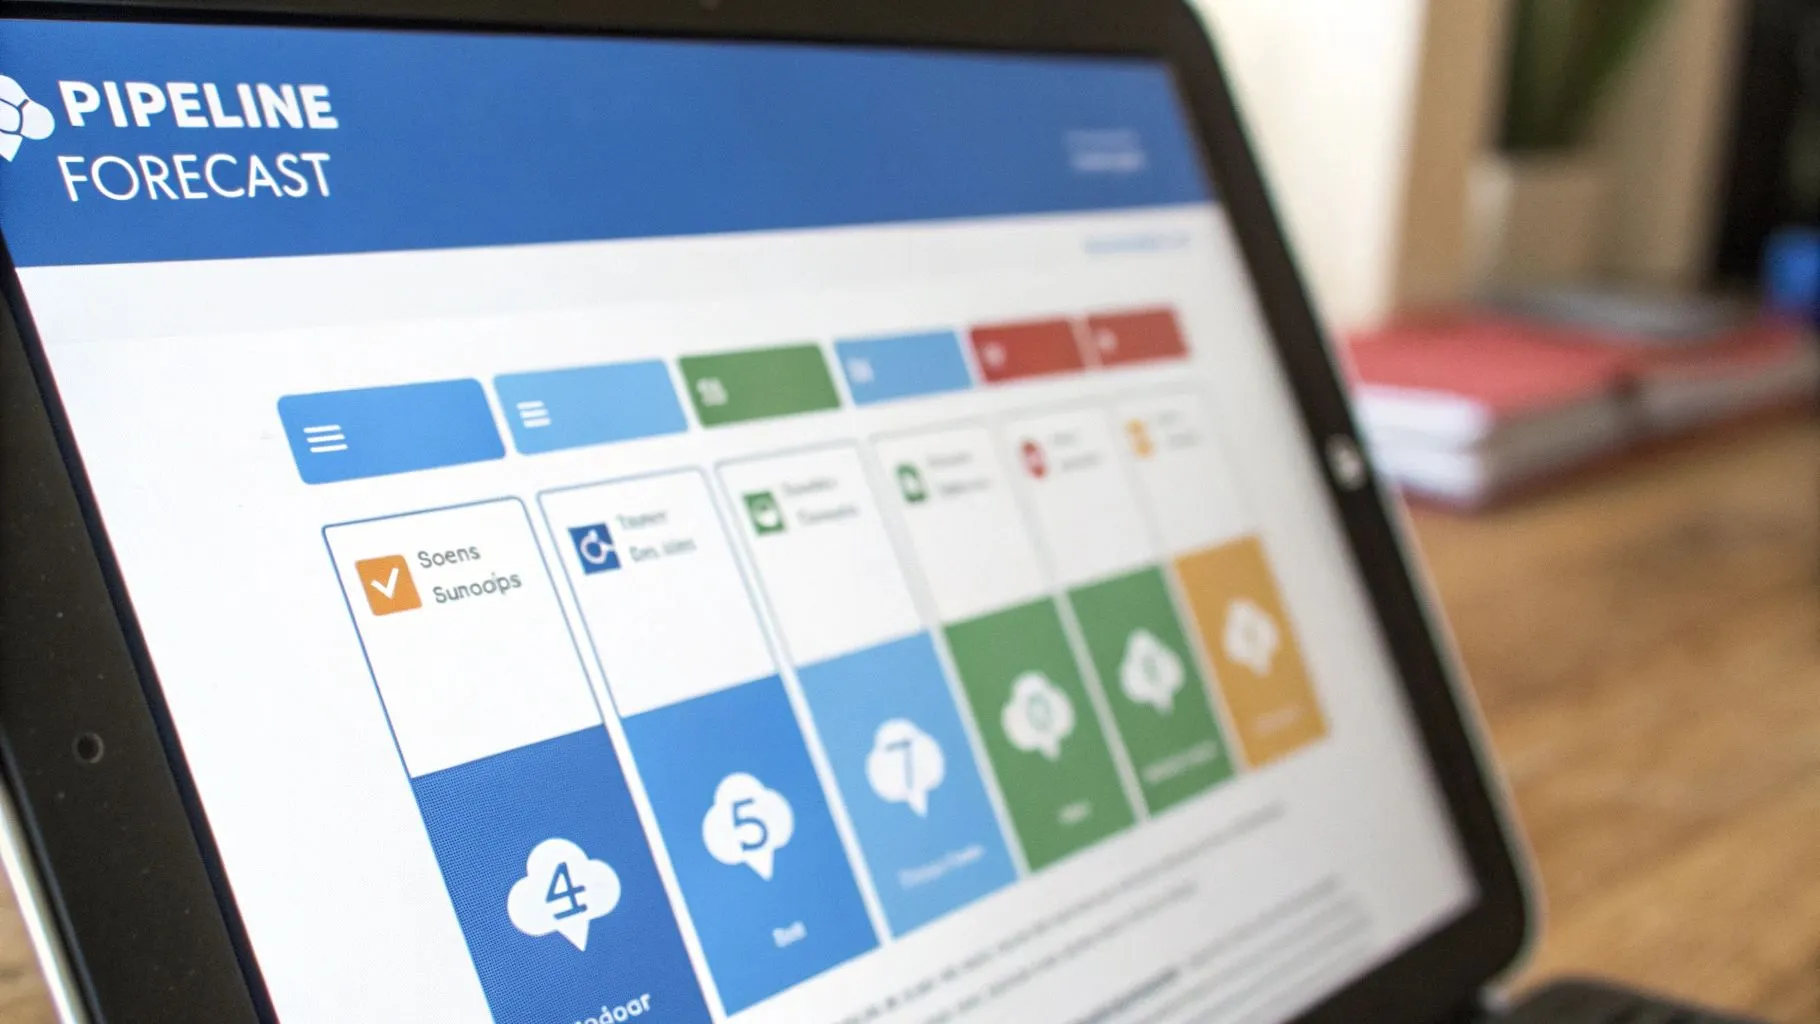
The underlying logic is that each stage in the sales pipeline has a specific probability of closing. By multiplying the value of each deal by its stage probability and summing the results, a company can generate a weighted forecast. This provides a data-driven view of what revenue the sales team is likely to achieve.
Strategic Breakdown & Real-World Application
This technique has been championed by CRM giants like Salesforce, HubSpot, and Microsoft, who build these capabilities directly into their platforms. Salesforce, for instance, reported that customers using its own pipeline forecasting tools saw an average of 15% improvement in forecast accuracy. This is achieved by giving sales leaders a real-time, consolidated view of all deals, which eliminates manual spreadsheet compilation and reduces human error.
Similarly, HubSpot customers often see a 23% improvement in forecast accuracy by leveraging its built-in pipeline management tools. The system automates probability assignments based on deal stage, allowing managers to focus on coaching and strategy rather than data crunching. Microsoft Dynamics users also report an 18% improvement in sales predictability, using the platform's AI features to identify at-risk deals and provide more accurate projections.
Key Insight: Pipeline forecasting turns sales from a pure "art" into a measurable science. It provides an objective, data-backed view of future revenue, allowing leaders to identify pipeline gaps, allocate resources effectively, and make proactive decisions before a quarter ends.
Actionable Takeaways & Best Practices
To effectively implement this forecasting model, consider the following tactics:
-
Define Clear Deal Stages: Establish standardized, non-negotiable definitions and exit criteria for each stage of your sales process to ensure data consistency. Implementing actionable sales pipeline management tips is the cornerstone of effective CRM-based pipeline forecasting, ensuring accurate predictions and improved sales cycles.
-
Use Historical Win Rates: Instead of guessing, calculate the actual historical conversion rate for each stage. Use this data to assign more accurate probabilities for your weighted forecast.
-
Conduct Regular Pipeline Reviews: Hold weekly or bi-weekly sessions to review deals, update stages, and clean up stalled or dead opportunities. This keeps the data fresh and the forecast relevant.
This method is best suited for B2B companies with a structured sales process and a well-maintained CRM. It provides a highly accurate forecast for the current and upcoming quarters.
3. Regression Analysis Forecasting
Regression analysis is a powerful statistical method that models the relationship between a dependent variable (like sales) and one or more independent variables (such as marketing spend, price, or economic indicators). By identifying and quantifying these relationships, businesses can build a mathematical equation to predict future sales based on changes in the influencing factors. This makes it a highly sophisticated and accurate example of sales forecasting for understanding the "why" behind sales performance.
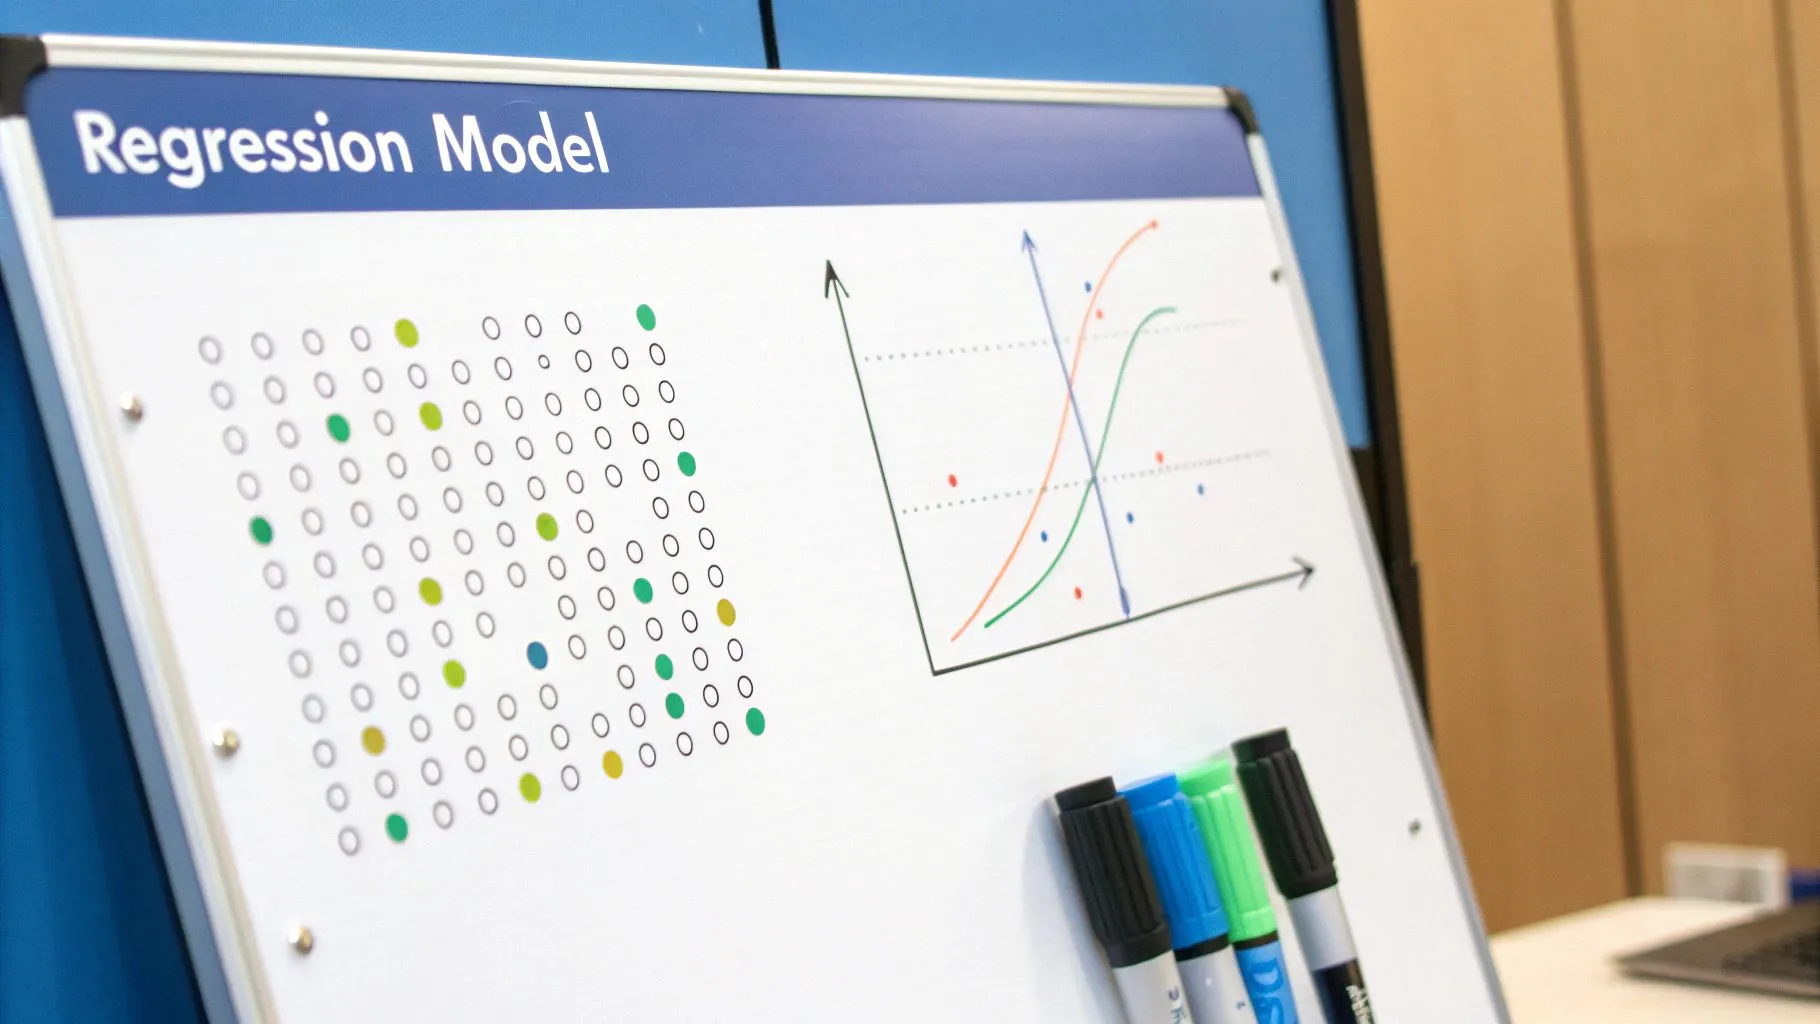
The model establishes a correlation, such as how a 10% increase in digital ad spend might lead to a 2% increase in sales, all other factors remaining constant. This allows companies to not only forecast future outcomes but also to simulate the potential impact of strategic business decisions before they are made.
Strategic Breakdown & Real-World Application
This method is a favorite among data-driven companies that need to understand the complex interplay of various market forces. For instance, Coca-Cola famously uses regression analysis to link weather patterns with beverage sales. By modeling the relationship between temperature, humidity, and consumer purchasing behavior, the company can predict spikes in demand during heatwaves and adjust its distribution and inventory levels regionally for maximum efficiency.
Similarly, a company like Netflix can use regression models to forecast subscriber growth. Independent variables might include content acquisition spend, marketing campaign reach in new markets, competitor pricing, and even macroeconomic indicators like disposable income. This helps them justify massive content investments and plan for global expansion with greater confidence.
Key Insight: Regression analysis moves beyond simply projecting past trends; it explains the drivers of sales. This allows leaders to conduct "what-if" scenarios, such as predicting the sales impact of a price cut or an increased marketing budget, turning forecasting into a strategic planning tool.
Actionable Takeaways & Best Practices
To successfully deploy regression analysis for sales forecasting, follow these best practices:
-
Start with Simple Models: Begin with a simple linear regression (one independent variable) to understand the core relationship before adding more complexity with multiple regression models.
-
Ensure Data Quality: The accuracy of your model is entirely dependent on the quality and relevance of your input data. Ensure data is clean, accurate, and covers a sufficient historical period.
-
Validate Your Model: Regularly test your model's assumptions and predictive accuracy using techniques like cross-validation. The relationships between variables can change over time, requiring model adjustments.
This method is ideal for businesses with access to robust historical data for both sales and a variety of potential influencing factors. For those wanting to explore this further, you can get an introduction to regression models and their business applications.
4. Machine Learning and AI-Powered Forecasting
Machine learning and AI-powered forecasting represent the cutting edge of predictive analytics, leveraging complex algorithms to analyze vast datasets far beyond human capacity. These systems identify subtle patterns, correlations, and external factors like market trends, competitor pricing, or even weather data to generate highly precise sales predictions. This sophisticated approach serves as a powerful example of sales forecasting for businesses operating in dynamic, data-rich environments.
Unlike static models, AI systems continuously learn from new data, refining their algorithms and improving forecast accuracy over time. This adaptive capability allows businesses to react swiftly to changing market conditions and consumer behaviors.
Strategic Breakdown & Real-World Application
This advanced technique is the engine behind the world's largest e-commerce and tech companies. Amazon, for example, uses its ML algorithms to forecast demand for millions of individual products, achieving a reported accuracy rate of over 95%. This precision minimizes stockouts on popular items and reduces overstocking of slow-moving goods, directly impacting warehouse efficiency and profitability.
Similarly, Tesla applies machine learning to predict vehicle demand on a regional basis, factoring in economic indicators, local incentives, and online engagement. This allows the company to optimize its production schedules and supply chain logistics, ensuring that vehicle deliveries align with fluctuating market demand and avoiding costly production bottlenecks.
Key Insight: The primary advantage of AI forecasting is its ability to process and synthesize a massive number of variables simultaneously. It moves beyond historical sales data to incorporate external factors, providing a holistic and dynamic view of future demand that traditional methods cannot replicate.
This infographic summarizes the core capabilities of AI-driven forecasting.
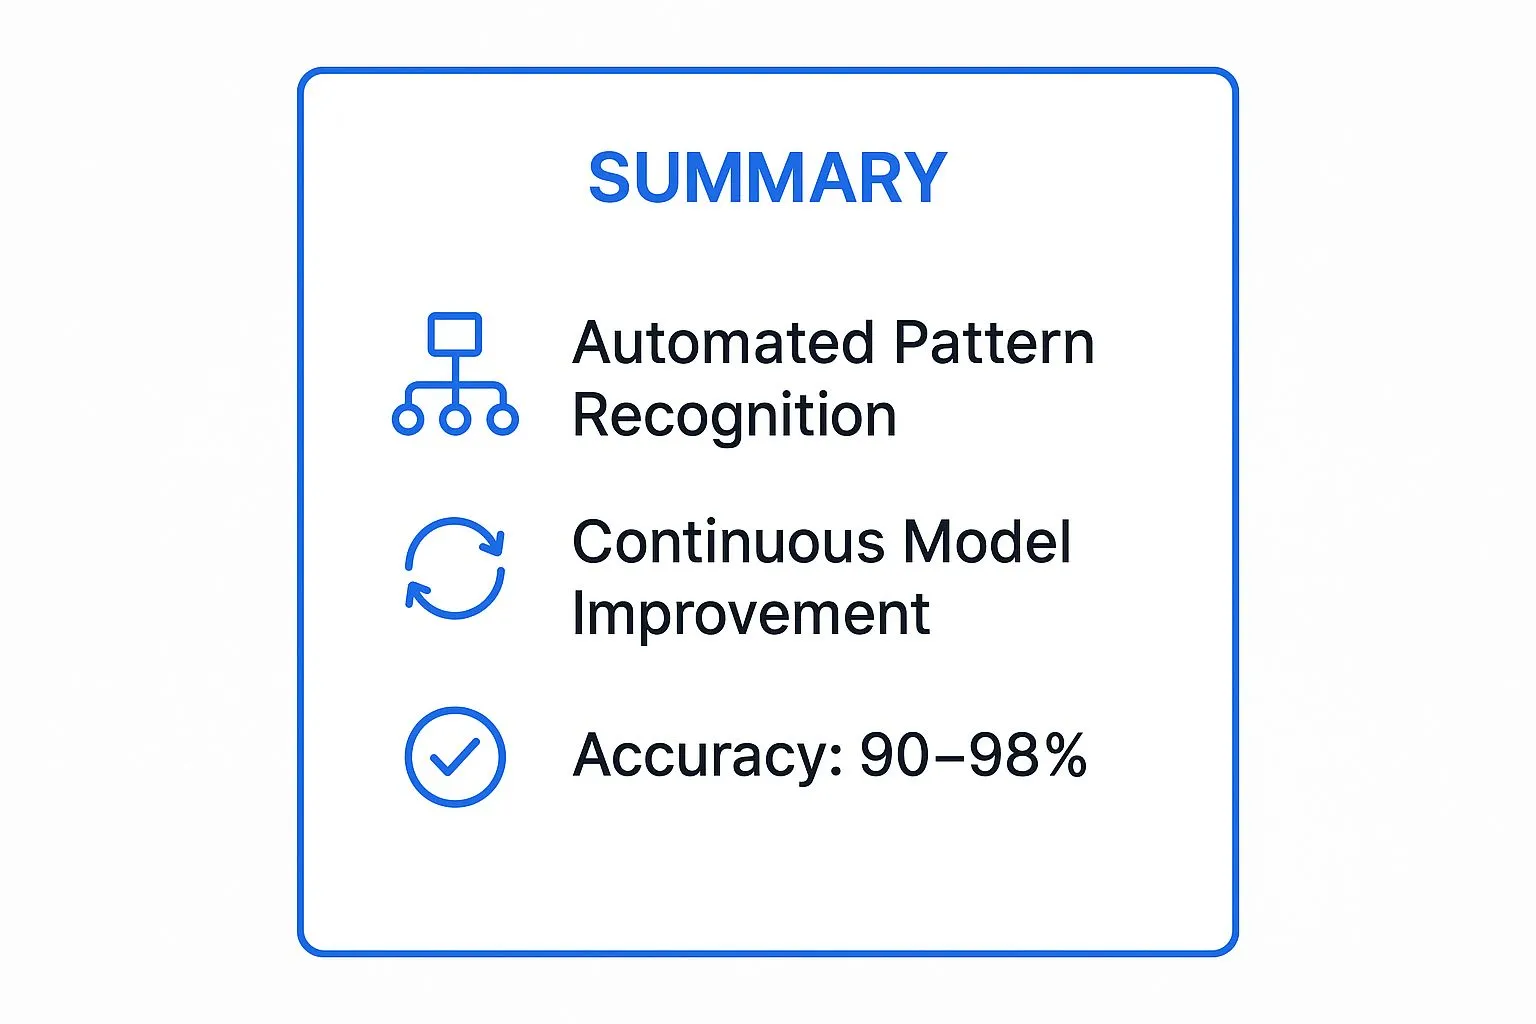
The combination of automated pattern recognition and continuous improvement is what enables these models to reach such high levels of accuracy.
Actionable Takeaways & Best Practices
To successfully integrate AI into your forecasting process, follow these best practices:
-
Ensure Data Quality: AI models are only as good as the data they are trained on. Prioritize clean, high-quality, and comprehensive data as the foundation for your forecasting initiatives.
-
Start with a Pilot Program: Begin by applying machine learning to a specific, high-volume product line to prove its value and refine your approach before a company-wide rollout.
-
Combine AI with Human Judgment: Use AI-generated forecasts as a highly accurate baseline, but empower your sales and planning teams to apply their business acumen and strategic insights for final adjustments.
-
Regularly Retrain Models: The market is constantly changing. Periodically retrain your models with the latest data to ensure they remain accurate and relevant.
AI forecasting is ideal for large enterprises with complex product catalogs and access to large datasets. For those ready to explore this technology, you can discover more about the available AI tools for data analysis.
5. Bottom-Up Territory and Rep-Based Forecasting
Bottom-up forecasting is a grassroots method where predictions originate from the sales representatives and territory managers closest to the customer. Each rep analyzes their individual pipeline, customer relationships, and market intelligence to estimate their future sales. These granular forecasts are then aggregated, or “rolled up,” through management layers to form a comprehensive, company-wide projection, making this a powerful example of sales forecasting grounded in real-world activity.
The core principle is that those on the front lines have the most accurate, up-to-date insight into deal probabilities and customer intent. This approach leverages the collective intelligence of the entire sales force, providing a forecast built on tangible opportunities rather than high-level assumptions.
Strategic Breakdown & Real-World Application
This technique is a staple in enterprise software and complex B2B sales environments. For instance, Oracle's global sales organization relies on bottom-up forecasting from its tens of thousands of sales professionals. Each rep submits a forecast based on their territory's pipeline, which is then reviewed and consolidated at the regional and global levels, providing a highly detailed view of expected revenue.
Similarly, SAP combines individual rep forecasts with advanced analytics. Reps provide their deal-by-deal assessments, which the company then validates against historical data and machine learning models. Johnson & Johnson’s pharmaceutical division also employs territory-based forecasting, where sales reps predict demand for specific drugs based on their relationships with healthcare providers and knowledge of local market dynamics.
Key Insight: Bottom-up forecasting creates a high degree of accountability and ownership within the sales team. Because reps are responsible for building the forecast, they are more invested in its accuracy and more motivated to hit the numbers they personally committed to.
Actionable Takeaways & Best Practices
To effectively implement this forecasting model, consider the following tactics:
-
Provide Clear Guidelines: Equip your sales team with standardized templates and clear definitions for forecast categories (e.g., commit, best case, pipeline) to ensure consistency across all submissions.
-
Track Forecast vs. Actuals: Regularly compare individual rep forecasts against their actual sales results. This helps identify reps who may be overly optimistic or conservative and provides coaching opportunities to improve accuracy over time.
-
Combine with Top-Down Methods: Use a top-down, market-based forecast as a sanity check against the aggregated bottom-up number. A large discrepancy between the two can signal potential pipeline gaps or unrealistic market assumptions.
This method is best suited for organizations with a direct sales force and a well-defined sales process. For more on structuring sales territories to support this, you can read about sales territory planning strategies.
6. Market Research and Customer Intent Forecasting
Market research and customer intent forecasting is a forward-looking approach that predicts sales by directly tapping into the voice of the customer. Instead of relying solely on past sales, this method uses customer surveys, buying intention studies, and behavioral data to gauge future demand. It's a powerful example of sales forecasting that focuses on understanding customer needs, preferences, and explicit purchase intentions before they make a decision.
This technique operates on the premise that the most accurate source of future sales information is the potential buyer. By analyzing what customers say they will do (intent) and how they behave (actions), companies can build a predictive model for new products or shifts in market trends, areas where historical data is often non-existent or unreliable.
Strategic Breakdown & Real-World Application
This method is indispensable for product launches and market entry strategies. For instance, before launching a new iPhone, Apple combines extensive market research with analysis of online search trends and pre-order data. This allows them to gauge excitement, feature preferences, and purchase intent, informing initial production volumes and supply chain logistics to meet anticipated demand.
Similarly, Procter & Gamble (P&G) heavily invests in consumer research before launching new products like a new Tide Pod variant. Through focus groups, surveys, and in-home usage tests, P&G forecasts initial sales volume, identifies the target demographic, and refines marketing messages, significantly reducing the risk of a costly failed launch.
Key Insight: Customer intent forecasting excels where historical data falls short. It provides a direct line of sight into future market behavior, making it crucial for innovation, new product development, and understanding the potential impact of competitive actions.
Actionable Takeaways & Best Practices
To effectively leverage market research for sales forecasting, consider these tactics:
-
Combine Qualitative and Quantitative Data: Use focus groups and interviews (qualitative) to understand the "why" behind customer preferences, and use large-scale surveys (quantitative) to validate these insights across a wider audience.
-
Focus on Leading Indicators: Track pre-purchase behaviors like website visits to specific product pages, "add to cart" actions, and search query trends. These are strong leading indicators of future sales.
-
Conduct Regular Pulse Surveys: Don't treat market research as a one-time event. Regular, short surveys can help you track shifts in consumer sentiment and purchase intent in real-time, allowing for agile adjustments to your forecast.
This method is best suited for new product launches, entering new markets, or for businesses operating in rapidly changing industries. To explore the foundational concepts, you can learn more about the methodologies used by pioneers like NielsenIQ.
7. Econometric and Leading Indicator Forecasting
Econometric forecasting is a sophisticated approach that models the relationship between sales performance and external economic variables. It moves beyond internal historical data to incorporate leading indicators such as GDP growth, consumer confidence, and industry-specific metrics. This method creates a powerful statistical model, providing an advanced example of sales forecasting that links business success directly to broader market trends.
The underlying principle is that external economic forces significantly influence consumer and business spending. By identifying and quantifying these relationships, a company can predict how shifts in the economic landscape will impact future revenue. This makes the forecast more dynamic and responsive to market conditions than methods that rely solely on past sales.
Strategic Breakdown & Real-World Application
This technique is essential for industries highly sensitive to economic cycles. For instance, General Motors heavily relies on economic indicators like consumer confidence indices, interest rates, and GDP growth to forecast vehicle demand. When consumer confidence is high and interest rates are low, they can confidently predict an uptick in car sales and adjust production accordingly.
Similarly, Caterpillar, a leader in construction equipment, correlates its sales forecasts with leading indicators such as government infrastructure spending, housing starts, and global commodity prices. A surge in planned infrastructure projects signals a future increase in demand for their machinery, allowing them to manage their supply chain and production schedules proactively, often months in advance.
Key Insight: Econometric forecasting excels at providing a macro-level, context-aware prediction. It answers not just what sales will be, but why, by connecting performance to tangible economic drivers. This is invaluable for long-range strategic planning and navigating economic uncertainty.
Actionable Takeaways & Best Practices
To effectively implement this advanced forecasting model, consider the following tactics:
-
Identify Key Indicators: Pinpoint the 3-5 economic indicators that show the strongest correlation with your sales data. These could be industry-specific (e.g., construction permits) or broad (e.g., unemployment rates).
-
Use Composite Indices: Instead of relying on a single volatile indicator, use composite indices like the Conference Board Leading Economic Index (LEI) for a more stable and reliable signal.
-
Validate and Refine: Regularly test your model's predictions against actual sales results. Be prepared to refine the model by adding or removing variables as economic relationships evolve over time.
This method is best suited for established businesses with sufficient historical data to build a statistically significant model. For those looking to explore this further, you can learn more about financial planning and analysis tools that facilitate such complex modeling.
7 Sales Forecasting Methods Comparison
| Forecasting Method | Implementation Complexity 🔄 | Resource Requirements ⚡ | Expected Outcomes 📊 | Ideal Use Cases 💡 | Key Advantages ⭐ |
|---|---|---|---|---|---|
| Time Series Forecasting with Moving Averages | Low - simple statistical method | Minimal - requires historical data | Moderate accuracy (70-85%) for stable markets | Stable sales patterns with sufficient historical data | Easy to implement, good baseline, identifies trends |
| CRM-Based Pipeline Forecasting | Moderate - CRM integration & setup | Requires CRM system and user input | High accuracy (75-90%) with real-time updates | Sales-driven organizations with active pipelines | Real-time, stage-based, incorporates team insights |
| Regression Analysis Forecasting | High - needs statistical expertise | Skilled analysts and clean large datasets | High accuracy (80-95%) with variable impact analysis | Complex sales influenced by many factors | Multi-variable, confidence testing, scenario planning |
| Machine Learning and AI-Powered Forecasting | Very High - advanced technical setup | Significant investment and data infrastructure | Very high accuracy (90-98%), self-improving models | Large datasets, dynamic markets requiring adaptability | Handles complexity, continuous improvement, real-time |
| Bottom-Up Territory and Rep-Based Forecasting | Low to moderate - decentralized input | Time-intensive data collection | Variable accuracy (65-80%) dependent on discipline | Businesses leveraging frontline sales knowledge | Leverages local insights, builds ownership, accounts for nuances |
| Market Research and Customer Intent Forecasting | Moderate to high - research design | High cost and time for surveys/data | Moderate accuracy (70-85%), early trend capturing | New product launches, market-driven demand forecasting | Captures customer intent, less reliant on history |
| Econometric and Leading Indicator Forecasting | High - requires economic expertise | Expertise and external economic data | High accuracy (75-90%) on macro trends | Long-term strategic planning, industries sensitive to economy | Incorporates economic impacts, early warning signals |
From Examples to Execution: Building Your Forecasting Strategy
The diverse examples of sales forecasting explored in this article, from straightforward time series analysis to complex machine learning models, all point to a single, critical truth: there is no universal "best" method. The most effective forecasting is not a static report but a dynamic, strategic process. The real power lies in understanding that the optimal approach is often a hybrid, blending quantitative rigor with qualitative, human insights.
As we've seen, a SaaS startup might start with a simple CRM-based pipeline forecast but later incorporate regression analysis to understand how marketing spend impacts lead velocity. Similarly, a mature CPG brand can use sophisticated econometric models to predict market shifts while still relying on bottom-up forecasts from regional sales managers to capture on-the-ground intelligence. The key takeaway is to move from passive prediction to active strategic planning.
Synthesizing the Methods for Actionable Insight
The journey to forecasting mastery begins by selecting a baseline method that aligns with your current data availability, business model, and team capabilities. From there, the goal is continuous refinement.
-
Start Simple, Layer Complexity: Don't try to implement a machine learning model if your CRM data is disorganized. Begin with a method you can execute consistently, like moving averages or pipeline analysis, and establish a baseline for accuracy.
-
Create a Feedback Loop: Your forecast is a living document. Regularly compare your predictions to actual results (forecast vs. actuals analysis). This isn't about assigning blame; it's about identifying systemic biases and understanding what you missed.
-
Blend Quantitative and Qualitative: The most robust example of sales forecasting often involves triangulation. Use a quantitative method like regression to set a data-driven baseline, then adjust it based on qualitative insights from your sales team, market research, and customer intent signals.
The ultimate objective isn't just to land on a more accurate number. It’s to develop a profound, multidimensional understanding of the specific drivers and levers that influence that number. This deeper insight transforms your forecast from a simple prediction into a powerful tool for strategic decision-making, enabling smarter resource allocation, proactive inventory management, and more confident financial planning.
Accelerating Your Forecasting Maturity
Achieving this level of strategic foresight requires agility. The traditional process of wrestling with complex spreadsheets or waiting in line for technical resources creates a bottleneck that stifles iteration and discovery. Modern analytics platforms are designed to break this cycle. Instead of being bogged down by the mechanics of data extraction and modeling, your team can focus on asking better questions.
Imagine being able to ask, in plain English, 'What was our forecast accuracy last quarter, broken down by sales territory?' or 'Correlate our competitor's promotional activity with our sales dips over the past year.' This accessibility allows you to rapidly test hypotheses, compare the outputs of different forecasting models, and share critical insights across finance, sales, and operations. By turning data into a conversation, you empower every stakeholder to contribute to and benefit from a more accurate, collaborative, and actionable sales forecast.
Ready to move from theory to action? Querio empowers your entire team to explore data and get answers from your business intelligence tools using natural language. Stop waiting for reports and start building a more accurate, agile forecasting process today by asking questions and getting instant insights. Visit Querio to learn more.