A Guide to White Label Reporting for Modern Product Teams
Discover how white label reporting drives revenue and customer loyalty. This guide covers key features, implementation, and calculating ROI for SaaS businesses.
https://www.youtube.com/watch?v=VpLdS4r4-yk
published
Outrank AI
white label reporting, embedded analytics, SaaS analytics, customer facing dashboards, product team tools
3dbedb3a-7fb5-4f80-b31f-e0f8d89f2bdc

So, what exactly is white label reporting?
Imagine a high-end restaurant. They might serve incredible, artisanal bread that tastes like it was baked right there in their kitchen. But often, that bread comes from a specialized local bakery that does one thing and does it perfectly. The restaurant rebrands it, serves it on their own plates, and the customer gets an amazing product without knowing—or caring—about the logistics.
That's white label reporting in a nutshell. It's the practice of embedding a powerful, third-party analytics and reporting tool directly into your own software, but with your branding, colors, and logos. Your customers get beautiful, insightful dashboards that feel like a core part of your application, and you didn't have to build the complex reporting engine from the ground up.
The Core Idea: Focusing on What You Do Best

At its heart, this approach is a strategic shortcut to delivering value. Instead of pulling your engineering team off your main product for months (or even years) to build a reporting feature from scratch, you integrate a solution that's already been perfected.
This isn't just a quick fix; it's a fundamental decision about where to invest your most valuable resource: your team's time. For most SaaS companies, the "build vs. buy" dilemma for analytics is a major crossroads. Do you divert resources to reinvent the wheel, or do you focus on perfecting your unique value proposition?
The true magic of white label reporting is how it turns a massive engineering headache into a straightforward integration project. It lets you deliver a feature your customers are clamoring for in a matter of weeks, not quarters, giving you an instant edge over the competition.
Build vs. Buy: A Quick Comparison
Deciding between building an in-house reporting solution and buying a white-label product comes down to a few key trade-offs. It's a classic battle between total control and speed-to-market. Here’s a high-level look at how they stack up.
Factor | Building In-House | Using White Label Reporting |
|---|---|---|
Time to Market | 6-18+ months. A long, unpredictable development cycle. | Weeks. Integrate and deploy in a fraction of the time. |
Initial Cost | Very high. Requires significant upfront engineering investment. | Low. Predictable subscription fees. |
Ongoing Maintenance | High and continuous. Bug fixes, security, and feature updates. | None. The vendor handles all maintenance and upgrades. |
Core Focus | Diluted. Pulls developers away from your main product. | Sharp. Your team stays focused on your core business value. |
Feature Set | Limited. You can only build what you have resources for. | Robust. Access to advanced features from day one. |
Ultimately, building in-house gives you complete control, but at a steep cost in both time and money. For most teams, a white-label solution offers a much faster and more efficient path to delivering the powerful analytics their customers expect.
The Strategic Advantage of Embedded Analytics
When you choose a white label solution, you're making a conscious decision to prioritize speed, expertise, and user experience. You're bringing in a tool built by specialists who live and breathe data visualization, security, and scalability.
This is a key part of a broader strategy called embedded analytics, which is all about weaving data insights directly into your application's user experience. To get the full picture, check out our guide on what is embedded analytics and how it creates a more valuable product.
The benefits of this "buy" decision quickly start to stack up:
Launch Faster: You can roll out sophisticated analytics features in a fraction of the time it would take your team to scope, design, and build them.
Lower Engineering Load: This frees up your best developers to focus on the features that truly set your core product apart from the competition.
Deliver a Better UX: Give your users a polished, reliable, and powerful dashboard experience that looks and feels like it was custom-built for them.
Stay Up-to-Date: You automatically get access to the latest reporting features and security updates from your vendor without lifting a finger.
The bottom line is simple. If your company's expertise is in HR tech, logistics, or e-commerce, does it really make sense to become a part-time analytics company? White label reporting lets you deliver a complete, data-rich experience while you keep your focus squarely on what you do best.
How White Label Reporting Fuels Business Growth
Think of white-label reporting as more than just a technical shortcut. It's a strategic move that turns a standard feature into a powerful engine for business growth. By plugging a ready-made analytics solution into your own product, you can unlock new revenue, boost customer loyalty, and get a serious leg up on the competition—fast.
This approach completely changes the math for SaaS companies. Reporting stops being a development cost and starts being a direct contributor to your bottom line.
Monetize Your Data with Premium Tiers
One of the most immediate ways to see growth is by creating brand-new revenue streams. Many leading SaaS companies do this by offering "Advanced Analytics" or "Enterprise Reporting" as part of their premium subscription plans. It's a classic upsell, and it works.
Your customers are hungry for insights from their own data, and they're often willing to pay for them. By offering sophisticated, self-service dashboards as an upgrade, you can directly increase your Average Revenue Per User (ARPU) and overall Customer Lifetime Value (CLV).
Create an Upsell Path: Keep basic reporting in your standard plan, but reserve the powerful, customizable dashboards for your higher-priced tiers.
Generate New Revenue: This gives customers a clear reason to upgrade as their business grows and their data needs get more complex. You're tying your product's value directly to their success.
Increase Customer Retention and Make Your Product "Sticky"
In a crowded market, keeping customers is everything. White-label reporting makes your product much "stickier" by embedding critical data right into your users' daily workflows. When they rely on your platform for their most important metrics, it becomes much harder for them to even consider leaving.
Your product transforms from just another tool into their single source of truth—an indispensable part of how they make decisions. This deep integration is a fantastic defense against churn. For more on how to measure the effectiveness of reporting and what it can do for your business, check out this ultimate performance reporting guide.
A great reporting feature anticipates your customers' most important questions and answers them proactively. It continuously proves your product's value, turning passive users into your biggest fans.
This isn't just a hunch. We see this pattern of outsourcing for growth across industries. In marketing, for example, agencies that white-label 40% to 60% of their services grow 2.3 times faster and enjoy profit margins roughly 20% higher than agencies that try to do everything themselves.
Get to Market Faster and Focus on Your Core Product
Finally, the biggest benefit is pure speed. Building a powerful, secure, and scalable reporting feature from the ground up is a massive undertaking that can tie up an engineering team for a year or more. A white-label solution can shrink that timeline down to just a few weeks.
This speed gives you an instant competitive advantage, letting you respond to market demands and customer feature requests with incredible agility.
Even better, it frees up your most valuable (and expensive) resource: your developers. Instead of reinventing the analytics wheel, they can focus on what actually sets your product apart—the core innovation that drives your long-term, sustainable growth.
Evaluating Key Features in a Reporting Solution
Choosing the right white-label reporting partner is a big deal. It’s a decision that will ripple through your product for years to come. It's easy to get bogged down in flashy marketing claims, but a smart choice boils down to a handful of critical, non-negotiable features. Think of this as your field guide for cutting through the noise and zeroing in on what actually matters for security, scale, and a user experience that feels completely seamless.
These features aren’t just technical line items on a checklist; they're the bedrock of a reliable and profitable analytics feature. A great solution doesn't just display data—it weaves itself so perfectly into your application that your customers will be convinced you built the whole thing from scratch.
Deep Customization and Theming
The whole point of "white-label" is for the reporting to feel like your product. It should be invisible. The analytics need to feel like a native part of your app, not some clunky module you bolted on as an afterthought. This demands deep customization that goes way beyond just slapping your logo on top.
You need a solution that gives you granular control over the entire user interface (UI). This means being able to tweak every visual element to perfectly match your existing design system. We're talking about:
Colors and Fonts: Complete command over color palettes and typography to keep your branding consistent.
Layout and Components: The agility to change dashboard layouts, hide certain features, and control the entire user workflow.
Chart and Graph Styles: Plenty of options to define the look of your data visualizations so they align with your product's unique aesthetic.
Without this level of control, the embedded analytics will always feel a bit... off. It breaks the user experience and completely undermines the white-label promise. The end goal is a flawless visual and functional blend.
A Rock-Solid Multi-Tenant Architecture
When you’re serving multiple clients from a single platform, data security isn't just a feature—it's everything. A multi-tenant architecture is the technical foundation that guarantees each customer's data is completely walled off and secure from everyone else. It’s like an apartment building: every tenant gets their own locked unit, and there’s no way for a neighbor to wander into their space.
This kind of architecture is non-negotiable for any B2B SaaS company. It ensures that Customer A can never, under any circumstances, get a peek at Customer B's data. When you're looking at different vendors, make sure their solution was built for multi-tenancy from day one. Trying to tack it on later is a recipe for disaster.
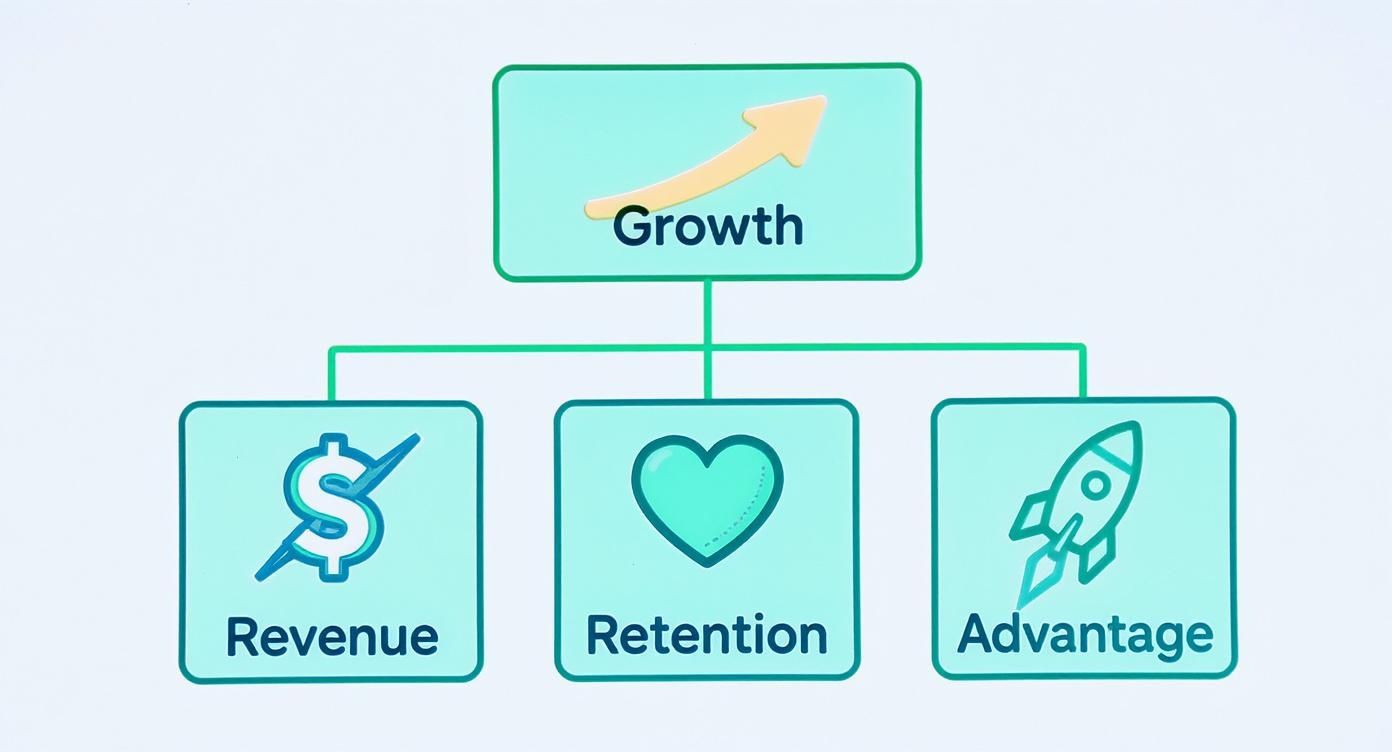
This model shows how a focus on the right features directly fuels growth by boosting revenue, locking in customers, and giving you a real competitive edge.
Granular Data Security and Access Controls
Beyond keeping tenants separate, you also need to control what individual users within the same company can see. This is where features like Row-Level Security (RLS) come into play. RLS lets you create rules that filter data based on things like a user’s role, department, or geographic location.
For instance, a regional sales manager should only see the numbers for their specific territory, not the entire company. RLS enforces these permissions right at the data level, so users only see exactly what they're supposed to. This fine-grained control is absolutely essential for compliance and for building trust with your customers.
Another must-have is painless authentication. Single Sign-On (SSO) lets your users log into your app and access their dashboards without ever having to enter a second password. It’s a frictionless experience that users just expect these days. The best platforms will support common SSO standards like SAML and OpenID Connect right out of the box.
Performance That Scales With You
Finally, your reporting solution has to keep up as you grow. As you add more users and your data volumes explode, performance can't take a nosedive. Slow-loading dashboards and queries that spin forever create a terrible user experience that reflects poorly on your entire product.
A truly scalable white-label reporting solution should handle a surge from 10 users to 10,000 without breaking a sweat. Performance needs to be a core part of its architecture, not an afterthought.
Don't be shy about asking vendors tough questions about their infrastructure, how they handle heavy loads, and their caching strategies. The right platform is engineered from the ground up to deliver lightning-fast insights, no matter how many people are hitting it at once.
To help you organize your evaluation, here’s a checklist of the most critical areas to investigate when comparing potential partners.
Essential Evaluation Checklist for White Label Reporting Solutions
This table breaks down the critical features and capabilities to assess when you're comparing different white-label reporting and embedded analytics platforms.
Feature Category | Key Evaluation Criteria | Why It's Critical |
|---|---|---|
Customization & Theming | Can you control fonts, colors, layouts, and components? Does it support CSS overrides or a theming API? | Ensures the analytics feel like a native part of your application, not a third-party add-on. |
Security & Authentication | Does it have a true multi-tenant architecture? Does it support SSO (SAML, OpenID)? | Protects customer data and provides a seamless, secure login experience for your users. |
Data Access Control | Does it offer Row-Level Security (RLS)? Can you define permissions based on user roles and attributes? | Guarantees users only see the data they are authorized to access, which is crucial for compliance and trust. |
Performance & Scalability | How does it handle large datasets and high user concurrency? What are the query response times? | A slow, laggy experience reflects poorly on your product and frustrates users, hindering adoption. |
Integration & Embedding | How easy is it to embed? Does it offer a robust API and SDKs for your tech stack? | A smooth and well-documented integration process saves significant development time and resources. |
Data Connectivity | Can it connect to all your data sources (databases, APIs, data warehouses)? | You need a platform that works with your existing data infrastructure, not one that forces you to change it. |
Using this checklist will help you make a more informed, data-driven decision. These are just a few of the core capabilities, but to dig even deeper, you can review this list of the 10 essential features of modern business intelligence tools to build out a more exhaustive set of criteria.
A Strategic Roadmap for Implementation
Getting a white-label reporting solution up and running is less about slinging code and more about smart project planning. Think of it as a strategic initiative, the bridge between your product vision and the technical reality. A great implementation adds immediate value for your customers and helps you sidestep common traps like scope creep and technical debt. It's how you turn a good idea into a seamless, profitable feature.
This roadmap isn't a line-by-line coding manual. It’s a high-level playbook for product managers and tech leads, designed to walk you through the essential phases of a successful integration. Following these steps helps ensure a smooth rollout that your customers will actually adopt and that lines up perfectly with your business goals.
Phase 1: Define Your Goals and User Stories
Before anyone touches a keyboard, you have to define what success actually looks like. Start by outlining the specific analytics features your customers are asking for. What questions are they trying to answer with their data? What insights would make your product indispensable to them?
This is where you translate those broad business needs into concrete user stories. For example, a solid user story for an analytics feature might be: "As a marketing manager, I want a daily breakdown of campaign performance so I can shift my budget to the best-performing ads." These stories become your project's north star, guiding every decision from here on out.
Phase 2: Plan Your Data and Technical Architecture
With your goals set, it's time to lay the technical groundwork. This phase is all about making sure your data sources can talk to the white-label solution without a hitch. You'll need to map out your current data architecture and pinpoint exactly what information will fuel the new dashboards.
This is also when you'll choose your frontend integration strategy. There are a few well-trodden paths for embedding analytics, each with its own pros and cons:
Iframes: The quickest and simplest route. They get the job done fast but can feel a bit clunky and offer limited customization.
SDKs (Software Development Kits): These offer a much deeper integration. They give you more control and help you create a truly seamless user experience.
APIs (Application Programming Interfaces): For maximum flexibility and control, APIs are the way to go. This approach lets you build a completely custom front end that pulls data from the reporting engine.
While the frontend team is sorting that out, your backend developers need to tackle secure authentication. They'll set up the protocols to ensure that when a user logs into your app, they are securely and instantly given access to their specific data—and only their data. For a deeper dive into these models, our comprehensive guide offers an embedded analytics overview for product teams.
Phase 3: Test Thoroughly and Roll Out Strategically
Once the integration is built, the final phase is all about quality control and a smart launch. User Acceptance Testing (UAT) is non-negotiable. Get the new feature into the hands of a small group of internal folks and a few trusted power users. Their feedback will help you squash bugs and fix usability quirks before they ever see the light of day.
Don't go for a "big bang" launch. A phased rollout, starting with a small beta group of friendly customers, is always the smarter play. It lowers your risk and lets you gather real-world feedback to polish the feature before releasing it to everyone.
This iterative process leads to a much cleaner launch. By the time you make the white label reporting feature available to all your users, you'll be confident it’s stable, valuable, and ready to make your product stickier than ever.
Use Cases and Calculating Your ROI
The theory behind white-label reporting is great, but its real power comes alive when you see it in action. Let's move from concept to reality and explore how different teams are using customer-facing analytics to solve real problems and drive measurable results. This is where a strategic feature transforms into a core driver of business value.

This jump from stories to spreadsheets is crucial. It’s how you build a rock-solid business case for investing in a white-label solution. Think of it less as adding a feature and more as making a smart financial decision that will absolutely pay for itself.
Real-World Application For a B2B SaaS Company
Let's imagine a SaaS platform that helps e-commerce stores manage their inventory. The platform is solid, but customers are constantly asking for better sales reports. They want to know which products are selling best, spot seasonal trends, and understand their profit margins without the headache of exporting data to a spreadsheet.
By embedding white-label reporting, the company quickly launches a "Pro Analytics Dashboard" in under a month. Suddenly, their customers can log in and see beautiful, interactive charts that answer their most important questions instantly.
The results? Immediate and impactful.
Reduced Churn: Customers now depend on the platform for critical business insights, making it much stickier and harder to leave for a competitor.
Increased Upsells: The new dashboard becomes the star feature of their premium subscription tier, creating a compelling reason for users to upgrade their plan.
Proven Value: The reports are a constant reminder of the product's impact on a customer's bottom line, reinforcing its value every single day.
How Product Teams Validate Their Roadmap
Product teams live and breathe data. Take a product manager for a project management tool—they need to know which features users are actually engaging with. Is anyone using that new Gantt chart feature, or is the Kanban board still the fan favorite?
By integrating usage analytics through a white-label tool, the product team gets a self-service dashboard showing real-time user behavior. This empowers them to make data-driven decisions with confidence. They can kill features that aren't getting traction and double down on the ones that users love. This direct line to user data ends the guesswork and aligns the entire team around a validated product roadmap.
Calculating Your Return on Investment
A compelling business case needs more than just good stories; it needs hard numbers. Calculating the ROI for white-label reporting is how you justify the investment to leadership, framing it in clear financial terms they understand. And it’s not just about new revenue—it’s also about the significant costs you avoid.
The growing adoption of this model just makes good financial sense. The global white-labeling market is poised for massive growth, projected to expand at a 22.00% compound annual growth rate from 2025 to 2033, reaching an estimated USD 75.0 billion. This boom is happening because companies recognize the huge ROI of focusing on their core business while outsourcing specialized functions like analytics. You can discover more insights about the white-labeling market on htfmarketinsights.com.
ROI isn't just a number; it's a story that shows how a smart investment accelerates growth, cuts costs, and frees up your best people to work on what truly matters.
Let’s break down the key variables you'll need for your own ROI calculation.
1. Avoided Developer Costs
Building a reporting engine from scratch is incredibly expensive. You'd need a team of specialized engineers, which could easily run you $500,000+ in first-year salaries alone, not even counting the ongoing maintenance costs.
Calculation: (Number of Engineers x Average Salary) - Annual White Label Subscription Cost = Annual Savings
2. New Revenue from Premium Tiers
If you place your new analytics features behind a premium plan, you can directly measure the new revenue it brings in.
Calculation: (Number of Upgraded Customers x Additional Monthly Fee) x 12 = New Annual Revenue
3. Financial Impact of Higher Retention
Even a small drop in customer churn has a massive financial impact. If your product costs $5,000 per year and you prevent just 10 customers from leaving, that’s $50,000 in saved revenue right there.
Calculation: (Number of Retained Customers x Annual Contract Value) = Revenue Saved from Reduced Churn
When you add these three figures together, you get a clear, compelling picture of the total financial benefit. To take your analysis even further, our guide on measuring the ROI of AI and BI initiatives offers more key metrics to build into your financial model. This data-backed approach transforms your proposal from a simple feature request into a no-brainer strategic decision.
Common Questions About White Label Reporting
Even after you've mapped out a strategy, a few practical questions always pop up before you pull the trigger. Deciding on a white label reporting solution is a big move, so it makes sense to have questions about security, what it takes to implement, and how much it'll really cost. Let's dig into the things founders and product teams ask most often.
We'll give you straight, clear answers to help you see around corners and make a choice you feel good about. Think of this as the final gut-check to make sure you're ready to move forward.
How Secure Is My Customer Data?
This is usually the first question out of everyone's mouth, and for good reason. Any white-label solution worth its salt is built with security at its very core. They use what’s called a multi-tenant architecture, which is a fancy way of saying each of your clients' data is locked away in its own isolated, secure container. There's zero chance of data spilling over from one account to another.
The top platforms also meet tough compliance standards like SOC 2 and GDPR. If you need really tight control, look for features like Row-Level Security (RLS). This lets you create very specific access rules for every single user. As a final step, always comb through a vendor’s security docs and data policies before you sign anything.
Is White Label Reporting the Same as Embedded Analytics?
They're cousins, but not twins. Embedded analytics is the bigger umbrella term for adding any kind of data feature into your own application. White-label reporting is a specific flavor of embedded analytics, one that’s all about making the reporting tool look and feel like it was built by you.
The real difference is the deep, seamless rebranding. A true white-label solution lets you customize everything—colors, fonts, logos—to perfectly match your product's design. Your customers will see it as just another one of your amazing native features.
How Much Developer Time Does This Actually Take?
Going with a white-label tool is worlds faster than building from scratch, but let's be real—it still needs some engineering time. Your dev team will have to tackle the initial setup, which means hooking up your data sources and embedding the front-end pieces into your application.
The good news is that the best platforms make this as painless as possible with solid SDKs, well-written API docs, and a support team that actually answers the phone. After that initial integration is done, the day-to-day work of creating and tweaking reports can usually be handed off to your non-technical folks, no code required.
Ready to deliver powerful, customer-facing analytics without the engineering headache? With Querio, you can embed stunning, AI-powered dashboards directly into your application in weeks, not years. Give your customers the insights they crave and create new revenue streams. Learn more about Querio's embedded analytics solution.

