What Is Embedded Analytics and How Does It Transform Data Into Action
Curious what is embedded analytics? This guide breaks down how it works, why it matters, and provides real-world examples to show its impact on business.
https://www.youtube.com/watch?v=aLcnUd93gf4
published
Outrank AI
what is embedded analytics, embedded analytics, data integration, SaaS analytics, Querio SDK
0659e9f0-25bc-40d1-9599-34ca757437d6

Embedded analytics is all about bringing reports, dashboards, and data visualizations directly into the applications you already use every day. Instead of toggling over to a separate program to crunch numbers, you get crucial insights right where you work. This makes data-driven decisions feel less like a chore and more like a natural part of your workflow.
A Clearer Look at Embedded Analytics

Here’s a simple analogy: think about the dashboard in your car. It shows your speed, fuel level, and navigation directions without making you pull over to check a paper map or a separate manual. All the information you need is right there, in context, letting you react instantly—whether that means slowing down or finding the next exit.
Embedded analytics does the exact same thing for your business software.
This seamless integration keeps users focused and in their flow, cutting out the clumsy steps of exporting data or logging into a standalone Business Intelligence (BI) platform. Not only does this save a ton of time, but it also gets people to actually use—and value—the software more. In-context data is the fuel for better choices, which is a core concept in mastering data-driven decision making for any product team.
Embedded Analytics vs. Traditional BI
The biggest difference between the two really boils down to where and how you interact with your data. Traditional BI is a destination you have to travel to. Embedded analytics brings the insights directly to you, right inside the app you're already using.
Let's break down the key distinctions.
Embedded Analytics vs Traditional BI at a Glance
Feature | Embedded Analytics | Traditional BI |
|---|---|---|
User Experience | Seamlessly integrated into an existing application workflow. | A separate, standalone application requiring users to switch contexts. |
Accessibility | Data insights are available in the context of a task. | Users must leave their primary application to find and analyze data. |
Primary Goal | To inform and drive immediate action within the workflow. | To support deep analysis and exploration outside of daily tasks. |
Audience | Typically non-technical business users, customers, or partners. | Primarily data analysts, BI specialists, and power users. |
As you can see, they serve very different purposes. It's no surprise that the global embedded analytics market was valued at USD 69.60 billion and is projected to explode to USD 182.72 billion by 2033. That’s a compound annual growth rate of 12.82%, which really underscores the massive shift toward making data more accessible for everyone, not just the data experts.
The fundamental purpose of embedded analytics is to reduce friction. By placing data insights directly at the point of decision, it transforms analytics from a separate, complex task into an intuitive part of the user experience.
Ultimately, this modern approach empowers people to answer their own questions without needing special training or having to leave the tools they already rely on.
For a deeper dive into this topic, check out our complete embedded analytics overview and implementation guide.
Why Embedded Analytics Is a True Game Changer
It's one thing to define embedded analytics, but the real story is the impact it has. When you bring data insights directly into the tools people already use, you're not just adding a nice feature—you're fundamentally changing how they work and make decisions. We're seeing a massive shift from passively looking at data to actively engaging with it right where the work gets done.
Think about a sales rep living in their CRM all day. Instead of toggling over to a separate BI tool and running reports, they see their pipeline performance, conversion rates, and lead scoring right on their main dashboard. This immediate feedback loop means they can pivot their strategy in real-time and focus on the most promising leads without breaking their flow.
That's the magic of embedded analytics: it turns data from a destination into a companion. Your application stops being a simple system of record and becomes a dynamic guide, steering users toward smarter actions.
Driving User Adoption and Retention
When your software delivers clear, immediate value, it becomes an essential part of a user's daily routine. Embedded analytics makes an application "stickier" because it becomes indispensable. Users stop seeing your product as just a place to enter information and start seeing it as a source of truth that helps them do their jobs better.
This boost in value has a direct line to user retention. When analytics are woven into the very fabric of an application, leaving for a competitor means losing a critical decision-making tool. You've effectively built a strong competitive moat around your product, which naturally fosters long-term loyalty.
By putting insights at the point of action, embedded analytics empowers users to answer their own questions instantly. This self-service capability reduces reliance on data teams and accelerates the entire decision-making process for the organization.
Unlocking New Revenue Streams
For SaaS companies, embedded analytics is more than just a feature—it's a massive business opportunity. By offering advanced analytical capabilities, you can create premium subscription tiers or sell powerful add-on modules, opening up entirely new, high-margin revenue streams.
Let's be honest, customers are happy to pay more for tools that deliver a clear, measurable return on their investment. Embedded analytics does exactly that, helping them find new efficiencies, spot important trends, and optimize their own operations.
The data backs this up. User preference is overwhelmingly clear, with 81% of analytics users choosing embedded tools over standalone BI platforms.
The entire market is sprinting in this direction. By 2025, it's estimated that 75% of customer-facing applications will feature embedded analytics. This isn't just for show—it can drive up to 30% higher revenue and a 41% increase in user adoption rates. You can dive deeper into these embedded analytics trends and their market impact to see for yourself. It’s clear that embedding insights is no longer an optional extra; it's a core part of any modern, competitive software.
See Embedded Analytics in Action with Real Examples
Theory is one thing, but seeing how embedded analytics solves real-world problems is where its power truly clicks. When you see these tools in action, inside the apps people use every day, their value becomes crystal clear. From finance to healthcare, companies are weaving data directly into user workflows to help people make smarter, faster decisions.
Let's step away from the abstract and look at a few concrete scenarios. Each one shows how embedding insights right where they're needed creates a more valuable and intuitive experience.
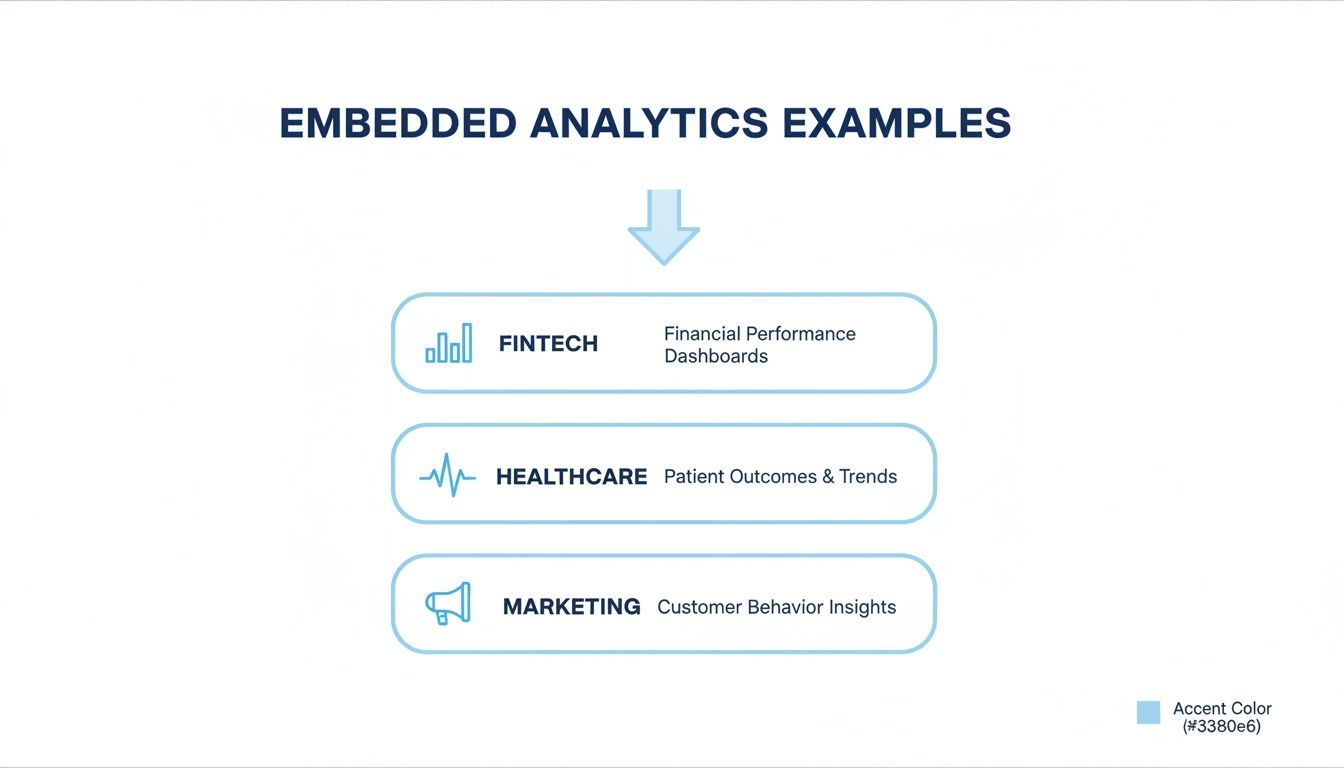
Empowering Personal Finance Management
Think about your favorite budgeting app. In a basic version, you'd probably just see a long list of transactions. That's useful, sure, but it only gives you a piece of the puzzle.
Now, imagine that same transaction screen with an interactive chart embedded right at the top. This chart could instantly categorize your spending—groceries, entertainment, bills—without you ever having to leave the page.
Real-time Budget Tracking: A simple donut chart shows where your money is going, updating with every new purchase.
Trend Analysis: A line graph visualizes your spending habits over the last three months, helping you spot patterns at a glance.
Goal Monitoring: A progress bar tracks how close you are to hitting your monthly savings goal, giving you that little nudge of motivation.
By embedding these analytics, the app shifts from being a simple digital ledger to a powerful financial co-pilot. You can instantly connect your daily spending to your long-term goals, making it far easier to make good decisions on the fly.
Enhancing Patient Care in Healthcare
In the high-stakes world of healthcare, getting the right data quickly can make all the difference. Picture a doctor using an electronic health record (EHR) platform to review a patient's history. Instead of having to click through separate tabs for lab results, clinical notes, and historical data, embedded analytics puts the most critical insights front and center.
When the doctor pulls up a patient’s file, they're greeted with a dashboard integrated directly into the main view.
This dashboard visualizes the patient's treatment response over time, tracks key vital signs against their baseline, and flags any worrying trends that need immediate attention. This allows the doctor to make clinical adjustments right there during the appointment, not hours later after piecing together separate reports.
Optimizing Campaigns for Marketing Teams
Marketing SaaS platforms are another perfect fit for embedded analytics. Imagine a campaign manager logging in to check on a recent ad spend. Instead of the old routine—exporting data to a spreadsheet for analysis—they see a comprehensive ROI dashboard built right into the campaign management screen.
This integrated view immediately shows them:
Cost Per Acquisition (CPA): Exactly what it's costing to bring in each new customer.
Conversion Rates: Which specific ads or channels are actually turning clicks into sales.
Customer Lifetime Value (CLV): The projected long-term value of customers brought in by this specific campaign.
This immediate feedback loop lets the marketer shift their budget to the best-performing ads in real-time, squeezing more value out of their campaign without all the context switching. To see how real companies are pulling this off, you can explore various embedded analytics case studies that break down actual implementations.
How Does the Technology Behind Embedded Analytics Work?
To really get what embedded analytics is all about, it helps to peek under the hood at the architecture. Don't worry, we'll skip the super technical jargon. Let's think of it like a professional restaurant kitchen. In this analogy, your app is the restaurant itself, and the analytics are the incredible meals being served to your customers.
The entire process unfolds in four key stages, much like a chef prepares a gourmet dish. Each step is essential for turning raw information into a valuable insight served right inside your application.
The Four Core Components
The journey from a messy pile of raw data to a clean, interactive chart on a user's screen is a surprisingly well-coordinated dance.
Data Sources (The Ingredients): This is where everything starts. Your data sources are the raw ingredients for any analysis—they could be databases, APIs, or massive data warehouses. Just like a chef sources fresh produce, your analytics system needs to pull information from these places.
Processing Layer (The Prep Station): Raw ingredients aren’t ready for the pan. They need to be washed, chopped, and organized. In the same way, raw data needs to be cleaned up, transformed, and structured. This is the prep work that ensures the data is accurate and ready for the main event.
Analytics Engine (The Chef): Here's the heart of the operation. This is the master chef who takes all those prepped ingredients and works their magic. The analytics engine is what runs the queries, crunches the numbers, and aggregates the data to find the actual insights. It's the brains behind the brawn, answering the complex questions users have.
Visualization Layer (The Plating): Finally, the perfectly cooked meal is plated to look amazing for the customer. The visualization layer takes the insights from the analytics engine and presents them as easy-to-digest charts, graphs, and dashboards. This is what your users actually see and interact with inside your app.
This diagram shows how different industries put these components to work in the real world.
As you can see, the applications vary widely, but the mission is always the same: deliver targeted, in-context insights that help people make better decisions on the spot.
The Implementation Path: Build vs. Buy
When it's time to set up this "kitchen," you'll face the classic "build vs. buy" decision. Building your own analytics solution from the ground up gives you total control, but it's a massive undertaking. It costs a lot of time and money, requires a specialized team, and saddles you with maintenance forever.
Buying a solution, like a pre-built Software Development Kit (SDK), is like leasing a fully equipped, professionally staffed kitchen. You get to start serving amazing dishes on day one. It drastically cuts down development time, minimizes technical debt, and often gives you access to advanced features you couldn't build yourself.
Using an SDK frees up your developers to focus on what they do best: improving your core product. They don't have to waste time reinventing the analytics wheel. Some of the coolest new approaches even use natural language processing, allowing users to just ask questions in plain English to get the data they need.
You can dive deeper into how embedded analytics leverages NLP for text-to-SQL queries to make data accessible to everyone, not just data scientists.
A Practical Guide to Implementing Embedded Analytics
Knowing what embedded analytics is and actually bringing it to life for your users are two different things. Getting from a raw database to a polished, interactive dashboard inside your app can feel like a huge undertaking, but modern tools like a Software Development Kit (SDK) make it surprisingly manageable.
Think of an SDK as a set of pre-built, powerful components. Instead of constructing an entire analytics engine from the ground up, you're essentially given the foundational blocks, turning a complex project into a much more straightforward process. This is great news, especially for teams that don't have a small army of data engineers on standby.
One of the biggest wins here is the massive reduction in development time. A custom analytics solution can easily suck up months, if not years, of engineering effort. With an SDK, you can get a functional proof-of-concept running in a matter of days. That frees up your team to keep their eyes on the prize: improving your core product.
The Developer Journey with an SDK
When you use an SDK, the path from idea to implementation is pretty clear. Developers can tackle it one logical step at a time, building and integrating analytical features without reinventing the wheel.
Connect Your Data Source: First things first, you need to securely link your database or data warehouse to the analytics platform. Good SDKs offer simple, read-only connectors that make this feel more like a quick configuration task than a heavy engineering lift.
Build Your Visualizations: Next, you get to the fun part. Using a visual, often no-code interface, developers or product managers can start crafting the charts, graphs, and dashboards your users will interact with. This is where you decide which metrics tell the most compelling story.
Embed with a Few Lines of Code: Once your dashboards are built and ready to go, the SDK hands you a few lines of code. You just drop these snippets directly into your app's user interface, and that's it—the analytics are live.
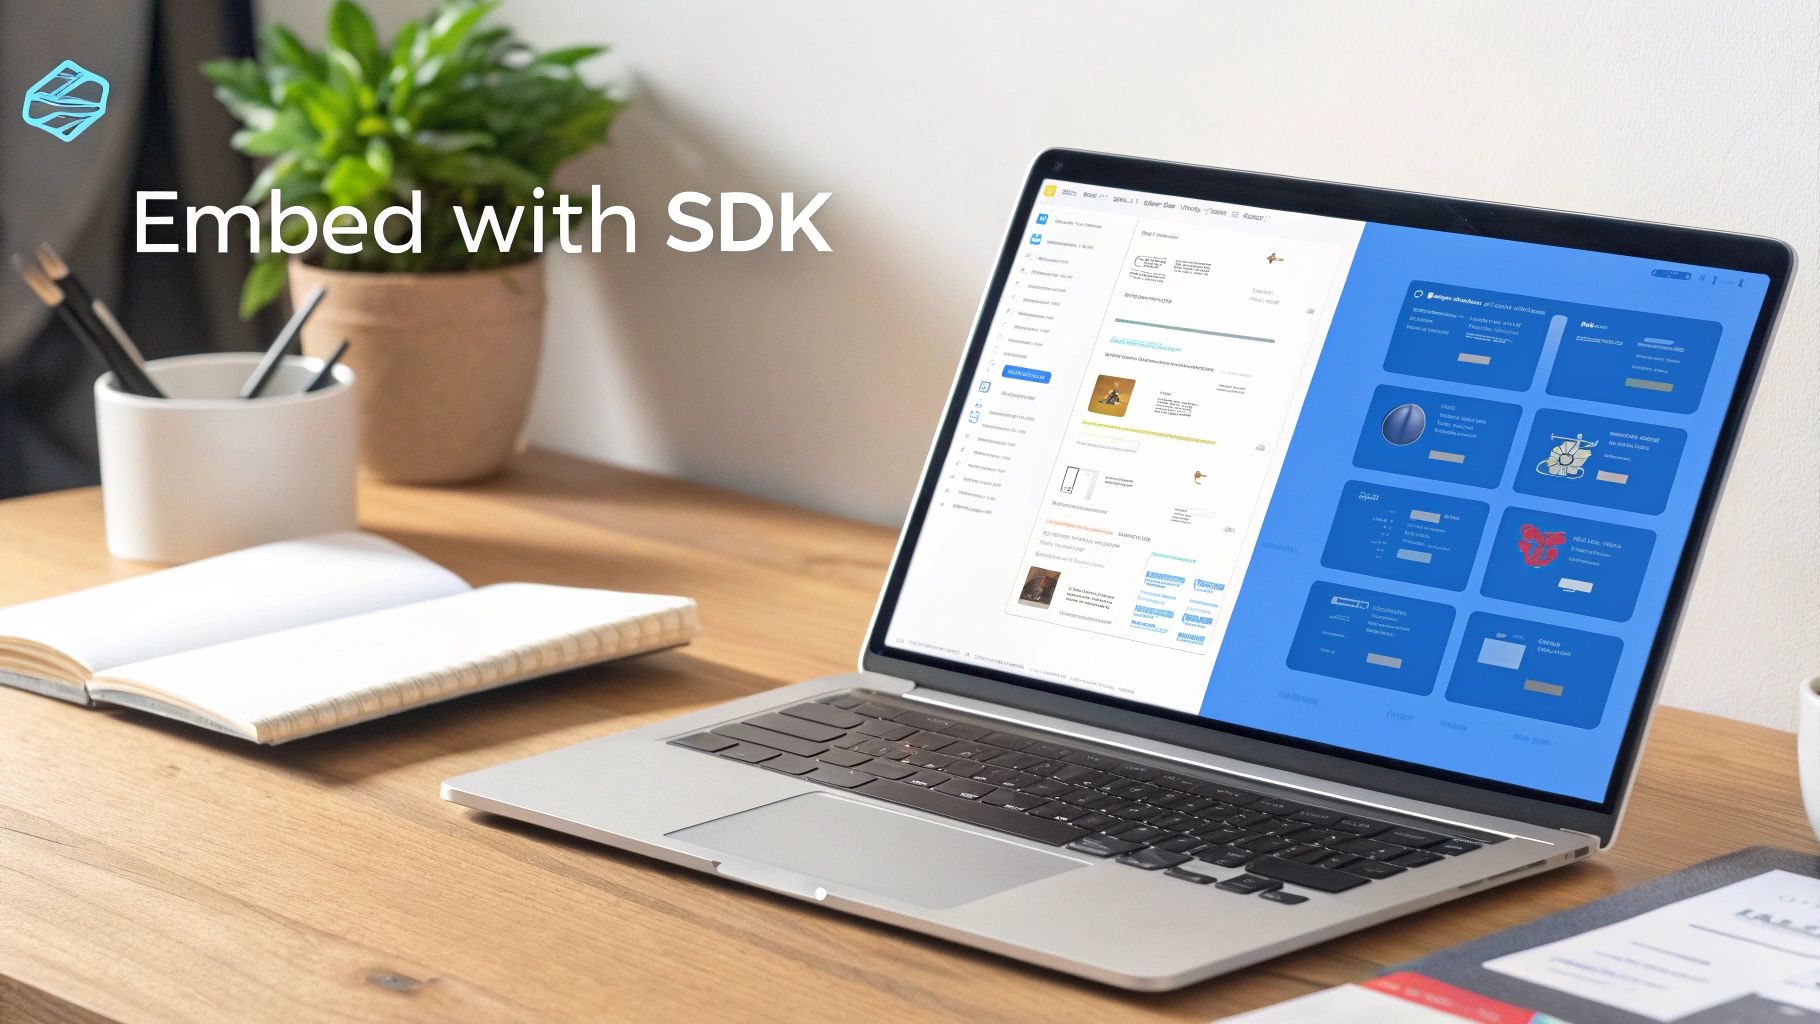
The Querio workspace, for instance, gives you a central hub to manage data sources and build the dashboards you plan to embed.
As you can see, it's a clean, organized environment designed to make analytics a natural part of the development workflow, not some siloed, overly complicated side project.
Advantages of an SDK Approach
Choosing an SDK over a fully custom build isn't just about moving faster. The long-term benefits are what really make the difference.
The biggest advantage? A dramatic reduction in ongoing maintenance. Instead of constantly patching, updating, and securing a homegrown analytics system, you're offloading that entire headache to a dedicated provider. Your analytics layer stays secure, fast, and up-to-date without you lifting a finger.
Ultimately, this strategy puts sophisticated analytics within reach for a much wider range of companies. It effectively packages immense complexity into a developer-friendly solution. You can deliver enterprise-grade analytics—with all the bells and whistles like multi-tenant security and custom theming—without needing an enterprise-sized budget or team. This turns a potential technical nightmare into a real competitive edge.
How to Choose the Right Embedded Analytics Solution
Picking the right embedded analytics solution is a huge decision. It’s not just about adding a few charts; it’s about shaping your product's future and your team’s workload for years to come. Instead of getting lost in a sea of features, it’s better to zero in on what truly matters for your business, your tech stack, and where you see yourself down the road.
First things first, think about customization and the user experience. How tightly do you need the analytics to fit into your app? For an internal dashboard, a simple integration might be fine. But if you’re building a customer-facing SaaS product, that experience has to be absolutely seamless. You need a white-label solution that feels like a natural part of your application, not a clunky, bolted-on module.
Next up is scalability and the real cost of ownership. A tool that handles 100 users with ease might completely fall apart when 10,000 users are hitting it at once. You should be looking for a cloud-native architecture that can grow with you. Also, be wary of pricing models tied to individual user licenses—they can get incredibly expensive as your customer base expands.
Key Evaluation Criteria
Let's be clear: security and compliance are table stakes. They aren't "nice-to-haves." The solution you choose must handle critical security protocols like multi-tenancy, row-level security, and single sign-on (SSO) without breaking a sweat. A major plus is the ability to deploy the entire thing inside your own cloud environment. That way, your customers' data never has to leave your control.
Choosing an embedded analytics solution is about more than just technology—it's about finding a strategic partner. Your goal is to find a platform that empowers your team to deliver value quickly while minimizing long-term technical debt and maintenance headaches.
For a much deeper dive into the questions you should be asking potential vendors, check out our comprehensive buyer's guide for embedded analytics vendors.
To get your evaluation process started, it helps to have a structured way to think about your options. Whether you're considering building in-house or buying a solution, asking the right questions is critical.
Evaluation Criteria for Embedded Analytics Solutions
Consideration | Key Questions to Ask |
|---|---|
User Experience | Can we fully white-label the UI to match our brand? Does it support a seamless user experience without iFrames? |
Scalability & Cost | Is the architecture built for growth? Does the pricing model scale predictably without punishing user adoption? |
Security & Compliance | Does it support multi-tenancy and row-level security? Can we deploy it within our own cloud environment? |
Developer Friendliness | Does it offer a robust API and SDK for deep integration? How quickly can our team get a proof-of-concept running? |
Ultimately, this checklist isn't just about ticking boxes. It’s a framework to help you find a solution that not only meets your technical requirements but also aligns perfectly with your business goals.
Common Questions We Hear About Embedded Analytics
Even after grasping the core concepts, a few questions always seem to come up when teams start seriously considering embedded analytics. Let's break down some of the most common ones we hear.
How Is This Different From a BI Dashboard?
This is probably the most frequent question. People want to know what makes embedded analytics different from the Tableau or Power BI dashboards they're already used to.
The biggest difference boils down to context. A traditional BI dashboard is a separate destination. You have to stop what you’re doing, open another tab or application, and then start digging for insights. Embedded analytics, on the other hand, brings the data directly into your existing workflow. The insights are right there, inside the app you're already using, helping you make a decision in that very moment.
Think of it this way: BI makes you go to the data. Embedded analytics brings the data to you.
Is This Just for SaaS Companies?
It's easy to see why SaaS products are a perfect fit for embedded analytics, but the answer here is a firm no. It's not just for them. Honestly, any application where data can help users make smarter, faster decisions is a great candidate.
We've seen it work wonders in all sorts of places:
Internal tools built for finance or operations teams to track performance without switching screens.
Customer portals in banking or e-commerce, showing users their spending habits or order history.
Specialized software for industries like healthcare, where doctors can see patient data right within the management system.
How Long Does It Take to Implement?
The timeline really depends on the path you choose. If you decide to build a custom analytics solution from the ground up, you're looking at a serious commitment. It can easily take a team of engineers many months, sometimes even years, to get it right.
That’s where using a pre-built Software Development Kit (SDK) completely changes the equation. An SDK-based approach cuts that timeline down from months or years to just a matter of weeks, or even days for a basic setup. You get to deliver value to your users incredibly fast and keep your own developers focused on what they do best: building your core product.
Ready to bring powerful, in-context insights to your users in days, not months? With Querio, you can embed white-label dashboards, charts, and an "Ask your data" bar right into your application. Learn more about our developer-friendly SDK.

