Cost of Tableau Desktop: A 2026 Pricing Guide
Get a clear breakdown of the 2026 cost of Tableau Desktop. We analyze license tiers, TCO, hidden fees, and how to optimize your BI spend.
https://www.youtube.com/watch?v=V2ylzJiwgCA
published
Outrank AI
cost of tableau desktop, tableau pricing, tableau license cost, bi tools cost, tableau creator cost
3413ab08-00e1-4cf9-8271-744701b33a7d

Tableau Creator, which includes Tableau Desktop, costs $75 per user per month, or $900 per user annually on the Standard Edition when billed annually. If you need the Enterprise Edition, it rises to $115 per user per month, or $1,380 annually per user.
That sounds straightforward until you're the founder approving the invoice and realizing the license is only the visible line item. The full cost of Tableau Desktop usually shows up later, in analyst time spent cleaning data, infrastructure decisions that drag in engineering, and the operational overhead that turns a reporting tool into a small platform your team now has to run.
If you're a startup or mid-market company, that's the part that hurts. Enterprise software often looks manageable at the seat level and expensive at the workflow level. Tableau is a classic example. It can be a strong visualization product, but the cost of tableau desktop isn't just what procurement sees on day one. It's what your data team has to support for the next year after the purchase.
Table of Contents
Understanding the Real Cost of Tableau Desktop
A founder approves a few Tableau seats for the data team and expects a clean software expense. Six months later, the budget includes analyst time spent fixing extracts, engineering time spent reshaping source data, and admin work to keep permissions and dashboard performance under control. That is the cost pattern that catches mid-market teams.
The direct price is easy to find. Tableau Desktop now comes through the Creator license, with pricing outlined in Noomaro's Tableau pricing breakdown. The harder question is what it takes to make that license useful once more people depend on it.
For startups and scaling companies, Tableau is rarely just a BI purchase. It becomes an operating model. Someone has to prepare data before it reaches dashboards. Someone has to define business logic so revenue, pipeline, retention, and margin do not mean different things in different workbooks. Someone has to own access, refreshes, performance, and trust.
That is why I do not evaluate Tableau on seat price alone. I look at total cost of ownership. The bill includes the software, but also the labor and infrastructure required to keep reporting reliable enough for leadership, finance, and go-to-market teams to use in decisions.
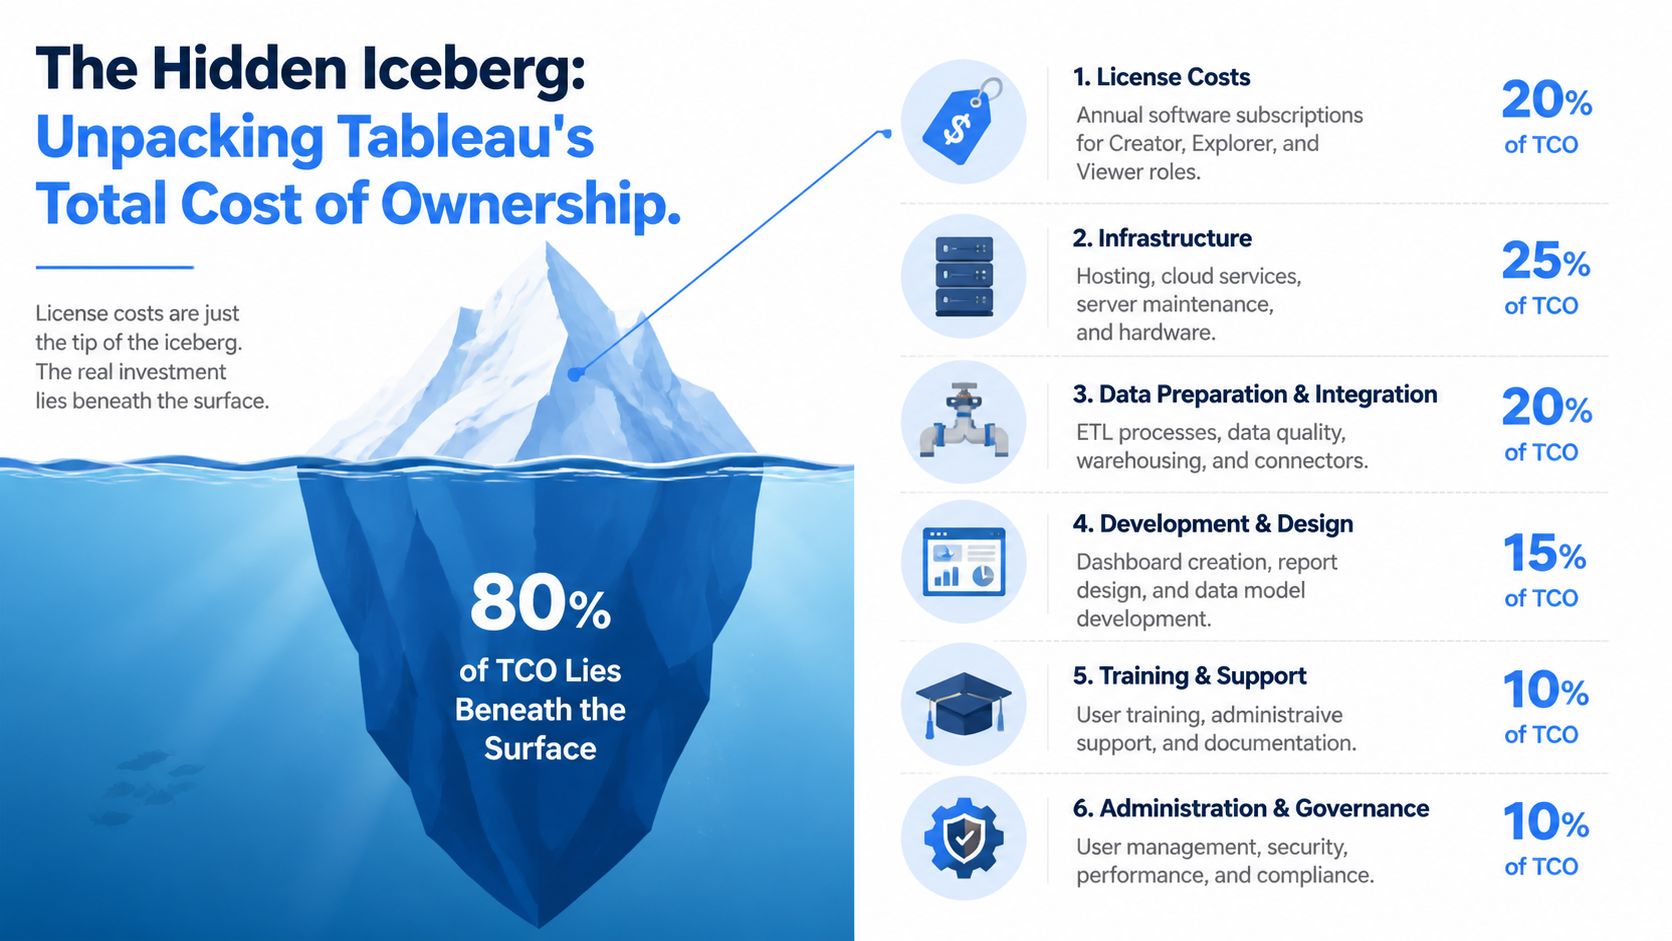
A practical way to view Tableau cost is through three layers:
License cost: the paid seats for people creating, exploring, and viewing content
Operating cost: the hosting, administration, support, and governance work around the platform
Data cost: the engineering and analytics effort required to clean inputs, model metrics, and maintain consistent answers over time
The sticker price sits in the first layer. Fast-growing teams usually feel the pressure in the second and third.
This is also the point where many buyers compare Tableau with newer tools built for leaner data teams. A Tableau alternative for modern startup data teams can reduce the amount of engineering support required to answer routine business questions, which changes the economics more than a small seat discount ever will.
The primary unit of cost is not the dashboard. It is the team required to support the dashboard once the business starts relying on it every day.
Deconstructing Tableau's 2026 Licensing Model
Why Tableau Desktop is really a Creator purchase
A founder usually starts with a simple question. "What does Tableau Desktop cost for one analyst?"
That framing is already off. Tableau Desktop is no longer a standalone buying decision. It sits inside the Creator license, so the core purchase is access to Tableau's authoring and publishing layer, not a single desktop app.
As noted earlier, Tableau's current packaging puts Desktop inside a broader subscription model with Standard and Enterprise tiers. The practical implication is more important than the sticker price. Once someone has a Creator seat, they are expected to connect data, build content, publish it, and support how the rest of the company consumes it.
That changes the budget conversation. A startup may think it is buying one power user license. In practice, it is buying the first piece of an operating model that needs governance, curated data, and ongoing admin work to function well.
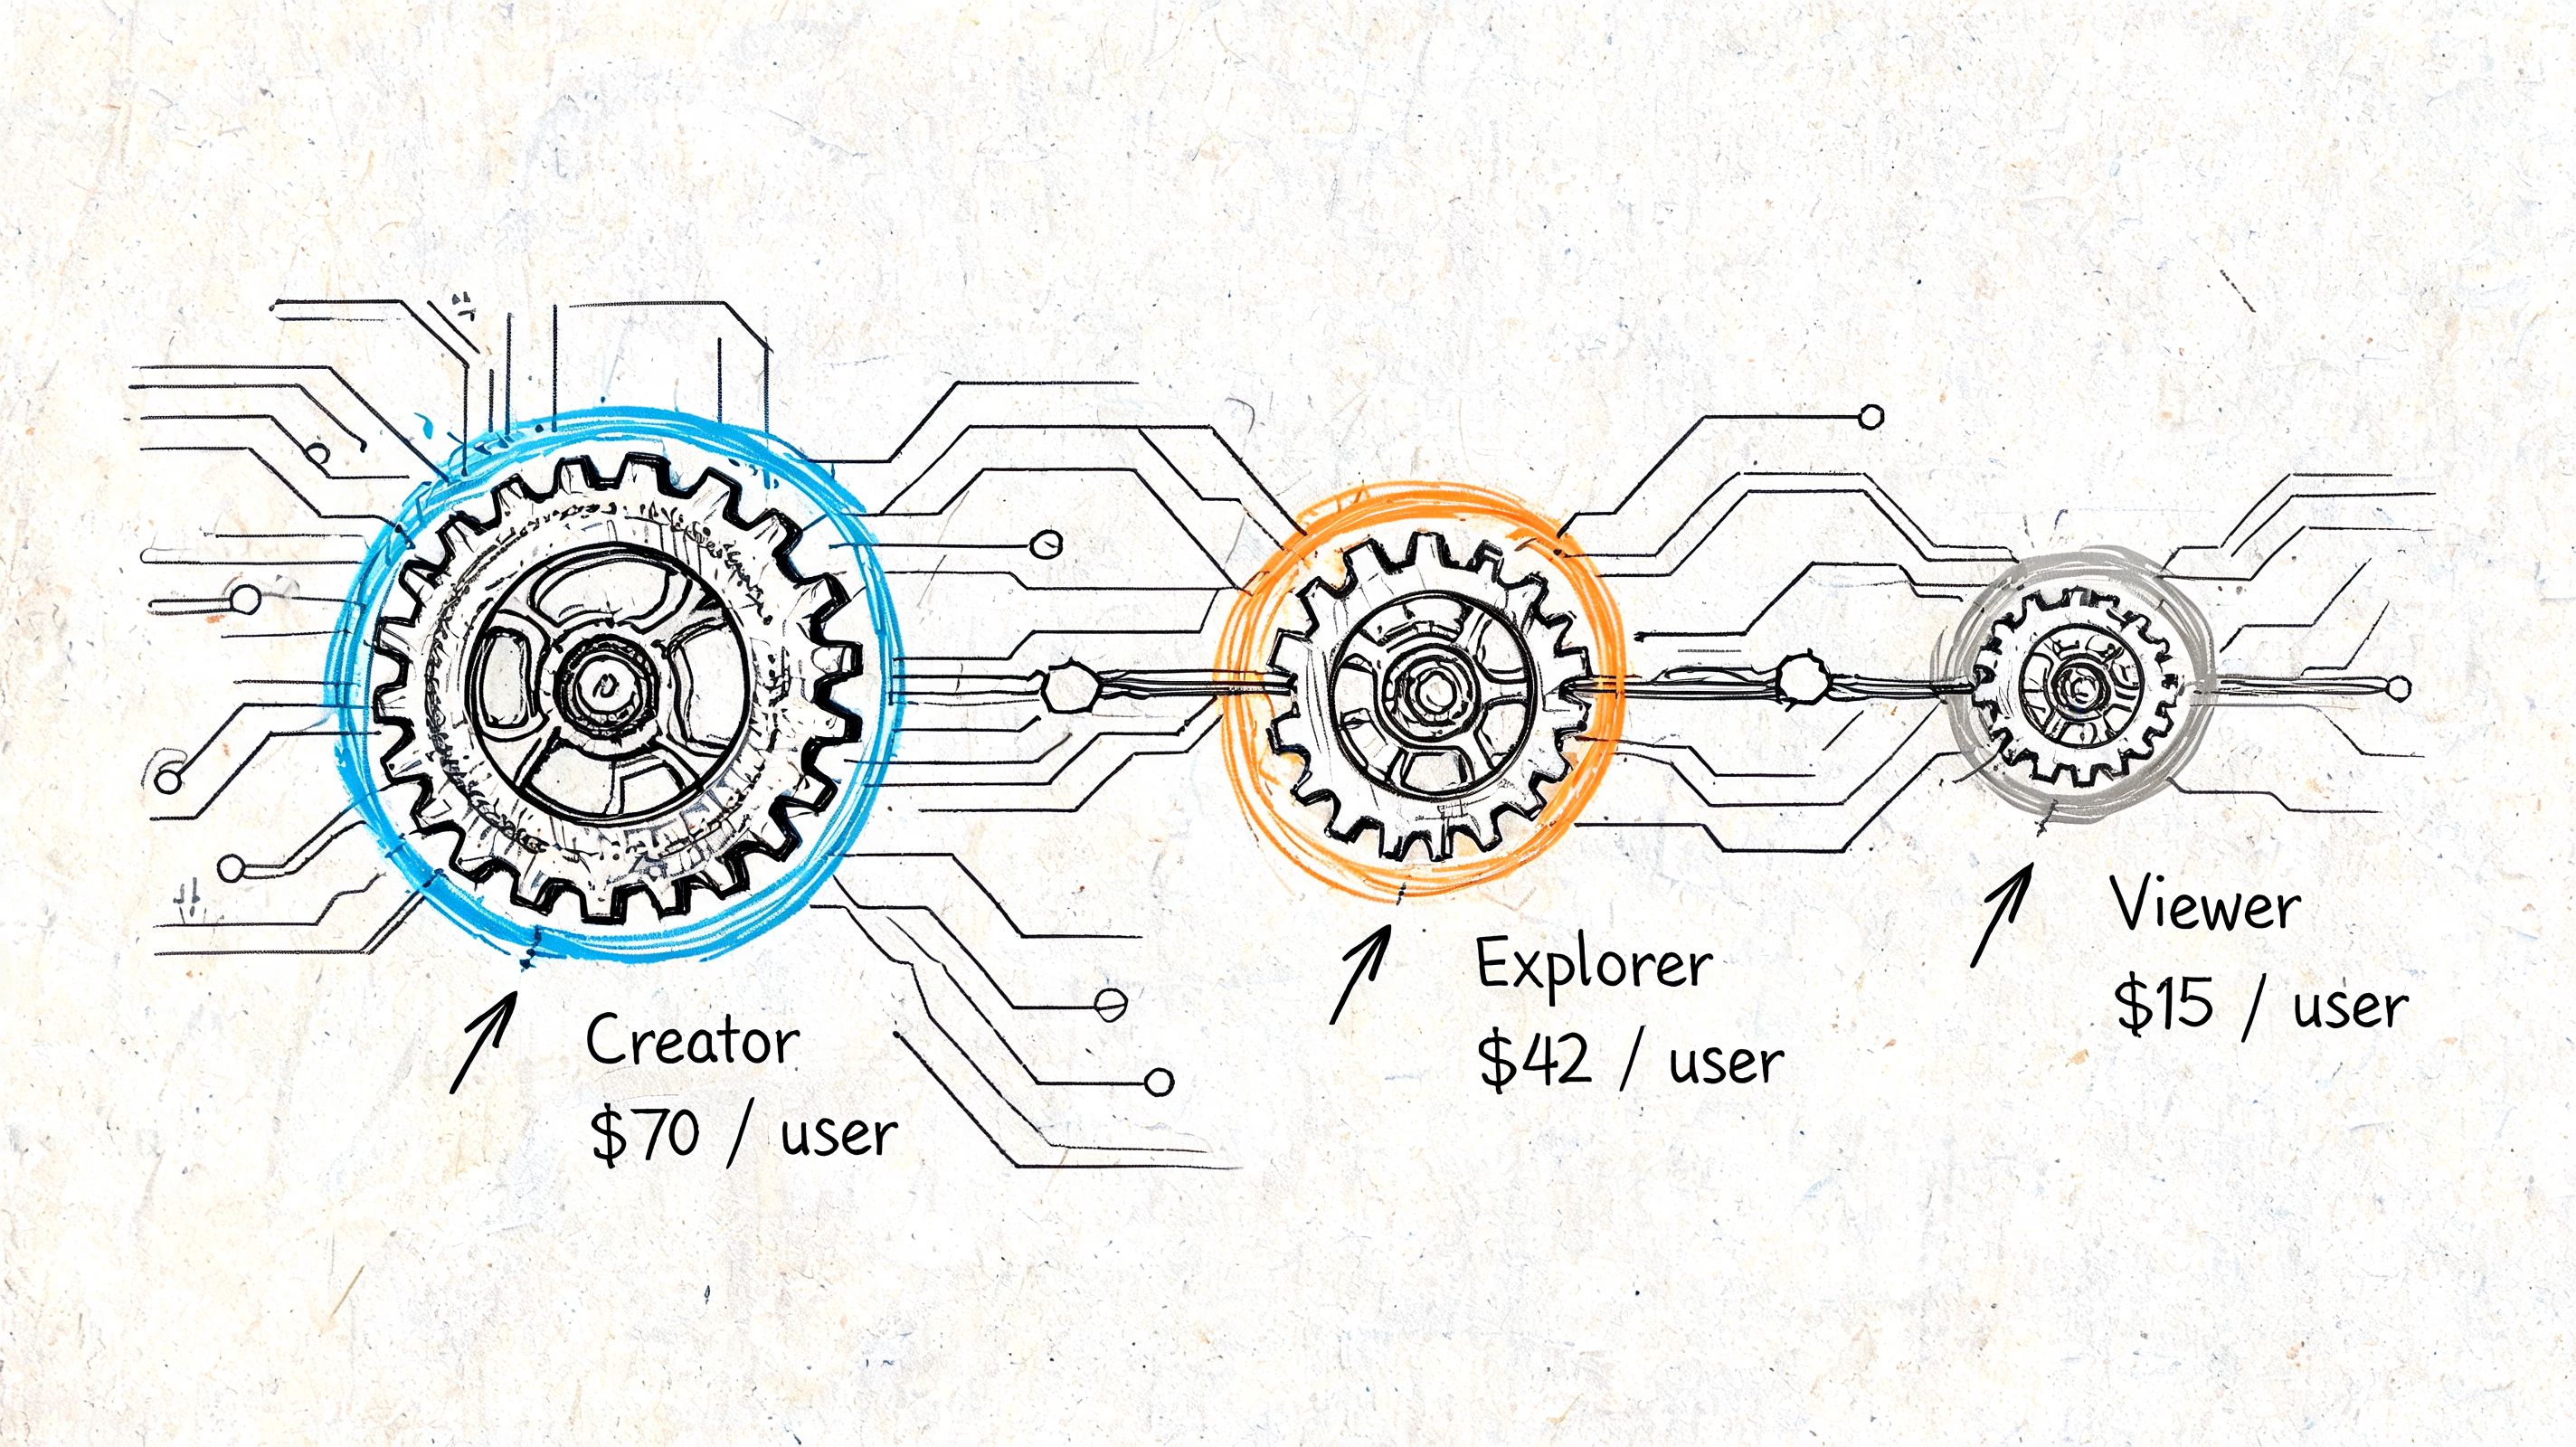
The three roles and what they mean in practice
Tableau's license structure has three roles, and each one maps to a different level of dependency on your data team.
Creators build from raw or semi-prepared data, create dashboards, and publish assets for the business.
Explorers work from published sources, modify existing views, and answer follow-up questions inside defined guardrails.
Viewers consume dashboards and reports with limited ability to change the underlying analysis.
The model is logical on paper. Mid-market and startup teams run into trouble when real jobs do not stay inside those boundaries.
A product lead may need to inspect feature adoption by segment in the morning, tweak a funnel cut for a board slide at lunch, and ask for a new metric definition by the afternoon. That person is not a clean fit for a low-interaction viewer role. The same is true for RevOps, finance, and customer success leaders. They often need enough flexibility to work with data directly, but not enough time or training to behave like full BI developers.
That is where license creep starts. Teams buy lower-cost seats, hit the limits, then upgrade users so work keeps moving. If you want a side-by-side view of how that trade-off compares with a modern alternative to Tableau for startup data teams, it helps to look beyond seat labels and focus on how many people need technical support to get answers.
Why this model matters for startups
The hard part is not understanding the pricing page. The hard part is fitting a fast-moving company into role-based analytics workflows without creating bottlenecks.
Early-stage and mid-market teams usually share responsibilities across a small group. The analyst writes SQL, the ops lead cleans spreadsheet inputs, the founder wants one-off board metrics, and department heads need to explore data without waiting in a queue. Tableau's licensing model assumes cleaner handoffs than most startups possess.
That mismatch creates two costs.
First, teams overspend on higher-tier access because people need more freedom than their original role allows. Second, the company ends up relying on analysts or data engineers to prepare sources, maintain permissions, and answer the questions that lower-tier users still cannot answer on their own.
That is why the cost of Tableau Desktop is rarely the Desktop line item. The larger expense is the team you need behind it so the license model does not slow the business down.
Calculating the True Total Cost of Ownership
The budget line for Tableau is smaller than the operating cost around it
A founder approves Tableau because the seat math looks manageable. Six months later, the actual spend shows up somewhere else. Analyst hours disappear into data cleanup. Engineering gets pulled into connector issues and warehouse modeling. Someone on the team becomes the unofficial Tableau admin because dashboards now run part of the business.
That is the gap between sticker price and total cost of ownership.
Earlier pricing references already showed the pattern. License fees are only one layer of the budget. Once Tableau becomes a system people rely on for weekly reporting, board packs, pipeline reviews, and finance checks, the company also pays for setup, maintenance, training, governance, and the labor required to keep inputs clean and outputs trusted.
For mid-market teams, the biggest hidden cost is usually labor.
Data prep and support work drive the real bill
Traditional BI tools often assume the data arriving at the dashboard layer is already modeled, joined, tested, and ready for use. Startup teams rarely have that luxury. The warehouse changes fast. Source systems are inconsistent. Business logic lives partly in SQL, partly in spreadsheets, and partly in one analyst's head.
That operating model creates recurring work:
analysts cleaning and reshaping source data before every major review
engineers maintaining pipelines and fixing broken refreshes
admins managing permissions, extracts, schedules, and content sprawl
senior data staff answering questions the tool did not fully remove
The cost of Tableau Desktop rises fast when each new dashboard needs support from three different functions.
Mammoth's Tableau pricing analysis makes the broader point clearly. A large share of analytics time is often spent on preparation before anyone gets to analysis. That matches what I see in real teams. If a BI tool depends on repeated manual prep, your company is not just buying software. It is funding an ongoing service operation around that software.
If analysts spend their week making dashboards possible, that labor belongs in the Tableau budget.
This matters more for startups than for large enterprises. A company with a lean data team feels every hour spent on maintenance. One analytics engineer pulled into BI support is one less person improving the warehouse, shipping better models, or helping product and finance answer higher-value questions.
A practical TCO model for a 20-person team
A useful Tableau budget should reflect how the tool runs inside the company. Seat count is one input. Team dependency is the other.
Cost Category | What to estimate | Estimated Annual Cost |
|---|---|---|
Creator licenses | Dashboard builders and data authors | Based on role mix and current published pricing |
Explorer licenses | Business users who need to modify and explore | Based on role mix and upgrade pressure |
Viewer licenses | Read-only consumers | Based on role mix |
Infrastructure | Tableau Cloud add-ons or self-hosted server, backups, monitoring | Higher if you run Tableau Server |
Data preparation | Analyst time spent cleaning, joining, validating, and documenting data | Often one of the largest hidden costs |
Training and onboarding | New user ramp time and internal enablement | Commonly underestimated |
Administration and governance | Permissions, refresh schedules, content reviews, performance tuning | Ongoing operating cost |
Engineering support | Warehouse modeling, connectors, incident response, and troubleshooting | Frequently the cost that changes the ROI |
The practical budgeting questions are operational, not just financial:
How many people build from scratch? That sets your Creator baseline.
How many business users will ask for edit access after they start as viewers? That is where role upgrades hit the budget.
How much manual work happens before a dashboard is trusted in a meeting? That tells you whether the BI layer is efficient or whether it is consuming analyst and engineering capacity.
Who owns the system when something breaks? If the answer is a mix of analytics, engineering, and operations, your TCO is already above the license bill.
For teams comparing modern BI options, a benchmark of BI tool costs across Querio, Julius, and BlazeSQL is useful because it frames software spend against staffing overhead, which is usually the part founders miss.
The short version is simple. Tableau Desktop may be the line item you approve, but the true cost is often the engineering and analytics time required to keep the whole reporting stack usable as the company grows.
Key Factors That Inflate Your Tableau Bill
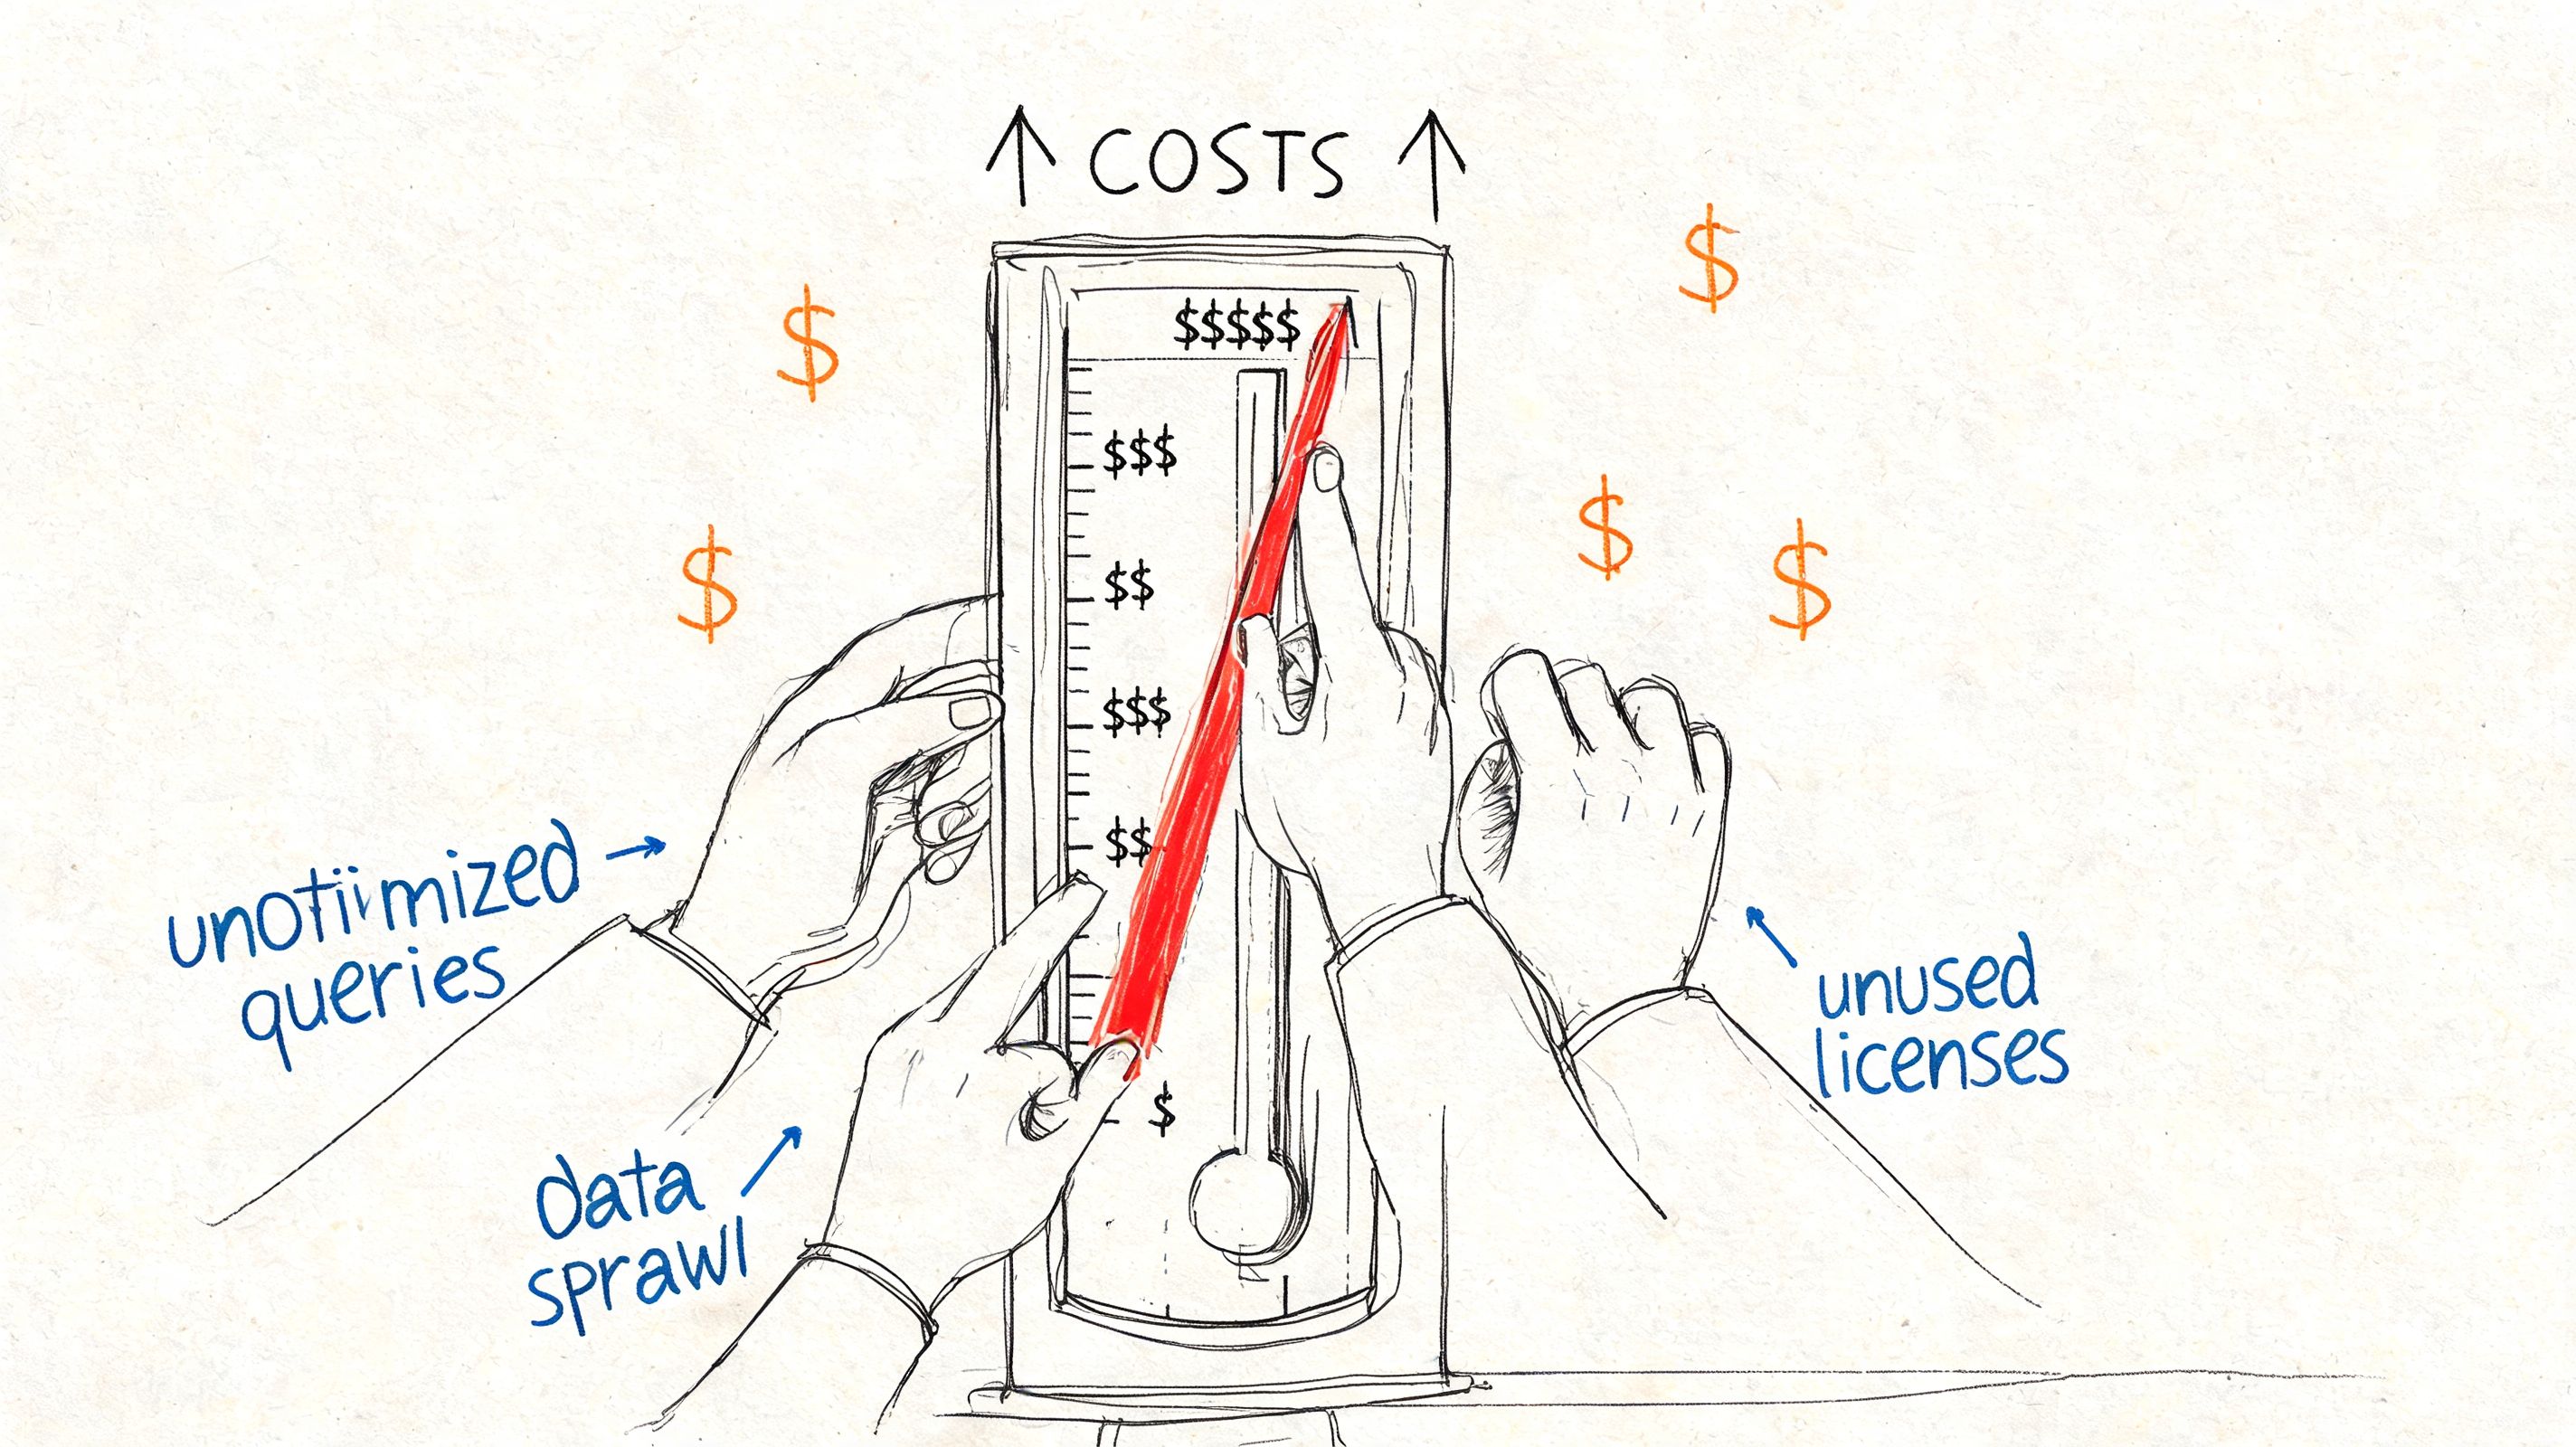
Role upgrades arrive as soon as data use gets serious
A startup often buys Tableau with a simple assumption. A small data team gets Creator, everyone else can stay cheap.
That assumption breaks fast. Mode's analysis of hidden Tableau pricing mechanics points out the gap between Viewer, Explorer, and Creator pricing, and why teams get pushed up the ladder once business users want to modify dashboards, explore data on their own, or build versions for their own meetings.
I have seen this pattern repeatedly. Sales wants to adjust filters without waiting on analytics. Finance wants its own cut of the board pack. Product wants to test a different metric definition before a planning review. None of that is unusual. It is what happens when people actually rely on data.
The license upgrade is only the visible part. Every new editor also creates more content to govern, more metric logic to review, and more room for conflicting definitions.
Growth multiplies more than seat count
Seat expansion looks manageable in a spreadsheet. The operating cost behind those seats is where teams get surprised.
A growing company does not just add users. It adds departments, planning cycles, revenue lines, markets, and exceptions. Tableau usage expands right alongside that complexity. More people ask for access, but they also ask for custom views, new data sources, fresher refreshes, and permission changes. The platform bill rises at the same time as the support load.
For founders, this is the part that matters. Headcount growth increases license spend, but data complexity is what forces you to add analytics engineering capacity. Tableau does not remove that burden. In many teams, it exposes it earlier.
Self-service usually depends on a technical backstop
Tableau is often sold as self-service BI. In practice, self-service has a ceiling unless the underlying data model is clean, governed, and consistently maintained.
That means someone has to do the work behind the curtain:
Model clean source tables: Business users cannot self-serve reliably on top of raw operational schemas.
Maintain connectors and refreshes: Broken pipelines turn dashboards into incident tickets.
Standardize metric definitions: Revenue, pipeline, retention, and margin drift quickly without active ownership.
Review performance issues: Slow dashboards usually trace back to extract design, warehouse structure, or poorly scoped calculations.
Consequently, the total cost discussion should include staffing, not just licenses. The hidden costs of traditional BI platforms for growing data teams show up as analyst rework, engineering interrupts, and extra infrastructure that exists mainly to keep reporting stable.
Content sprawl creates admin work that nobody budgets for
Once Tableau adoption spreads, dashboard count tends to grow faster than dashboard quality.
Teams copy an existing workbook, tweak it for a region or function, and publish a new version. That feels efficient in the moment. Over a year, it creates duplicated logic, unclear ownership, stale content, and long debates about which dashboard is the trusted one. Someone then has to audit permissions, retire old assets, review extracts, and answer the same question over and over: which number is correct?
That work lands on analysts, analytics engineers, or a BI admin if you are large enough to have one. For mid-market companies, it usually lands on people who already have a full-time job.
Tableau's sticker price is straightforward. The expensive part is the technical team required to keep self-service reporting accurate, fast, and trusted as the company grows.
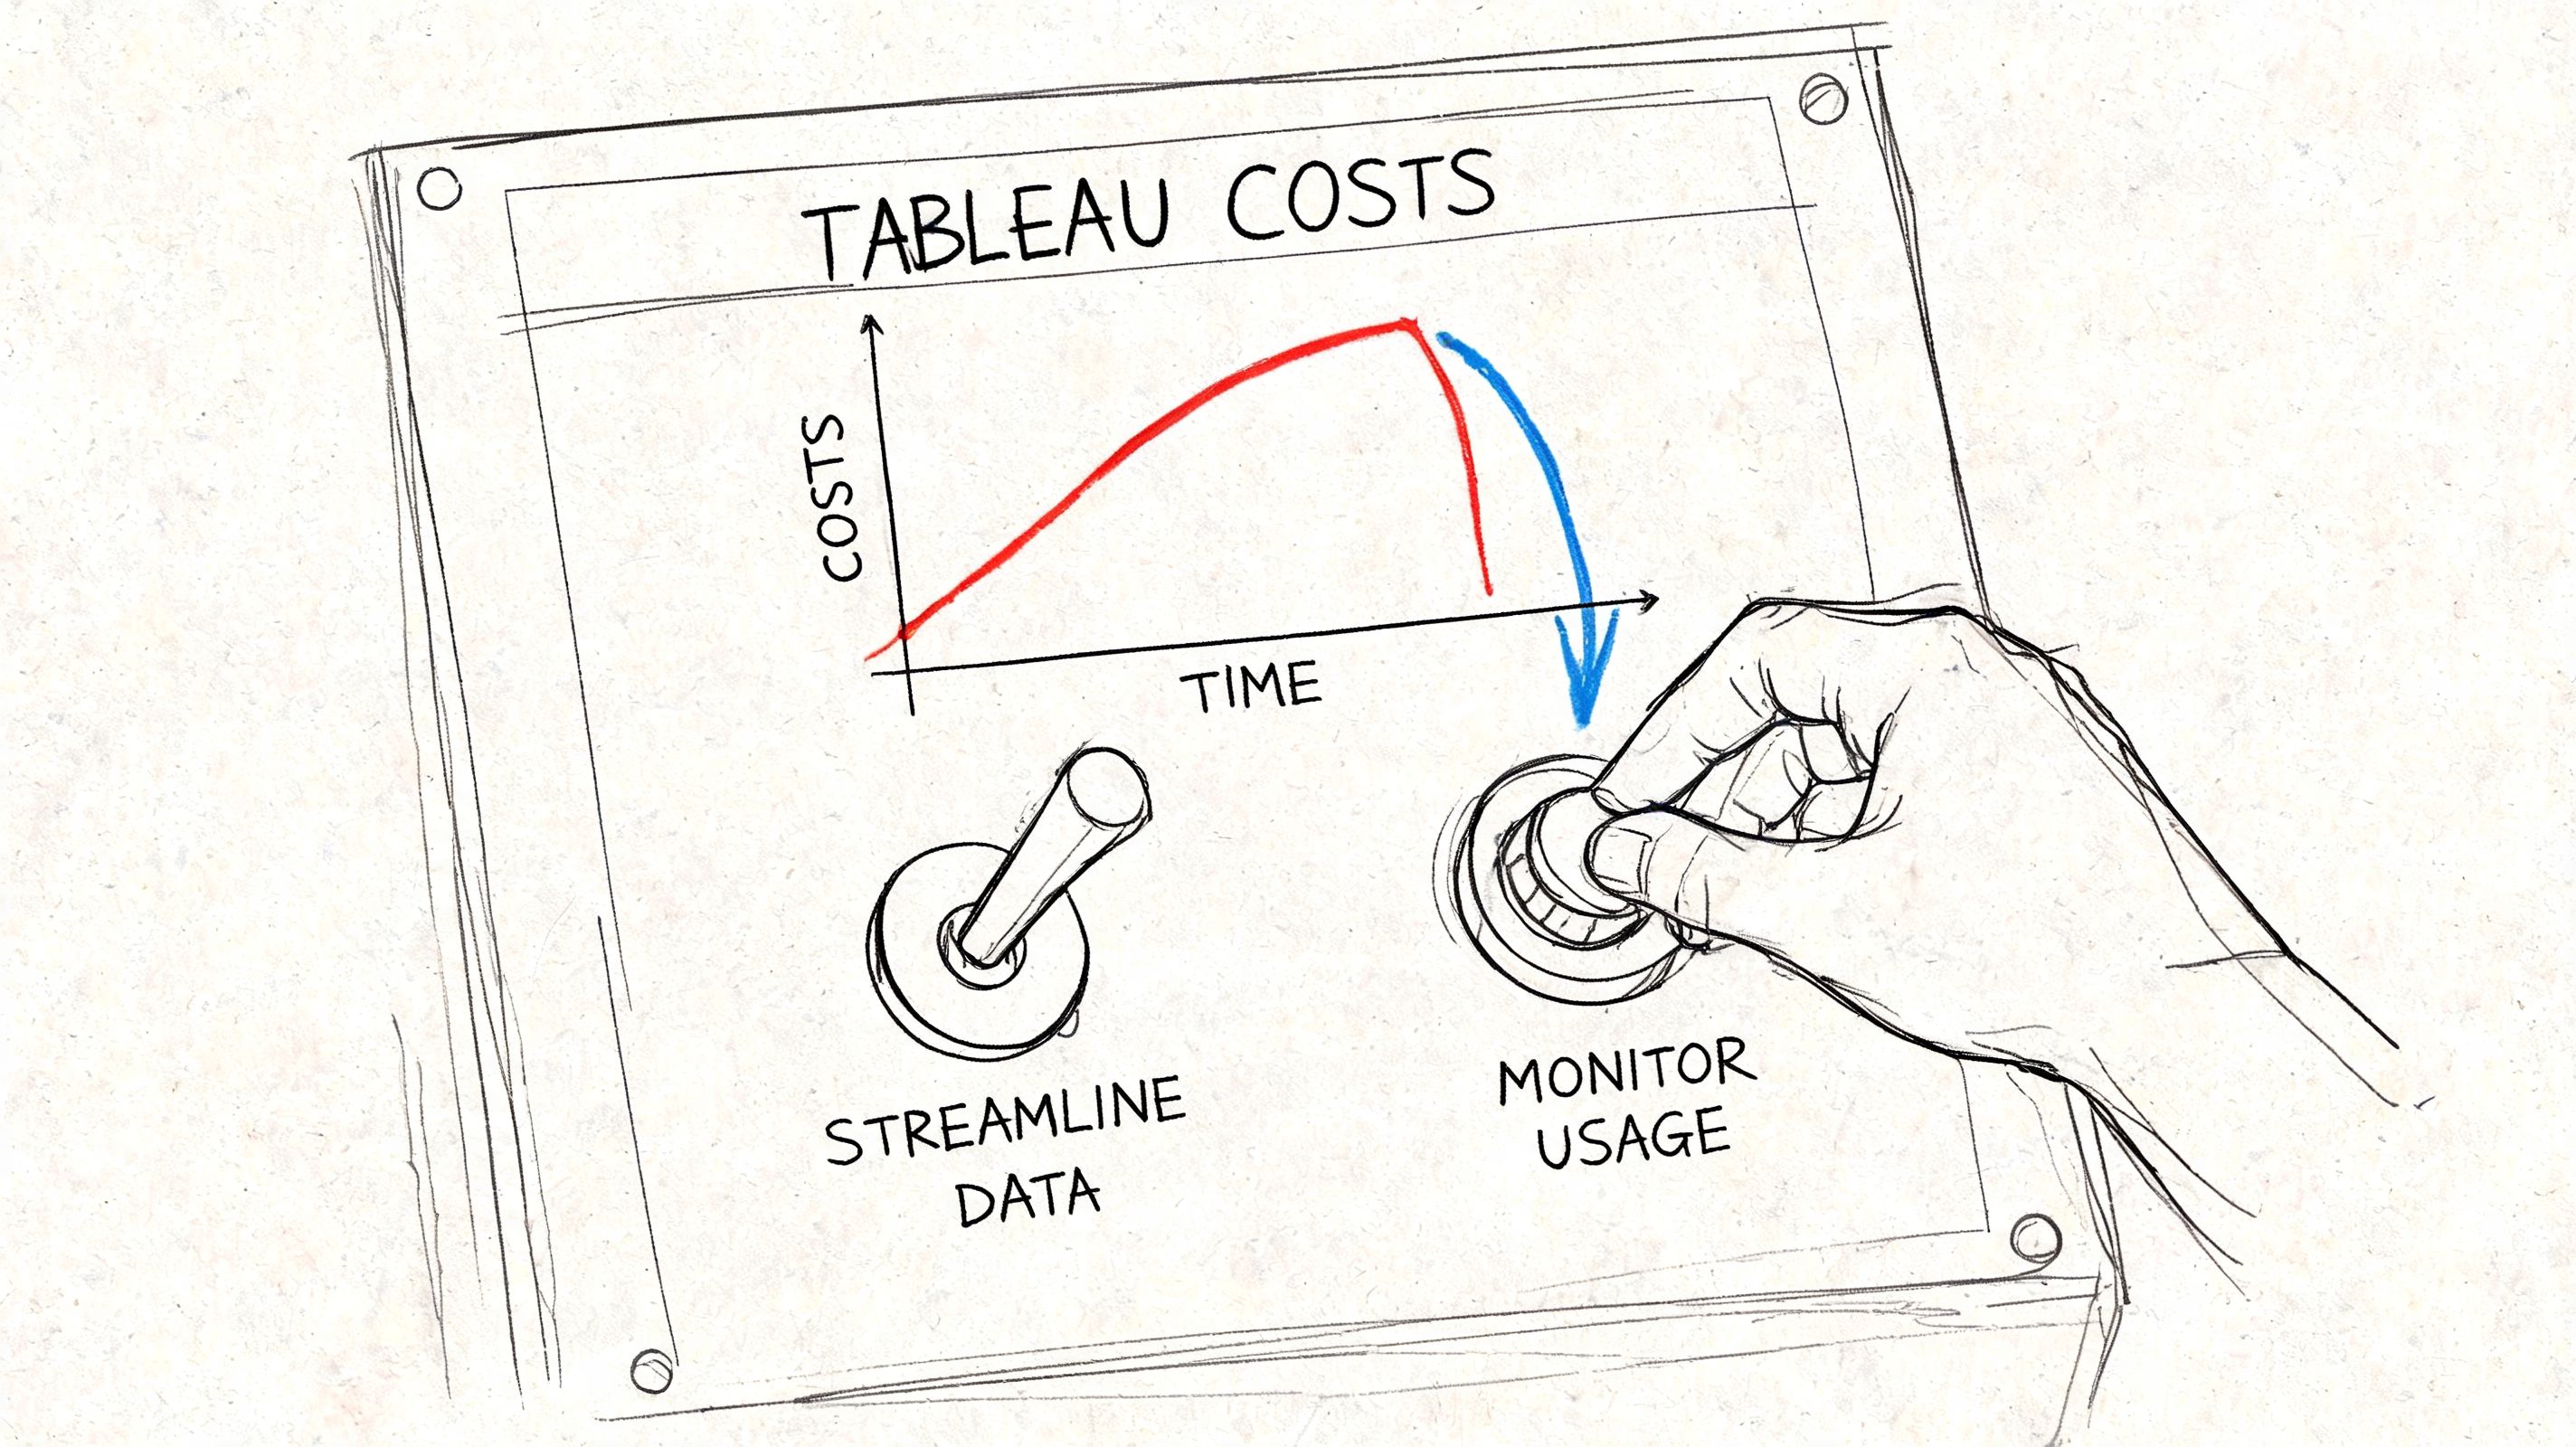
Practical Strategies to Optimize Your Tableau Spend
A startup usually feels Tableau cost pressure at renewal, but the savings decision starts much earlier. I have seen teams focus on per-seat pricing while ignoring the workflow around the tool. That is how a manageable BI bill turns into a permanent analytics support function.
The practical fix is to treat Tableau as a governed product inside your data stack. Licenses matter. Workflow design matters more.
Audit roles based on real usage
Start with activity, not org chart. Pull a list of who builds dashboards, who edits existing workbooks, and who only opens links in meetings. Then match license level to that behavior.
The expensive mistake is giving broad authoring access "just in case." In mid-market teams, that usually creates two problems at once. You overpay for seats, and you create more reports that need review, cleanup, and support.
A useful audit usually separates users into three groups:
Core builders: Keep these users on Creator if they publish new work, maintain shared assets, or own business-critical reporting.
Periodic editors: Review whether they need authoring rights year-round or only for a short project window.
Consumers: Keep these users on the lowest practical access tier.
This sounds administrative. It is really operating discipline.
Standardize the layer before Tableau
The fastest way to waste money in Tableau is to let every analyst solve joins, business logic, and naming conventions inside their own workbook. License optimization helps, but duplicated data work is where TCO gets away from smaller teams.
Set a rule that shared logic lives upstream. Build clean warehouse tables, agreed metric definitions, and a limited set of certified starting points. If a team needs revenue by segment, they should start from a trusted model, not rebuild the same calculation in five workbooks.
That change lowers support load in a very concrete way. Fewer broken extracts. Fewer conflicting KPI definitions. Fewer Slack threads asking why finance and sales show different numbers.
Teams that reach this point often also start comparing Tableau alternatives for visual data analysis tools across different budgets, especially when the cost of maintaining the BI layer starts to exceed the value of staying on a familiar interface.
A short walkthrough can help your team rethink current usage patterns:
Reduce surprise spend during renewals
Renewal prep should look more like a usage review than a procurement exercise. Check which dashboards are still used, which teams still depend on manual analyst help, and where expensive seats exist mainly because the underlying data is hard to work with.
Use that review to tighten a few policies:
Set clear Creator rules: Tie authoring seats to ongoing dashboard ownership or repeated build work.
Archive unused content: Remove stale dashboards that create confusion and support overhead.
Limit one-off variants: If teams keep asking for slightly different versions of the same report, fix the source model instead of publishing copies.
Track prep work separately: If analysts are still spending significant time cleaning data before they can build in Tableau, count that labor as part of Tableau cost.
Operator's note: The biggest Tableau savings usually come from reducing custom data prep and report maintenance, not from negotiating a small discount on licenses.
When to Evaluate Alternatives for Modern Data Teams
The old model breaks when the company speeds up
There is a point where optimizing Tableau no longer addresses the underlying problem. That point usually arrives when the company wants broad self-service, faster iteration, and less dependence on a small data team.
At that stage, the issue isn't just cost. It's operating model. Traditional BI tools assume a chain of work where data gets prepared, dashboards get built, permissions get assigned, and business users consume what has been published. That can work in a stable enterprise environment. It often struggles in a scaling startup where product, finance, growth, and operations all need to ask new questions constantly.
Labor creates the primary bottleneck. This discussion of BI value and workflow inefficiency is cited in the verified data for the tension between Tableau's visualization strengths and the fact that teams still spend 60% to 80% of time on data prep. That problem isn't solved by having three license tiers.
What modern teams want instead
Modern teams usually want four things:
Direct access to trusted warehouse data without routing every new question through a dashboard author.
Flexible exploration for technical and non-technical users.
Less per-seat friction when more people need answers.
Fewer handoffs between analyst, analytics engineer, and stakeholder.
That is why many mid-market teams are moving toward code-native or AI-native analytics workflows. The verified data notes that mid-market organizations are shifting toward file-system Python notebook approaches that enable non-technical self-service without per-user license pressure, especially where traditional BI leaves analysts stuck in repetitive prep work.
If you're evaluating those options, this guide to Tableau alternatives for visual data analysis tools is a practical place to compare categories, not just products.
A simple decision test
You should seriously evaluate alternatives if any of these are true:
Your analysts spend more time preparing and fixing data than interpreting it.
Business teams need answers that don't fit neatly into prebuilt dashboards.
License expansion keeps following headcount growth even when analytical maturity hasn't improved.
You keep adding process around the tool just to make self-service safe.
None of that means Tableau is bad software. It means the cost of tableau desktop may be attached to a model your company has outgrown.
For enterprise BI teams with established governance, Tableau can still fit. For lean data teams serving fast-moving operators, the larger question is whether the dashboard-centric workflow is the thing creating cost and delay in the first place.
Frequently Asked Questions About Tableau Costs
Is Tableau Desktop sold on its own?
For current buyers, Tableau Desktop usually comes as part of the Creator license, not as a separate line item. If a founder asks, "What does Tableau Desktop cost?" the useful answer is, "What will your Creator seats cost, and how many people will end up needing them?"
That distinction matters because teams rarely stop at one or two authors once reporting demand spreads across finance, ops, and go-to-market.
What are the main Tableau user tiers?
The standard tiers are Creator, Explorer, and Viewer. Creator builds and manages content, Explorer interacts with and edits governed content, and Viewer consumes dashboards.
On paper, that looks clean. In practice, startup teams blur those boundaries fast. A sales ops lead wants to tweak a metric, a finance manager wants to test a filter, and a product analyst ends up owning data quality checks. That is how seat planning drifts upward even before you account for the people supporting the data underneath it.
Is there a free version?
There is a free way to use Tableau Desktop for limited local analysis on flat files. It works for individual experimentation and early prototyping.
It does not solve collaboration, governed access, shared metrics, or production reporting. For a company team, those are usually the reasons you bought BI in the first place.
Are perpetual licenses still the model?
No. Tableau moved away from the old perpetual-license approach and now sells through subscriptions.
For budgeting, that changes the conversation. The cost is no longer a one-time software purchase plus occasional renewal. It becomes an ongoing operating expense tied to user counts, platform administration, and the internal work required to keep dashboards trustworthy.
Is Tableau Cloud cheaper than self-hosting?
Cloud is often easier to run because you avoid managing Tableau Server infrastructure directly. That can reduce admin burden for a smaller team.
It does not remove the broader cost structure. You still pay for seats. You still need data models, access controls, refresh logic, testing, and someone to handle the inevitable question of why two dashboards show different numbers. Self-hosting adds more operational overhead. Cloud mainly shifts where that overhead sits.
What's the biggest hidden cost for startups?
The biggest hidden cost is usually the support system around Tableau, not the license itself.
A startup founder may budget for software and then discover they also need an analytics engineer to clean inputs, a data engineer to maintain pipelines, and an analyst to keep business logic consistent across dashboards. That is the TCO problem mid-market teams run into. Tableau can be a capable front end, but scaling it often means hiring the team that makes the front end usable.
If your team is stuck between expensive BI seats and a growing backlog of analytics requests, Querio is worth a look. It deploys AI coding agents directly on your data warehouse so teams can move from dashboard bottlenecks and human-API workflows toward faster self-service analytics.

