How to Standardize Data: A guide on how to standardize data
Discover how to standardize data with a practical, step-by-step guide. Learn schemas, automation, and tips for consistent, reliable data.
https://www.youtube.com/watch?v=uPsUjKLHLAg
published
Outrank AI
how to standardize data, data standardization, data quality, data consistency, data governance
9fb75f51-3fca-42c2-b547-e9eca880030d

Learning how to standardize data means creating one single, consistent format for information that lives in different systems and databases. It’s the process of making sure that values like 'USA', 'United States', and 'U.S.' all get translated into a single, official version, like 'United States', so you can actually trust your reports and analysis.
Why Standardizing Data Is Your Secret Weapon
Let's get real for a second. Imagine your sales team logs a customer's location as "USA." At the same time, your marketing automation platform uses "U.S.", and the billing system has it down as "United States." When your finance team tries to pull a simple report on revenue by country, they get three different results for the exact same place.
This isn't just a minor headache; it's a crack in the very foundation of your business intelligence. These little inconsistencies quietly undermine everything from your financial forecasts and marketing campaign analysis to your product analytics.
Here’s a quick look at how these seemingly small issues can cause big problems across the business.
Common Data Inconsistencies and Their Business Impact
Inconsistency Type | Example | Business Impact |
|---|---|---|
Formatting Differences | "USA" vs. "U.S." vs. "United States" | Finance: Inaccurate revenue reports by region. Marketing: Skewed campaign performance metrics. |
Case Sensitivity | "Apple Inc." vs. "apple inc." | Sales: Duplicate account entries and fragmented customer views, leading to confused outreach. |
Date/Time Formats | "10/01/2024" vs. "2024-10-01" | Operations: Incorrect event sequencing, missed deadlines, and flawed supply chain analysis. |
Data Type Mismatches | "5.0" (string) vs. 5 (integer) | Analytics: Failed calculations and broken dashboards, making it impossible to aggregate data. |
Spelling and Typos | "New York" vs. "Nwe Yrok" | Customer Support: Difficulty locating customer records, leading to slower response times and frustration. |
As you can see, what starts as a data entry quirk quickly snowballs into a real business liability, affecting nearly every team.
This problem is anything but new. Back in the late 19th century, the U.S. Census Bureau estimated it would take a full eight years to process all the data from the 1880 census. This massive bottleneck spurred Herman Hollerith to invent his tabulating machine, which used punched cards to standardize data entry. The result? Processing time for the 1890 census was slashed to just 2.5 years—a staggering 75% reduction.
Today's modern platforms, like Querio, build on this very legacy. They automate the standardization process, turning what could be weeks of manual data cleanup into a workflow that takes just a few minutes.
Building a Foundation of Trust
When your data is standardized, it becomes trustworthy. Simple as that. Your teams no longer have to second-guess the numbers they see in their dashboards or waste hours manually cleaning spreadsheets before every important meeting. Instead, they can get straight to the good stuff: figuring out what the data actually means.
This fundamental reliability empowers everyone to make faster, more confident decisions. A product manager can accurately track feature adoption across different countries. An operations lead can get a true read on supply chain efficiency. This shared trust is what transforms data from a source of endless confusion into a genuine strategic asset.
"Standardization is the bedrock of a data-driven culture. Without it, you don't have metrics; you have a collection of conflicting opinions supported by questionable numbers."
The Strategic Imperative
At the end of the day, learning how to standardize data isn’t just a technical chore for the data team to worry about. It’s a strategic imperative for any company that wants to use accurate insights to grow and stay competitive.
Think of it as an investment that pays you back over and over by:
Slashing Manual Work: It eliminates the countless hours people spend fixing inconsistent entries and trying to reconcile conflicting reports.
Improving Decision Velocity: It lets teams get their hands on reliable information and act on it immediately, without hesitation.
Strengthening Governance: It creates a clear, enforceable system for maintaining high-quality data. You can learn more by checking out our guide on data governance best practices.
When you frame it this way, data standardization shifts from a boring background task to a core business function that directly props up your bottom line.
How to Build Your Data Standardization Framework
Alright, we've talked about why clean data is so critical. Now, let's get into the how. Building a framework to standardize your data isn't just a technical task for the data team; it's a cross-functional project that needs a solid plan and clear ownership to succeed. The goal here is to get from data chaos to a state of clarity that everyone in the business can actually trust and use.
This whole process is about turning messy, unreliable information into one of your most valuable assets. It's easy to underestimate the damage bad data can do, but it creates a nasty domino effect.
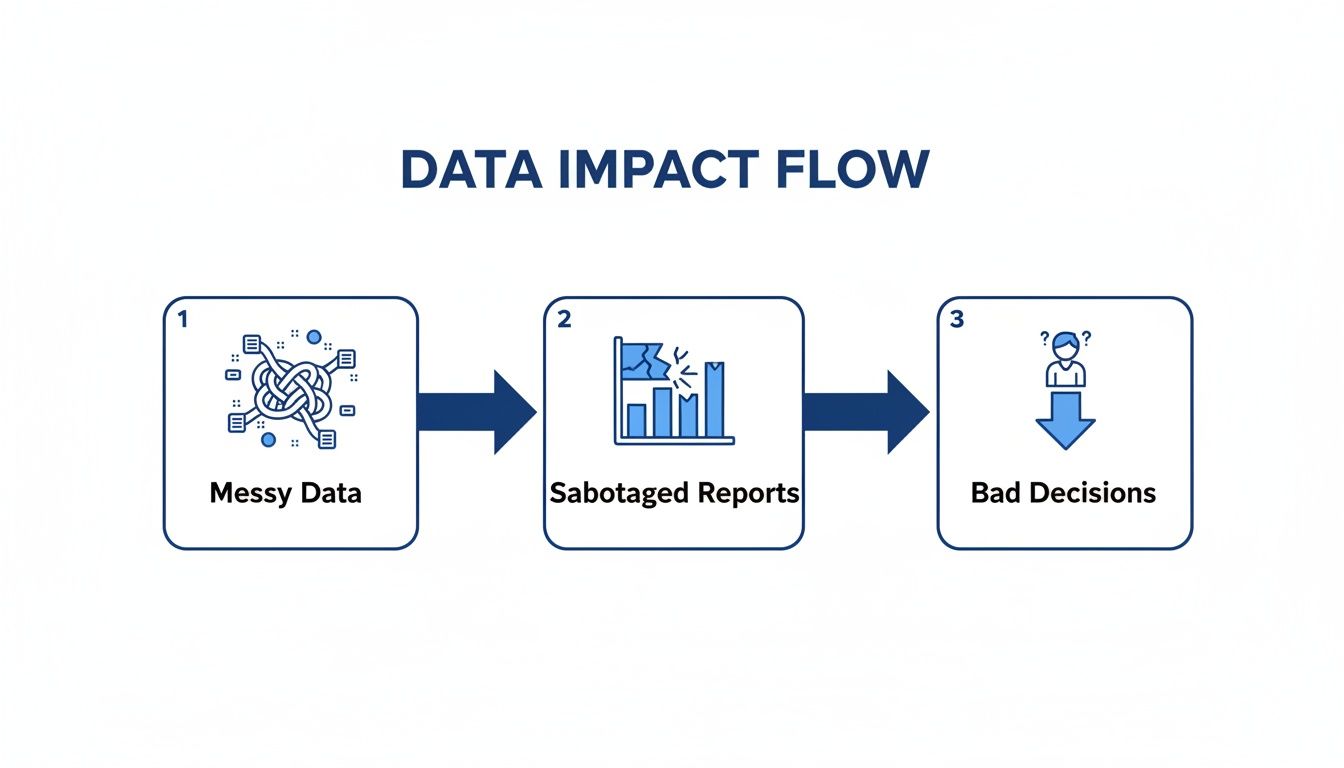
Think of that image as a constant reminder of the stakes. Standardizing your data is how you break that destructive cycle. It's what ensures your strategy is built on a foundation of accuracy, not just a pile of assumptions.
Start with Discovery and Scoping
Before you can fix anything, you have to understand the mess. The first real step is discovery—figuring out which data domains are most important and how they're being used (or misused) today. The biggest mistake I see teams make is trying to boil the ocean by standardizing everything at once. Don't do that.
Instead, prioritize by pain. Where are the data inconsistencies hurting your teams the most?
Customer Data: Is your sales team pulling their hair out over duplicate accounts and conflicting contact info?
Product Data: Can your product team actually track feature adoption across your web and mobile apps, or is it a guessing game?
Financial Data: Does your finance department spend the first week of every month just trying to reconcile revenue numbers from different systems?
Pick one high-impact area—like customer data—and focus on getting it right. Scoring a quick, visible win shows everyone the value of this work and builds the momentum you'll need to tackle the next domain.
Define Your Canonical Schema and Master Data
Once you've picked your starting point, it's time to define your single source of truth. This means creating a canonical schema, which is just a fancy term for the official blueprint of what your data should look like. It lays out the required fields, their data types (text, integer, date, etc.), and any rules they need to follow.
At the same time, you'll establish your master data. This is the golden record for your most important business entities. For instance, a "master customer record" would pull together information from your CRM, billing software, and support desk into a single, unified profile.
This isn't something the data team does in a vacuum. Defining standards has to be a collaborative effort. The Head of Sales needs to have the final say on what defines a "qualified lead." The finance team must own the official calculation for "monthly recurring revenue." The data team's job is to facilitate, but the business experts have to own the definitions.
Getting these definitions written down and agreed upon is absolutely essential. To keep everyone on the same page, you might want to look into using a data glossary builder for clear terms to document these standards where the whole company can find them.
Clean and Normalize the Messy Values
With your new standards in hand, you can finally roll up your sleeves and start the cleanup. This is where you attack the inconsistencies, transforming raw, messy values into a clean, compliant format. It usually boils down to a few key activities.
Removing Duplicates: Finding and merging all the different records for the same customer or product.
Correcting Errors: Fixing typos and other obvious mistakes (e.g., changing "Nwe Yrok" to "New York").
Parsing Values: Breaking up single fields that contain multiple pieces of information, like splitting a full address into separate street, city, state, and zip code columns.
Normalizing Formats: Forcing consistency for things like dates (always YYYY-MM-DD), phone numbers, and country codes (sticking to the ISO 3166-1 alpha-2 standard).
This part can feel like a grind, but it’s where the real transformation happens. This is the hands-on work that closes the gap between the chaos you have and the clean data you need.
Map and Transform Source Fields
The last piece of the puzzle is mapping the fields from your source systems to your new canonical schema. This means writing transformation logic—a set of rules that tells your data pipeline how to convert an incoming value into the standard format.
For example, a rule might be: "If the 'country' field from our CRM is 'U.S.' or 'USA', change it to 'United States' before loading it into the master record."
This mapping is what makes the whole system sustainable. It ensures that any new data coming in is automatically cleaned and standardized. It's the engine that turns a one-time cleanup project into an ongoing, reliable process that consistently delivers trustworthy data.
Real-World Data Standardization Examples
Theory is great, but let's get our hands dirty. Seeing data standardization in action is where it all starts to make sense. We'll walk through a couple of practical examples to show how you can turn messy, inconsistent data into a clean, reliable asset, whether you’re a SQL wizard or prefer a more modern, no-code approach.

Let's start with a classic headache. Your users table has a country column, but it's a total free-for-all. You’ve got "USA," " United States ", "u.s.", and a bunch of nulls. Try running a simple GROUP BY country on that—your results would be completely skewed.
The Traditional SQL Approach
If you're comfortable writing code, you’d probably reach for SQL to clean this up. The go-to method involves writing a query with a CASE statement to methodically map every variation to a single, standard format. You'd also use functions to handle pesky whitespace and case sensitivity issues.
A typical script would look something like this:
SELECT
user_id,
email,
CASE
WHEN TRIM(LOWER(country)) IN ('usa', 'u.s.', 'united states') THEN 'United States'
WHEN TRIM(LOWER(country)) IN ('uk', 'gb', 'united kingdom') THEN 'United Kingdom'
ELSE 'Other' -- Or COALESCE(country, 'Unknown')
END AS standardized_country,
created_at
FROM
raw.users;
This works perfectly well. The TRIM() function gets rid of extra spaces, LOWER() makes sure "USA" and "usa" are treated the same, and the CASE statement does the heavy lifting of mapping everything correctly.
The downside? It's entirely manual. Every time a new variation pops up, a developer has to go in and update the code. This is especially true when dealing with external rules, like navigating the strict UAE E-Invoicing requirements for FTA Compliance, where consistency is non-negotiable.
The Modern No-Code Alternative
Now, let’s look at the same problem through the lens of an AI-powered platform. A business user connects their data source, and instead of them having to hunt for inconsistencies, the platform's AI agent does it for them.
It scans the country column, instantly spots the different formats, and understands they all mean the same thing. The user gets a simple, plain-English prompt:
"We noticed multiple variations for 'United States' in your 'country' column. Would you like to standardize them all to 'United States'?"
With just one click, the rule is applied. The platform handles all the transformation logic in the background and, more importantly, saves that rule to the data model. From that point on, all new data flowing into the system is standardized automatically. No more manual updates.
This no-code method puts the power directly into the hands of the people who know the data best, making it a natural fit for a solid governance plan. You can see how this aligns with the principles in our guide on creating a data governance framework with examples.
SQL vs No-Code Standardization Approaches
Deciding between these two methods comes down to your team's skillset, timeline, and long-term goals. Here’s a quick breakdown to help you compare.
Aspect | SQL Approach | AI-Powered Platform (like Querio) |
|---|---|---|
Effort | High. Requires manual coding for each rule and ongoing maintenance as new data variations appear. | Low. AI suggests rules automatically. Users apply them with a single click. |
Skills Required | Technical. Deep knowledge of SQL, data cleaning functions, and database structure is essential. | Non-technical. Intuitive, user-friendly interface designed for business users and analysts. |
Time to Value | Slower. The process of writing, testing, and deploying SQL scripts can be time-consuming. | Immediate. Standardization rules can be identified and applied in minutes, not hours or days. |
Scalability | Limited. Manual updates become a bottleneck as the number of data sources and variations grows. | High. Once a rule is set, it's automatically and consistently applied to all past and future data. |
Collaboration | Siloed. Typically handled by data engineers or developers, creating a disconnect from business context. | Collaborative. Empowers business teams to own data quality, fostering a shared sense of responsibility. |
While SQL gives you precise, granular control, it often creates a technical bottleneck. AI-driven tools, on the other hand, are built for speed, accessibility, and automation, turning data standardization from a coding challenge into a straightforward business function.
Common Mistakes to Avoid in Your Standardization Journey
Every data project is a minefield of potential traps, and data standardization is no different. I've seen teams spend months, even years, wrestling with these projects, and a lot of the pain comes from a few recurring, avoidable mistakes. Knowing what these are ahead of time can save you from a world of rework and frustration.

One of the biggest project killers is analysis paralysis. This is the classic trap where teams get so obsessed with architecting the "perfect" canonical schema that they never actually get their hands dirty. They endlessly debate every conceivable edge case and future what-if scenario until the project completely stalls.
The fix? Stop trying to boil the ocean. Pick a single, high-impact data domain—customer or sales data is usually a great starting point—and focus on getting that right. A quick win proves the value of the effort and builds the momentum you need to tackle the next phase.
Underestimating the Data Cleaning Effort
Another classic blunder is glossing over the initial data cleanup. It’s so easy to glance at a dataset and think, "A few find-and-replace scripts and we're good." But once you start digging, you unearth layers of gnarly inconsistencies, typos, and formatting nightmares that demand serious time and effort.
Frankly, this initial cleanup is often the most grueling part of the entire process. To avoid getting completely blindsided, here’s my advice:
Do a proper data audit before you even think about setting a timeline. Profile your data to see exactly what you're up against.
Buffer your time estimate generously. It's always better to finish ahead of schedule than to explain why you’re falling behind.
Find tools that can automate the tedious parts of the cleaning process. This will save your team’s sanity.
The idea of measuring and controlling variance isn't new. Back in 1894, Karl Pearson introduced the concept of standard deviation, giving statisticians a universal way to measure variability. The principle that 68% of data falls within one standard deviation helped create a common ground for comparing datasets. Today, we apply that same spirit to business intelligence. Platforms like Querio can help eliminate the staggering 30-40% error rates found in manual reports by enforcing standards across all metrics. You can explore more of this history in this deep dive on big data.
Treating Standardization as a One-Off Project
This is perhaps the most critical mistake of all: viewing standardization as a one-and-done project. The reality is that it’s an ongoing discipline of governance and maintenance. Your data sources will change, new tools will come online, and business requirements will evolve.
Without a plan for continuous oversight, your pristine, standardized data will slowly decay back into chaos. This is what we call "standards drift," and it can completely undo all your hard work in a matter of months.
To keep this from happening, you have to establish clear ownership and a governance framework right from the start. Define who is responsible for maintaining the standards, create a formal process for handling new data sources or fields, and set up regular data quality monitoring.
Standardization isn't a destination; it's a commitment. It’s about building and maintaining a reliable data foundation that your entire company can trust.
How AI Puts Data Standardization on Autopilot
While all the frameworks and best practices we’ve covered are crucial, let's be honest: putting them into practice manually is a slow, painful grind. This is where modern AI-powered platforms completely change the equation. They turn standardization from a never-ending chore into an automated, intelligent system that works for you.
The real magic is how an AI agent can proactively spot inconsistencies that a human might miss. Instead of a data analyst spending half a day writing complex SQL queries just to hunt down every variation of "United States," an AI can scan the data, understand the context, and automatically flag all those discrepancies. It completely flips the workflow from tedious manual hunting to simple, quick validation.
From Manual Drudgery to Automated Intelligence
An AI-powered BI platform like Querio doesn't just point out problems; it actually helps you fix them. After finding a mess of different country codes, for example, it might present a simple, one-click option to normalize everything to the official ISO standard.
What used to be hours of painstaking scripting and testing becomes a task that takes seconds. This shift makes a huge difference and opens up data governance to more people on the team.
This automated approach has some serious advantages over doing things the old-fashioned way:
Speed: You can compress what would have been weeks of manual data profiling and cleaning into just a few minutes.
Accuracy: It takes human error out of the picture. No more worrying about a typo in a complex transformation script messing up your data.
Scalability: Once a rule is learned, it's applied consistently across all your data—past, present, and future. Your standards won't slowly erode over time.
The potential for AI here is massive. You can learn more about how platforms like OpenAI can accelerate and enforce data standards to get a sense of where this technology is headed.
Enforcing That Single Source of Truth
Fixing messy data is one thing, but keeping it clean is another challenge altogether. This is where AI really shines—by enforcing the standards you’ve worked so hard to define. A platform with a built-in knowledge base or data dictionary becomes your central command for every metric definition and business rule.
When someone on your team asks a question, the AI pulls from this centralized context to give a consistent, accurate answer.
This means metrics like "Monthly Active Users" or "Customer Churn Rate" get calculated the exact same way for everyone in the company, every single time. It finally puts an end to that classic, frustrating scenario where the sales and marketing teams show up to a meeting with completely different numbers for the same KPI.
Better yet, by allowing people to ask questions in plain English, these platforms give non-technical users direct access to standardized data without ever needing to write code. A product manager can just ask, “What was our user retention by country last quarter?” and get a trustworthy chart back in seconds.
The AI handles all the complex logic behind the scenes, making sure the query runs against clean, standardized data. Our guide on AI-powered data validation and how it works goes into more detail on how this actually works.
Ultimately, this approach bakes standardization directly into your analytics workflow. It’s no longer an afterthought but a reliable, automated foundation for every decision you make.
Common Questions We Hear About Data Standardization
Even the best-laid plans run into real-world questions. When you start getting your hands dirty with a data standardization project, a few common queries always seem to pop up. Let's tackle them head-on.
How Often Should We Revisit Our Data Standards?
Think of your data standards as a living document, not a stone tablet. They need to adapt as your business grows and changes.
A good rule of thumb is to conduct a formal review at least quarterly. You should also trigger a review anytime something major happens—think launching a new product line, expanding into a new region, or migrating to a new CRM. This proactive approach keeps your standards relevant and prevents the dreaded "standards drift" that can slowly erode data quality over time.
What's the Real Difference Between Standardization and Normalization?
These two terms get thrown around and used interchangeably all the time, but they’re not the same thing. Getting the distinction right is crucial for a successful project.
Data Standardization is all about consistency. It’s the process of making sure all your data values conform to a specific format. A classic example is converting all state names like "California," "Calif.," and "Cali" into the standard two-letter code, "CA." It’s about making data uniform and predictable for analysis.
Data Normalization is typically a more technical term. In the database world, it refers to structuring tables to reduce data redundancy. In machine learning, it means scaling numeric values to a fixed range (like 0 to 1) to help algorithms perform better.
The bottom line is this: Standardization focuses on making the meaning and format of your data consistent. Normalization is more about optimizing database structure or preparing data for a specific technical application.
Who Actually Owns Data Standardization?
This is a big one. It's tempting to point to a single person, like a Head of Data, but that's a recipe for failure. True data standardization is a team sport.
Success requires a culture of shared responsibility. Here’s how it usually breaks down:
Business Leaders (e.g., Head of Sales, VP of Marketing) are the subject matter experts. They define what "good" data actually looks like for their departments.
Data Engineers and Analysts are the builders. They design, implement, and maintain the transformation pipelines that enforce the standards.
Front-line Staff are the guardians. The people entering data every day are critical for maintaining quality at the source.
Without buy-in from all three groups, the initiative is bound to fail. Everyone needs to have skin in the game.
Ready to stop wrestling with messy data and start getting instant, reliable answers? Querio's AI agents automate the entire data standardization and analysis process, allowing your team to ask questions in plain English and get trustworthy insights in seconds. See how Querio works.

