Enterprise: enterprise business intelligence for smarter decision-making
Discover how to build a winning enterprise business intelligence strategy, choose the right tools, and turn data into measurable business outcomes.
https://www.youtube.com/watch?v=b6Ijcii2n-M
published
Outrank AI
enterprise business intelligence, bi strategy, data analytics, bi implementation, ai business intelligence
28573d5d-f4fb-4dea-ba57-db501a0acc4d

Enterprise Business Intelligence (EBI) is the organization's single, authoritative source for data. It’s a top-down, strategic approach that combines technology, processes, and strict governance to ensure everyone—from the C-suite to front-line managers—is working from the same set of trusted facts.
This isn’t just about building a few dashboards. Think of EBI as the central nervous system for your entire company, making sure every department bases its decisions on the same verified, consistent information. It’s built from the ground up for scale, security, and reliability, creating a stable foundation for long-term strategic planning.
Unpacking Enterprise Business Intelligence
Let’s use an analogy. Imagine EBI as the official, city-planned water system for a major metropolis. It’s a massive, centralized infrastructure designed to deliver clean, standardized, and reliable water to every home and business. The system is meticulously managed and secured to handle the needs of the entire population, ensuring the water from your tap is the same high quality as the water miles away. It's all about trust and mass distribution.
Self-service analytics, on the other hand, is more like digging individual wells. A well is great for a specific household—it’s fast and serves an immediate need. But it isn't governed by a central authority, the water quality can vary, and it doesn't connect to a unified, city-wide infrastructure. You end up with isolated pockets of resources, making it impossible to get a complete picture of the city’s overall water supply.
A Framework for Strategic Decisions
At its core, Enterprise BI is the framework that prevents "data chaos." Without it, you get a situation where different teams pull similar-sounding metrics that are calculated in completely different ways. Marketing’s "active customer" count might not match what finance is reporting, which quickly leads to confusion, arguments, and a deep mistrust of the data itself.
An effective EBI strategy stops this by making sure everyone is reading from the same playbook. It does this by establishing:
A Single Source of Truth: All business-critical data flows from one centralized and governed data warehouse. No more siloed spreadsheets or conflicting databases.
Standardized Metrics: Key Performance Indicators (KPIs) like "monthly recurring revenue" or "customer lifetime value" are defined once and used consistently across the entire organization.
Governed Access: Robust security protocols ensure people only see the data they're authorized to view, safeguarding sensitive company and customer information.
This structured, centralized approach is no longer a luxury—it’s becoming essential. The global market for business intelligence was valued at US$37.22 billion in 2024 and is expected to more than double to US$73.36 billion by 2033, a surge driven by the urgent need for reliable, large-scale analytics. You can discover more strategic insights on the BI market.
This growth signals a fundamental shift toward treating data as a core, centrally managed asset. For a deeper dive into the foundational concepts, check out our guide on what business intelligence and analytics are.
Ultimately, Enterprise BI is less about any single report and more about building a culture of trust in data—one that empowers coordinated, intelligent action across the whole company.
The Architecture of a Winning BI System
An enterprise BI system isn't a single tool you just install. It's a whole ecosystem, carefully engineered for stability, trust, and massive scale. Think of it like a city’s power grid. You wouldn’t run a direct line from a nuclear power plant to a single factory; that would be chaotic and dangerous. Instead, you build a network of substations and transformers to deliver reliable, controlled energy exactly where it’s needed.
That's precisely what a good BI architecture does for data. It creates a governed pathway from raw, messy information to a clean, actionable insight on a business user's dashboard. This structure is the only way to guarantee data integrity—to make absolutely certain that when two people look at the same metric, they see the exact same number. Every single time.
The Foundational Layers of Enterprise BI
A solid BI architecture is built in layers. Each one has a specific job to do, transforming and securing the data as it flows through the system. This layered approach is the antidote to the "spaghetti architecture" that so many companies accidentally build, where data pipelines are a tangled mess and nobody can trace where the numbers actually came from.
Here are the essential components that hold it all together:
Data Sources: This is ground zero. It’s all the places your raw data lives—your CRM (think Salesforce), ERP systems, marketing tools, production databases, and yes, even those countless spreadsheets.
Data Integration (ETL/ELT): This is the logistics network. Data gets pulled from its source, reshaped into a standard format, and then loaded into a central repository. This ETL (Extract, Transform, Load) process is where the magic happens; it cleans, validates, and organizes the data to ensure it's consistent.
Data Warehouse/Lakehouse: This is the central power station. A data warehouse is a specialized, high-performance database built for lightning-fast analysis. It stores all your historical data in one place, becoming the undisputed single source of truth for the entire organization.
Analytics and Visualization Layer: This is the storefront. It’s the user-facing part of the whole system—the BI platform itself, like Querio—where people actually explore data, build dashboards, and pull reports.
The entire point of this architecture is to create a clean, auditable trail from raw data to a final report. It’s this disciplined flow that builds unshakable, company-wide trust in the numbers.
Why This Structure Is So Critical for Trust
Without this methodical architecture, every report is a potential landmine. If analysts are just pulling data directly from live production systems, they could slow down the very applications the business relies on to function. Even worse, they're likely applying their own unique business logic, which leads to conflicting reports and meetings where everyone argues about whose numbers are right. Trust evaporates.
This diagram shows how a central BI system acts as the "brain," connecting different departments to a single, unified source of intelligence.
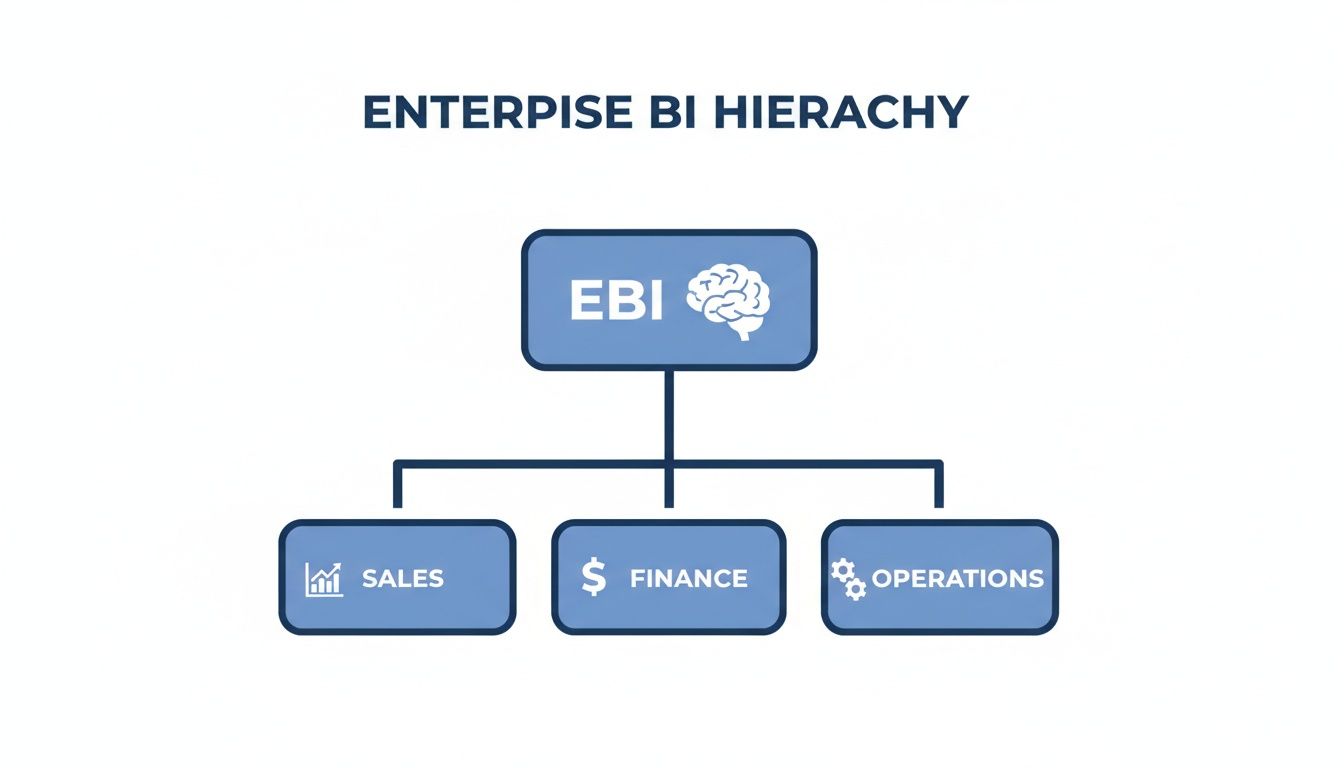
This centralized model makes sure that Sales, Finance, and Operations are all drinking from the same well of governed, consistent data. It breaks down the silos that kill collaboration. If you want to dive deeper, you can find a complete breakdown of modern business intelligence architecture and how these pieces fit together. Ultimately, this organized system is what lets a company grow its analytics efforts without creating an unmanageable mess, making it the bedrock of any successful enterprise business intelligence program.
What Makes a Modern Enterprise BI Platform? The Must-Have Features
Picking the right enterprise business intelligence platform isn't just about finding a tool that spits out pretty charts. You're choosing a foundation for your entire data strategy—one that needs to grow with your business, earn trust across every department, and give everyone the power to make smarter decisions, faster.
A true enterprise-grade solution goes far beyond basic reporting. It creates a governed, secure, and intelligent environment where data thrives, even as user demands and data volumes explode. Let's break down the non-negotiable features that separate the real contenders from the pretenders.

Robust Data Governance and Security
Think of data governance as the bedrock of a BI system you can actually trust. It’s the rulebook that ensures your data is accurate, consistent, and used correctly. The best enterprise BI platforms don't just tack on governance features; they build them into the very core of the system.
This translates to having fine-grained control over who sees what. Without it, you’re left with a data free-for-all.
Key governance capabilities to look for:
Centralized Data Modeling: This is about creating a single source of truth. Metrics like "Monthly Recurring Revenue" or "Customer Churn" are defined just once and used consistently everywhere. It’s how you stop different teams from calculating the same KPI in five different ways.
Role-Based Access Controls (RBAC): Admins can set up user roles with specific permissions. A sales rep sees data for their territory, while a C-level executive gets the 30,000-foot view—all from the same system.
Row-Level Security (RLS): This drills down even further, filtering data based on who is looking. A regional manager and a country head can look at the exact same dashboard but will only see numbers relevant to their specific areas.
Scalability and Performance Under Pressure
As your company grows, your data will too—exponentially. A genuine enterprise BI platform has to chew through massive datasets without breaking a sweat. And scalability isn't just about handling more data; it's about maintaining snappy performance when hundreds of users are all hitting the system at once.
A truly scalable system ensures that a query that takes seconds for one user will still take seconds for one hundred users. Performance should not degrade as adoption increases—that's how you keep users engaged and build trust.
Modern platforms pull this off with cloud-native architectures that flex on demand, spinning up resources when needed to avoid bottlenecks. This ensures a smooth, responsive experience, even during the Monday morning rush hour, and is a cornerstone of any serious enterprise business intelligence strategy.
Advanced Analytics with AI and Natural Language
The biggest game-changer in BI today is the infusion of artificial intelligence. These aren't just flashy add-ons anymore; they are essential for making data accessible to everyone in the organization, not just the data science team.
The market reflects this shift. Natural language processing (NLP) is on a trajectory to grow from a USD 3 billion market in 2017 to an estimated USD 43 billion by 2025. This explosion is driven by the need for non-technical users to get answers on their own terms. For any executive demanding reliable, self-serve insights, a platform with strong AI is no longer a "nice-to-have."
Here are the AI-driven features that matter most:
Natural Language Query (NLQ): This lets anyone ask questions in plain English, like "What were our top 5 products by sales in the last quarter?" The system figures out what you mean, runs the query, and gives you an answer in seconds.
Embedded Analytics: The best platforms let you embed dashboards and insights directly into the apps your teams already use, like your CRM or a customer-facing portal. Data becomes part of the workflow, not a separate destination.
Real-Time Data Access: To keep pace with business, modern enterprise BI must provide immediate insights. This is where features like real-time analytics dashboards become critical for agile decision-making.
For a deeper dive into what separates great BI tools from the rest, check out our guide on the 10 essential features of modern business intelligence tools.
How Enterprise BI Drives Growth Across Your Business
An enterprise BI strategy isn't just theory; it delivers real-world results right where you need them most—on the front lines of your business. It turns data from a static asset into an active engine for growth, efficiency, and fresh ideas. When every team is working from the same playbook, they can finally stop arguing about whose numbers are right and start making smart, unified decisions.
This is where you see the true power of a shared data culture kick in. Let's look at how different departments can use a central BI system to tackle their biggest challenges and hit specific, measurable goals.

Driving Product-Led Growth and Retention
For any product team, understanding what users are actually doing is the whole game. Without a single, clear view of the customer journey, they’re essentially flying blind, relying on hunches to build features and keep people engaged.
The Problem: The product team sees a big drop-off in engagement right after onboarding. They think a key feature is being missed or is just clunky to use, but their different analytics tools are telling conflicting stories about the user’s path.
The Enterprise BI Solution: Using a single, governed BI platform, the team pieces together a complete user funnel dashboard. It pulls data from their product analytics tool, the CRM, and customer support tickets into one trustworthy view. Now they can track groups of users from the moment they sign up, through feature adoption, and pinpoint the exact friction points causing them to leave.
The Outcome: The data shows a stark reality: users who engage with "Feature X" within their first week have a 40% higher retention rate after three months. Armed with that concrete insight, the team redesigns the onboarding experience to steer new users directly to that feature. The result is a direct, measurable jump in both user retention and customer lifetime value.
Automating Finance and Elevating Strategy
Finance teams are often stuck in the reporting trenches, burning hours pulling data from countless spreadsheets just to assemble board reports or monthly financials. This manual grind isn't just slow—it's a recipe for costly mistakes.
An enterprise BI system liberates the finance team from the role of "data janitor." It automates the grunt work of report generation, freeing up skilled analysts to focus on what they do best: providing strategic financial guidance to the business.
With a trusted BI platform, finance can plug directly into the company’s core financial systems, ERP, and sales data, creating a single source of truth.
The Problem: Putting together the quarterly board deck takes the FP&A team over a week every single time. They’re manually stitching together data from sales, marketing, and operations, and small inconsistencies often create last-minute fire drills.
The Enterprise BI Solution: The finance team partners with the data team to build a set of automated, interactive financial dashboards. These dashboards pull real-time data from the central data warehouse, ensuring metrics like MRR, CAC, and LTV are always accurate and consistent.
The Outcome: The time it takes to produce board-level reports shrinks from a full week to just a few hours. Better yet, executives now have self-service access to live financial data. They can ask follow-up questions and drill down into trends during meetings, without needing to send analysts scrambling for new reports. The finance team’s role shifts from data collector to forward-looking strategic advisor.
Optimizing Operations and the Supply Chain
For an operations team, efficiency is everything. Even tiny bottlenecks in the supply chain or internal workflows can snowball into major costs and delays, hurting both customer satisfaction and the bottom line.
The Problem: An e-commerce company is bleeding money from rising shipping costs and delivery delays. They have no unified view of inventory levels, warehouse processing times, and carrier performance, making it impossible to find the root cause of the problem.
The Enterprise BI Solution: The operations team uses the enterprise BI platform to build a real-time logistics control tower. This dashboard integrates data from their warehouse management system (WMS), inventory software, and all their shipping carriers into one place.
The Outcome: They immediately spot that one specific warehouse is consistently taking 48 hours longer to process orders than all the others. Drilling down, they discover a faulty piece of equipment and get it fixed. That single insight helps them reduce their average delivery time by 20% and slashes associated overhead costs. To fully grasp how Enterprise Business Intelligence translates into tangible business benefits, explore insights on how leadership leverages BI to transform data into strategic advantage.
Your Roadmap to a Successful BI Implementation
Deploying an enterprise business intelligence solution is a huge undertaking. Let's be honest, it can feel overwhelming. But with a clear, phased roadmap, you can turn a daunting project into a manageable one that actually delivers value. This plan is single-handedly the most important factor in making sure your BI investment pays off instead of becoming expensive shelfware.
Think of this as more than just installing software. It's a fundamental shift in how your business operates. It needs thoughtful planning, clear ownership, and a laser focus on solving real-world problems from the very beginning. Without that, even the most powerful platform is destined to gather dust.
Phase 1: Define Your Strategy and Secure Buy-In
Before you even glance at a vendor website, you need to know what a "win" looks like for your company. This first phase is all about tying the BI project to concrete business goals. Start by asking the tough questions: What specific headaches are we trying to cure? Which decisions are we currently guessing on that need to be backed by data?
Answering these questions keeps the project grounded in reality, preventing it from becoming a purely technical exercise that nobody in sales or marketing cares about.
Here's what to do in this phase:
Find Your Champions: You need executive sponsors and department heads who feel the pain of bad data. These are the people who will advocate for the solution and push for adoption when things get tough. Their support is non-negotiable.
Define Initial Use Cases: Don't try to solve every problem at once. Pick one or two high-impact, achievable goals to start. A great example is creating a single, trusted sales performance dashboard for the entire revenue team, finally putting an end to spreadsheet debates.
Form a BI Governance Council: Get a cross-functional group together from IT, data teams, and key business units. This council will set the rules of the road—defining metrics, ensuring data standards, and maintaining consistency across the board.
Phase 2: Select the Right Platform and Prepare Your Data
Once your strategy is clear, you can start looking at technology. The goal here isn't just to find a platform that solves today's problems, but one that can grow with you. This decision will define your company's analytics capabilities for years, so it's a big one.
At the same time, you have to get your data house in order. Remember, a BI tool is only as good as the data you feed it. Garbage in, garbage out.
Your platform evaluation should cover these key areas:
Scalability and Performance: Can this thing actually handle our data volumes and user growth without grinding to a halt?
Ease of Use: Is the interface intuitive enough for our non-technical folks? Can they explore data and get answers without needing to write SQL?
Governance and Security: Does the platform give us strong, centralized control over who sees what? We need to manage user access and keep our data secure.
AI and Advanced Analytics: Does it have modern features like natural language query that let people just ask questions in plain English? This can dramatically speed up the time it takes to find insights.
A classic mistake is picking the tool before you fully understand the business problem. Always let the "why" (your business goals) drive the "what" (your technology choice). Never the other way around.
Phase 3: Launch a Pilot Program and Iterate
Your pilot program is where the rubber meets the road. It’s your chance to test the solution in a controlled setting and score a quick win. This is where that initial use case you defined earlier comes to life. The entire focus should be on delivering real, tangible value to a small, hand-picked group of users.
Think of this phase as a laboratory for your BI strategy. It's all about learning and refining.
Here’s how to run a successful pilot:
Build the First Dashboards: Sit down with your business champion and the pilot users. Work together to build the specific reports and charts that directly address their problem.
Gather Relentless Feedback: Set up regular check-ins. Ask them constantly: What’s working? What’s confusing? Where are you getting stuck? Be a sponge for feedback.
Iterate and Improve: Take that feedback and immediately use it to refine the dashboards and the data model behind them. This constant loop of feedback and improvement is what builds a tool that people actually use and, more importantly, trust.
Phase 4: Scale Adoption and Foster a Data Culture
Once the pilot is a certified success, it’s time to expand. A successful company-wide rollout hinges on smart training, continuous support, and celebrating your wins. You're not just deploying a tool anymore; you're actively building a data-driven culture.
This final phase is about turning a successful project into the new standard operating procedure for the entire organization.
To scale out effectively, concentrate on these actions:
Develop a Training Program: Don't do generic, one-size-fits-all training. Create role-specific workshops and guides that show people exactly how to use the BI tool to do their specific jobs better.
Share Success Stories: When the pilot team uses data to close a big deal or solve a production issue, shout it from the rooftops! Publicizing these wins builds momentum and shows everyone else what’s possible.
Establish a Center of Excellence: Create a central hub—real or virtual—where users can get help, share what they’ve learned, and request new reports or data sources. This keeps the momentum going long after the initial launch.
Following this roadmap helps you move past a simple tech installation. It sets you on a path toward a true enterprise business intelligence transformation that changes how your business makes decisions.
Enterprise BI Implementation Checklist
To keep things on track, here's a quick checklist summarizing the critical steps for each phase of your enterprise BI rollout. This table helps connect key actions to the metrics that prove you're on the right path, from initial strategy to long-term success.
Phase | Key Action | Success Metric |
|---|---|---|
1. Strategy & Buy-In | Identify business champions and define 1-2 initial use cases. | Executive sponsorship secured; use cases have measurable KPIs. |
2. Platform & Data Prep | Evaluate vendors based on scalability, ease of use, and governance. | Platform selected; data sources identified and cleaned. |
3. Pilot Program | Launch the initial use case with a small, focused user group. | High pilot user engagement; positive feedback collected. |
4. Scale & Culture | Develop role-based training and share success stories company-wide. | Increase in active users month-over-month; documented ROI. |
5. Long-Term Evolution | Establish a Center of Excellence and a backlog for new BI projects. | Consistent user adoption; BI platform influences key decisions. |
Ultimately, this checklist isn't just about ticking boxes. It’s about ensuring that each step you take is deliberate, measurable, and directly contributes to the end goal: making your organization smarter and more competitive through data.
Measuring BI Success and Avoiding Common Pitfalls
Let's be blunt: an expensive, sophisticated enterprise BI platform that gathers digital dust is a spectacular failure. To make sure your investment pays off, you have to look past vanity metrics like dashboard views and get serious about the numbers and stories that actually move the needle. The real test of success isn't the tech itself—it's the tangible impact it has on the business.
When a BI initiative works, you can see it in the results. The global BI market is on track to hit USD 51,809.02 million by 2035, and a big reason for that growth is that companies report making critical decisions up to 5x faster with the right tools. That’s a massive boost to efficiency and the ability to pivot on a dime. You can dig deeper into the business intelligence market's growth to see just how big this trend is.
Defining Your Key Success Metrics
To prove the value of your BI program, you need to track metrics that tie directly to business outcomes. The key is to establish a clear baseline before you roll anything out. Without that starting point, you can't prove how far you've come.
A solid measurement plan mixes the hard numbers with the human element:
Time Saved on Reporting: How many hours are your teams getting back now that they aren't stuck in spreadsheet hell? For departments like finance or operations, this can easily add up to hundreds of hours saved each quarter.
Active User Adoption: Don't just count logins. Track the percentage of your target users who are actively engaging with the platform every week or month. Low adoption is the canary in the coal mine for a failing BI project.
Decision Velocity: Poll your key stakeholders. How much faster can they get the data they need to make a call? This is a direct measure of the platform’s real-world utility.
Evidence of Data-Driven Decisions: Keep a running log of wins. Document specific examples where an insight from the BI tool led to a concrete outcome—a profitable product tweak, a major cost-saving discovery, or a smarter operational shift.
Of course, tracking the financial return is essential. For a more detailed breakdown, check out our guide on measuring the ROI of AI and BI with key metrics.
The ultimate goal is to shift from reactive reporting to proactive decision-making. Success is when leaders start asking forward-looking questions of the data, not just using it to confirm what already happened.
Navigating Common Implementation Traps
Even with the perfect technology, a few classic blunders can completely derail an enterprise BI project. Knowing what these traps look like ahead of time is the best way to steer clear of them.
Keep a close eye out for these all-too-common issues:
Lack of Executive Buy-In: If leadership isn't on board, your project is already in trouble. BI initiatives without consistent C-suite support tend to fizzle out, losing momentum and funding. Make sure executives are not only championing the project but are visibly using the data themselves.
Resistance to Change: People get comfortable with their old ways, especially their trusty spreadsheets. You can't just drop a new tool on them and expect a warm welcome. The trick is to provide role-specific training that shows them exactly how the new platform makes their job easier, not just different.
Poor Data Quality: Your BI platform is only as good as the data you feed it. Garbage in, garbage out is a cliché for a reason. If you pipe in messy, inconsistent, or just plain wrong data, you’ll get untrustworthy insights that will poison user confidence from day one. Tackle data governance head-on, and do it early.
Got Questions About Enterprise BI? We’ve Got Answers.
Diving into the world of enterprise business intelligence can feel overwhelming. Let's break down some of the most common questions leaders ask when they're figuring out their BI strategy.
What's the Difference Between Enterprise BI and a Data Warehouse?
This is a great question. Think of it this way: the data warehouse is your meticulously organized central library, holding all the official, cleaned-up information your company owns. It’s the single source of truth.
Enterprise BI, on the other hand, is the system you use to make sense of everything in that library. It’s the set of tools, dashboards, and reports that helps you find patterns, ask questions, and pull out actionable insights from all that data. You need the warehouse for BI to work, but the warehouse by itself doesn't give you the answers.
How Long Does This Actually Take to Implement?
There’s no single answer here—it really depends on how clean your data is, the size of your company, and how big you want to go out of the gate. A phased rollout is always the smartest move.
You could get a pilot program off the ground for one department or to solve a single, critical business problem in just a few weeks or months. But a full-blown, wall-to-wall implementation across the entire company? That's more of a six-month to one-year (or longer) journey. The good news is that modern, AI-powered platforms can really speed things up by making it easier to connect data sources and letting people ask questions in plain English right away.
Is This Stuff Only for Huge Companies?
Not at all. The "enterprise" name can be misleading. While it was traditionally built for massive corporations, the core ideas—good data governance, a central source of truth, and analytics that can grow with you—are crucial for any business that wants to scale.
Startups and small businesses can absolutely adopt a "right-sized" version of enterprise BI. This just means setting up a solid data foundation, picking a scalable cloud tool, and agreeing on your most important metrics early on.
Doing this from the start saves you from the data chaos that trips up so many growing companies. It builds the right habits for making smart, data-driven decisions from the beginning, which is a massive competitive advantage.
Ready to unlock insights without the technical overhead? With Querio, every team can ask questions in plain English and get trusted answers in seconds. Explore Querio's AI-powered platform today!

