Analytics in Finance Industry - analytics in finance industry insights
Discover how analytics in finance industry drives decision-making and growth. Explore practical strategies, real-world use cases, and AI tools.
https://www.youtube.com/watch?v=E4NSAQ-Z7II
published
Outrank AI
analytics in finance industry, financial analytics, ai in finance, finance bi tools, fp&a
d22f733a-5a98-4679-9b13-b07df7882180

In the finance industry, analytics is the art and science of turning raw financial data into clear, actionable intelligence. It's about moving your organization from simply reacting to past events to proactively shaping its future. This is no longer a niche tool for quants; it's a core capability for any modern finance team, driving everything from day-to-day operations to long-term strategic planning.
Why Analytics Is the New Financial Command Center

Think about the old way of doing things: your finance team is buried in spreadsheets, manually stitching together data for a last-minute board meeting. Now, imagine a different world—one where complex questions about profitability, risk, or cash flow get instant, reliable answers. That’s the real impact of modern financial analytics. It serves as a central nervous system, giving you a clear, live view of your company's health and the market forces shaping it.
This move away from manual, error-prone spreadsheets to automated, insightful analysis isn't just a "nice-to-have." It’s essential for survival. Today’s economic climate is turbulent, and companies are swamped with data. Making critical decisions based on gut feelings or stale reports is like trying to navigate a storm with a compass that only points backward.
The Driving Force Behind Adoption
The numbers tell the story. The financial analytics market, valued at USD 9.68 billion, shot up to USD 10.70 billion and is on track to hit USD 22.64 billion by 2032. That’s a compound annual growth rate (CAGR) of 11.3%, a clear signal that firms are investing heavily to stay ahead of the curve.
So, what’s behind this push? Financial analytics gives teams the tools to handle immense complexity and gain a real advantage. It helps them:
Make Better Decisions: Swap guesswork for data-backed strategies on everything from investment portfolios to operational budgets.
See Risks Before They Happen: Proactively spot potential threats—like market volatility or fraudulent transactions—before they cause serious damage.
Work Smarter, Not Harder: Automate the drudgery of reporting and manual analysis, freeing up your team to focus on what really matters: strategy.
Create Personalized Customer Experiences: Truly understand client behavior to offer the right products at the right time, boosting loyalty and lifetime value.
Financial analytics isn't just about making pretty charts. It’s about asking better questions and getting trustworthy answers faster than your competition. It finally allows teams to draw a straight line from business activities to financial outcomes.
From Data Scientists to Every Decision-Maker
Not long ago, deep data analysis was a walled garden, accessible only to people who could write complex code. That's changing fast, thanks to the new wave of AI-powered business intelligence platforms. These tools are democratizing data, putting powerful analytics into the hands of everyone on the finance team, not just the data scientists.
The ability to ask a question in plain English and get an immediate, visualized answer is a game-changer. It breaks down the barriers that have kept valuable insights locked away in data silos. For a deeper look into this topic, explore how businesses are gaining a competitive edge with modern BI solutions.
This guide will take you through the essentials of analytics in the finance industry, starting with the fundamental types of analysis and moving all the way to advanced, AI-driven applications.
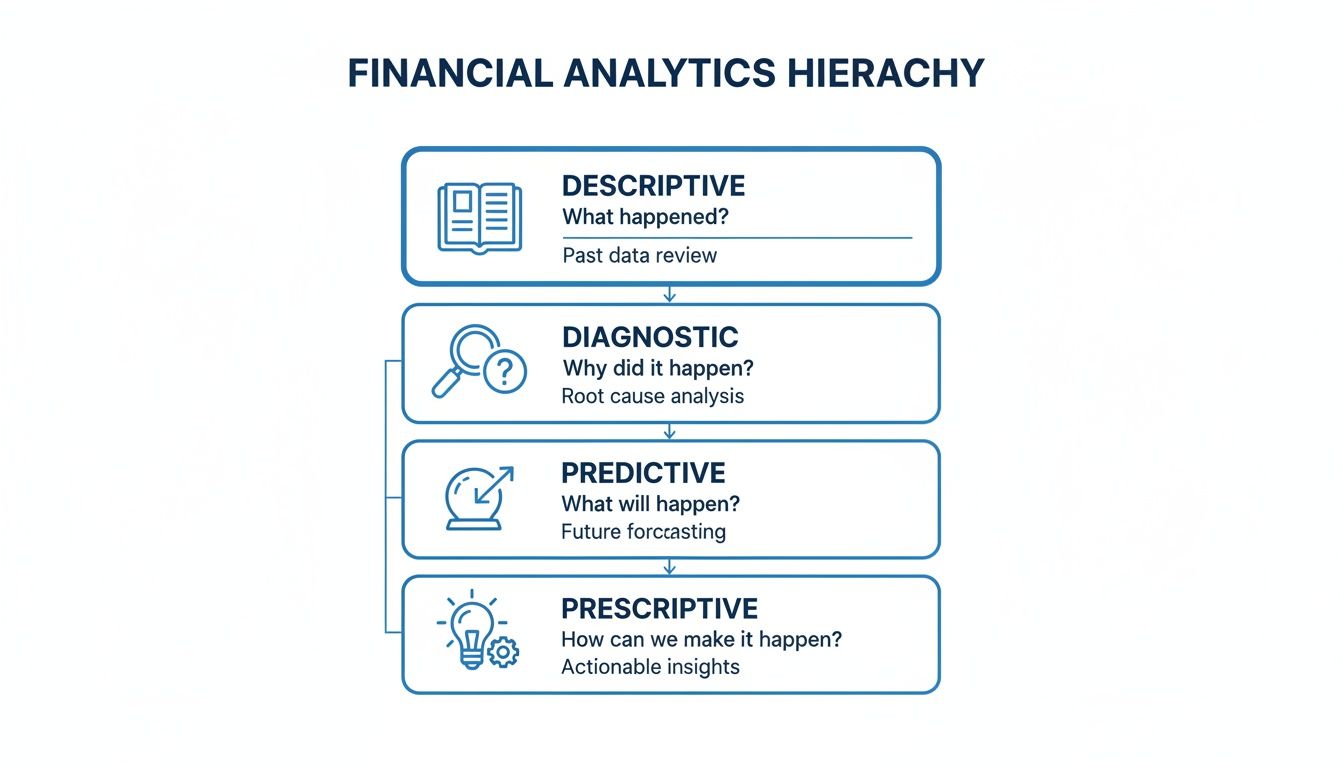
Understanding the Four Levels of Financial Analytics
To really get a handle on financial analytics, it helps to think of it in four distinct stages. Imagine you're navigating a ship: you start by looking at where you've been, then figure out why you ended up there, predict where you're headed, and finally, decide the best way to get to your destination.
This framework isn't just academic—it's a practical way to move from simply looking at numbers to making strategic decisions. Each level builds on the one before it, giving you a progressively clearer and more powerful view of your company's financial story.
Descriptive Analytics: What Happened?
This is square one. Descriptive analytics is all about looking in the rearview mirror to understand what has already occurred. It answers the fundamental question, "What happened?" by summarizing past data into easy-to-understand reports, charts, and dashboards.
For a finance team, this is the bread and butter of reporting—tracking key metrics to get a clear picture of business performance. It’s your financial logbook.
Example: A CFO looks at the Q2 P&L statement and sees that revenue hit $5.2 million, a 15% increase over Q1. That number is a simple, factual summary delivered by descriptive analytics.
Diagnostic Analytics: Why Did It Happen?
Once you know what happened, the natural next question is why. This is where diagnostic analytics comes in. You’re no longer just reading the logbook; you’re investigating the reasons behind the results. This means digging deeper, drilling down into the data, and finding the root causes behind the trends.
This is the shift from reporting to genuine analysis. It’s about connecting the dots. Why did revenue jump by 15%?
By pulling in marketing and sales data, the team might discover that the revenue spike wasn't a market-wide trend. Instead, it was directly tied to a new digital ad campaign that brought in a flood of high-quality leads. That’s a crucial insight for deciding where to put the marketing budget next quarter.
Predictive Analytics: What Will Happen Next?
With a solid grasp of the past and the "why" behind it, you can start looking forward. Predictive analytics uses historical data, combined with statistical models and machine learning, to forecast what’s likely to happen in the future. Now, the ship’s navigator is looking at weather patterns and sea charts to plot the journey ahead.
This is where analytics starts to feel like a strategic superpower. It helps you anticipate market shifts, get ahead of potential risks, and spot opportunities before your competitors do. For a deeper dive into how these stages connect, check out our guide on descriptive, predictive, and prescriptive analytics.
Example: A bank’s model analyzes years of loan data and current economic indicators to predict a 3% rise in loan defaults over the next six months. This gives them time to tighten lending standards before losses mount.
Prescriptive Analytics: What Should We Do?
This is the final, most sophisticated level. Prescriptive analytics doesn't just tell you what might happen; it recommends the best course of action to achieve a specific goal. It answers the ultimate question: "What should we do about it?" Our navigator isn't just warning about a storm—they're recommending a new route to avoid it and still arrive on time.
Prescriptive analytics pulls together insights from all the other stages and uses optimization models to provide clear, data-driven recommendations. It turns analysis into actionable advice, empowering leaders to make tough calls with confidence. It’s the difference between reporting on the business and actively driving its strategy.
For instance, a prescriptive model could assess thousands of investment scenarios to recommend the perfect asset mix that maximizes returns while staying within a company's stated risk tolerance.
To bring it all together, here’s a quick overview of how these four types of analytics function in a financial context.
The Four Types of Financial Analytics Explained
Analytics Type | Core Question | Finance Example | Business Value |
|---|---|---|---|
Descriptive | What happened? | Generating a monthly cash flow statement showing a net outflow. | Provides a clear, historical baseline of financial performance. |
Diagnostic | Why did it happen? | Drilling down to find the cash outflow was caused by a large, one-time capital expenditure. | Explains anomalies and identifies root causes for better context. |
Predictive | What will happen? | Forecasting that, without changes, cash reserves will drop below the safety threshold in 3 months. | Enables proactive planning and risk mitigation. |
Prescriptive | What should we do? | Recommending delaying a non-essential project to stabilize cash flow. | Delivers clear, data-driven actions to optimize outcomes. |
Each level provides a deeper layer of insight, transforming data from a simple record of the past into a powerful guide for the future.
How Analytics Drives Financial Performance
Theory is one thing, but the real power of analytics in the finance industry comes alive when you apply it to real-world challenges. When we move past the concepts, we can see how analytics turns core financial functions from reactive, manual chores into proactive, strategic drivers of business growth.
Think of it like this: it's the difference between navigating with an old paper map and using a live GPS with real-time traffic updates.
The biggest impact comes from automating tedious work, slashing human error, and giving leaders a crystal-clear view of what’s actually driving performance. Let’s look at the "before and after" in a few key areas to see what this transformation really looks like.
This progression from basic reporting to advanced, strategic advice is the exact journey analytics makes possible for finance teams.
Revamping Financial Planning and Analysis
Traditionally, Financial Planning & Analysis (FP&A) has been a grueling, spreadsheet-heavy slog.
Before Analytics: An FP&A team might spend weeks just pulling data from different systems into massive, interconnected Excel files. They wrestle with broken formulas and version control nightmares simply to produce a static monthly variance report. Scenario planning is so time-consuming it’s often just a simple "best, worst, and base" case—offering very little strategic value.
After Analytics: With an integrated analytics platform, the whole process gets automated. Data streams in from ERPs and CRMs in real-time. Variance analysis is always on, available on a live dashboard, letting the team dig into deviations with a few clicks instead of spending days just reconciling numbers.
The real game-changer is dynamic scenario modeling. The team can instantly model the P&L impact of changing dozens of variables, like a 10% jump in material costs or a 5% drop in customer retention. This provides immediate, strategic guidance to leadership when they need it most.
This shift frees the FP&A team from being number-crunchers and turns them into strategic partners who can answer critical "what-if" questions on the fly.
Sharpening Forecasting and Predictions
An accurate forecast is the bedrock of any sound financial plan, but old-school methods were often little more than educated guesses based on what happened last year.
Before Analytics: A finance manager builds the annual sales forecast by taking last year's numbers and tacking on a flat 5% growth assumption. This overly simple approach completely ignores things like seasonality, market shifts, or internal business changes. The result? Frequent inventory screw-ups and missed revenue targets.
After Analytics: Now, the team uses predictive analytics models that chew through years of historical sales data plus external factors like economic indicators, competitor moves, and even social media sentiment. The model uncovers complex patterns and spits out a highly accurate, granular forecast broken down by product, region, and sales channel. This means optimized inventory, better resource allocation, and much more reliable revenue planning.
Fortifying Risk Management and Fraud Detection
In finance, managing risk is everything. Yet, legacy systems just can't keep up with today's evolving threats. It’s no surprise that the need for better tools is a primary driver of market growth.
In fact, Technavio projects the financial analytics market will grow by USD 9.09 billion at a 12.7% CAGR, largely because companies need more advanced risk analytics. After the 2008 crisis, for example, new regulations in the U.S. led to a 40% spike in analytics adoption as firms like JPMorgan Chase used predictive modeling to sidestep huge losses during market shocks. You can dig deeper into this trend in Technavio's market analysis.
So, how does this play out in practice?
Before Analytics: Fraud detection often relies on simple, rule-based systems that flag transactions based on rigid criteria (e.g., any transaction over $10,000). These systems create a ton of false positives, drowning analysts in alerts while sophisticated fraudsters easily find ways around the rules.
After Analytics: Machine learning algorithms now scan millions of transactions in real-time. They’re trained to spot subtle anomalies and weird patterns that a rules-based system would never catch. Better yet, the system learns and adapts to new fraud tactics on its own, which dramatically boosts accuracy and cuts down on false alarms. It’s a proactive defense that protects assets and keeps customer trust intact.
Optimizing Treasury and Cash Management
Good treasury management is about making sure you have the right amount of cash, in the right place, at the right time. When you’re doing it manually, this is a constant headache.
Before Analytics: The treasury team spends their mornings manually pulling bank statements from multiple accounts into a spreadsheet just to get a daily cash position. The process is slow, prone to errors, and gives them a view of their liquidity that’s already out of date. Forecasting cash flow is a massive, periodic effort.
After Analytics: An analytics platform gives them a real-time, consolidated view of cash across every bank account and currency. Predictive models automatically generate rolling cash flow forecasts, flagging potential shortfalls or surpluses weeks in advance. This allows the team to make smart, proactive decisions on investments, debt repayment, and working capital, turning the treasury function into a genuine strategic asset.
Building Your Financial Analytics Framework
Putting together a solid analytics strategy is a lot like building a house. If you don't pour a solid foundation, it doesn't matter how fancy the finishes are—the whole structure will eventually fail. A proper framework is what makes your analytics efforts sustainable, secure, and genuinely valuable to the entire organization.
The goal is to move your finance function away from a patchwork of disconnected spreadsheets and into a unified system. You're building a single source of truth that everyone from the CFO to the junior analyst can rely on. This blueprint stands on four essential pillars.
Establish Your Data Sources and Connections
First things first: you have to get your data in order. The insights you generate are only as good as the raw information they come from. That means tearing down the walls between your data silos and creating clean, reliable pipelines from all your critical systems.
Think of your ERPs, CRMs, and billing software as separate rivers. A good analytics framework builds the channels needed to guide all that water into one clean reservoir.
Modern BI platforms make this much easier by providing pre-built connectors that plug directly into these systems. This gets rid of the soul-crushing, error-prone task of manually exporting CSVs and trying to stitch everything together—often the single biggest time-sink for finance teams.
Prioritize Data Governance and Security
Once your data is flowing, you absolutely have to protect it. Data governance sets the rules for who can access, manage, and use information, while security is what enforces those rules. In the heavily regulated world of finance, this isn’t just an IT problem; it's a fundamental business requirement.
The financial analytics market is already valued at USD 12.57 billion and is projected to hit USD 29.65 billion by 2033, largely because of the push from AI and cloud tech. But this growth isn't just about finding efficiencies; it's driven by immense regulatory pressure. With over 5,000 new financial regulations popping up worldwide each year, analytics platforms that can automate up to 80% of compliance reporting are becoming indispensable.
As data volumes explode, platforms with security certifications like SOC 2 Type II and features like row-level security are non-negotiable.
A strong governance model answers the tough questions: Who gets to see sensitive salary data? Who is authorized to view customer PII? How do we ensure the data stays accurate? Nailing down these protocols early on prevents costly breaches and builds trust in your numbers.
Choose the Right Technology Stack
With your data connected and secured, it's time to pick your tools. Your technology stack is the engine that actually turns all that raw data into something you can use. To really get a handle on things, implementing specialized tools like treasury management systems can centralize and sharpen your financial operations.
A modern tech stack usually includes a few key pieces:
A Cloud Data Warehouse: This is your central hub for storing and managing all your structured data (think Snowflake or BigQuery).
A BI and Analytics Platform: This is the tool (like Querio) that sits on top of your data warehouse, giving users a way to explore, visualize, and make sense of the data.
A Semantic Layer: This is the secret sauce. It translates complex database jargon into plain business terms, so non-technical users can ask questions without needing to know code. You can learn more about this in our article on what is a semantic layer.
Lead Effective Change Management
The last pillar is the most important one: the people. You can build the most sophisticated analytics framework on the planet, but it's completely worthless if your team doesn't use it. Change management is the art of guiding your team from the old way of doing things to the new, data-driven culture you want to build.
This means communicating the "why" behind the change, providing great training, and celebrating small victories along the way. A great tactic is to find a specific, high-visibility pain point—like a weekly report that everyone hates building manually—and deliver a quick win. Success like that builds momentum and shows people the real, tangible value of the new system, which is the best way to get everyone on board.
Unlocking Insights Faster with AI

Having a solid analytics framework is the essential foundation, but Artificial Intelligence (AI) is the accelerator. It’s what truly changes the game for finance teams. Traditional dashboards and BI tools were a huge leap forward from endless spreadsheets, but they still had a major limitation: you had to manually slice, dice, and filter data to hunt for answers.
This created a serious bottleneck. Only a handful of trained analysts could dig deep into the data, leaving everyone else waiting in line for reports.
AI-powered analytics platforms completely shatter this old model. Their secret sauce is natural language querying, which lets anyone on the team ask questions in plain English and get an immediate, accurate answer. It’s the difference between needing to be a data expert and simply being an expert in your own job.
The Power of Conversational Analytics
Imagine a world where you don't need to write a single line of code or build a complicated report to get the information you need. That's the reality with modern AI.
A marketing manager can just ask, "What was our customer acquisition cost by channel last quarter?" and get a clear chart on the spot. An operations leader can type, "Which product line had the highest return rate in Q2?" and have a direct answer in seconds.
This conversational approach removes the friction and makes data accessible to everyone. It turns what used to be a week-long technical project into a two-minute conversation. This fosters a culture where curiosity is rewarded with instant clarity, not with a ticket in a long queue.
It’s no surprise that a recent Deloitte report found that 97% of financial services firms are actively investing in big data and AI. This isn't just a trend; it's a massive industry shift. For a practical look at getting started, this guide on how to implement AI in business is a great resource.
Beyond Buzzwords: Grounded AI in Finance
Let's be clear: not all AI is created equal. The most effective platforms don't just understand language; they understand your business. A powerful AI agent learns the ins and outs of your specific data model, your key metrics, and your internal business logic.
This contextual understanding is what makes the insights it generates both grounded and reliable. When you ask about "monthly recurring revenue," the AI knows exactly which database table, columns, and calculations define that metric for your company.
This built-in expertise prevents the "hallucinations" or generic answers you might get from general-purpose AI models. You can actually trust the numbers you see. To learn more about the mechanics behind this, check out our guide on how AI query tools improve financial accuracy.
Real-World Example: An FP&A Analyst's Workflow
An FP&A analyst notices that revenue for the European division is 8% below forecast. In the old days, this would kick off a multi-day fire drill—exporting data, emailing regional managers, and manually piecing together variance reports.
With an AI-powered platform, the workflow looks completely different:
Initial Query: They start by asking, "Why was our European revenue below forecast last month?"
Instant Drill-Down: The AI immediately returns a chart showing the variance is concentrated in Germany. The analyst follows up: "Break down the German revenue variance by product."
Root Cause: The AI reveals that a single high-margin product saw a steep 40% drop in sales.
In less than five minutes, the analyst has gone from a high-level problem to a specific, actionable root cause. They can now go to the European sales team with a precise insight, turning a week of reactive data pulling into a proactive, strategic conversation.
Building a Future-Ready Finance Team
It’s become crystal clear that the journey from manual spreadsheets to intelligent insights isn't just an upgrade—it's a fundamental requirement for survival and growth. Sticking with slow, manual processes is like navigating with a paper map in the age of real-time GPS. The destination, profitability and growth, hasn't changed, but the tools you use will decide whether you get there first, or if you get there at all.
A future-ready finance team is quick on its feet, thinks strategically, and is fueled by data. They spend less time hunting down numbers and more time advising the rest of the business on what those numbers actually mean. This evolution depends on tearing down the data silos and reporting bottlenecks that have plagued finance departments for decades.
From Gatekeepers to Strategic Partners
So, how do you make this happen? The answer lies in modern, self-serve analytics platforms. These tools give powerful data capabilities directly to the people who need them most, cutting out the long, frustrating waits for custom reports from a central IT or BI team.
When anyone on your team can ask a tough question and get a reliable answer in seconds, you start to build a culture of proactive, data-informed decisions.
The real goal here is to liberate your best financial minds from the soul-crushing work of data prep. Their time is far too valuable to be spent wrestling with VLOOKUPs; it should be focused on the high-impact strategic work that actually drives the business forward.
This shift turns your team from number crunchers into genuine strategic partners. They can finally tackle the critical "what-if" scenarios that guide growth, manage risk effectively, and find new ways to optimize performance across the entire organization.
The path forward is clear. By embracing AI-powered analytics, financial leaders can build a department that doesn't just report on what happened yesterday but actively shapes what happens tomorrow. It's time to give your team the tools they need to stop reacting and start leading.
Common Questions About Financial Analytics
Stepping into financial analytics for the first time usually sparks a few questions. If you're a leader in finance or operations, you're probably wondering how this all works in the real world and what it takes to move away from the spreadsheets you know so well. Let's tackle some of the most common queries.
How Is Financial Analytics Different from Standard Business Intelligence?
Think of it this way: standard Business Intelligence (BI) is like looking in the rearview mirror. It’s excellent at telling you what happened—reporting on historical data. Financial analytics, on the other hand, gives you the rearview mirror, the GPS, and a look at the engine's diagnostics all at once.
It doesn’t just answer "what happened?" but also digs into "why did it happen?" and "what should we do next?". In practice, you stop waiting for static monthly reports and start working with dynamic, live models. Instead of just reviewing last quarter's numbers, you can run "what-if" scenarios on future cash flow, get alerts about potential risks before they become problems, and receive clear, data-driven recommendations to sharpen your financial strategy.
Do I Need to Hire a Team of Data Scientists?
Not anymore. While there's still a place for data scientists working on highly specialized, custom algorithms, the new generation of AI-powered analytics platforms is built for the business user. Finance and operations pros can now ask complex questions using plain English, thanks to natural language query tools, and get immediate answers without writing a line of code.
This is a huge shift. It puts powerful tools directly into the hands of the people who understand the business context best. Your team can explore their own questions and find answers on their own, which frees up your technical folks to focus on the bigger picture.
The real game-changer is that financial expertise, not coding ability, becomes the main skill needed to get value from your data. Your team already knows the right questions to ask; now they finally have a way to answer them.
What’s the Best First Step to Move from Excel to an Analytics Platform?
The key is to start small and score a quick, meaningful win. Don't try to boil the ocean. Instead, pick a single, high-visibility pain point that eats up a lot of time and is strategically important. A great example would be automating a weekly sales performance report or building a more flexible cash flow forecast.
Focus on connecting just one clean data source to a modern analytics platform for that specific task. This approach lets you prove the platform's value almost immediately. A successful pilot project builds incredible momentum, gets your team comfortable with a new way of working, and makes a strong case for expanding its use across the company.
How Does Financial Analytics Help My Product Team?
Financial analytics provides the missing link between what’s happening in your product and what it means for the bottom line. It allows product managers to track metrics that really matter, like Customer Lifetime Value (CLV) and Customer Acquisition Cost (CAC), and see how they change based on which features people are using.
By directly connecting product engagement data with financial results, product teams can confidently prioritize features that actually drive revenue. They can identify their most profitable customer segments and build a rock-solid, data-backed roadmap. It ensures everyone is pulling in the same direction, tying product development directly to the company's financial health.
Ready to move beyond spreadsheets and empower your team with instant, reliable insights? With Querio, every team can ask questions in plain English and get accurate answers in seconds, turning curiosity into confident decisions. Learn more about Querio and transform your financial analytics today.

