Define Ad Hoc Report Your Guide to Instant Business Insights
Need to define ad hoc report? Learn what it is, how it works, and why it's essential for making smarter, faster business decisions with on-demand data.
published
Outrank AI
define ad hoc report, ad hoc analysis, business intelligence, self-service reporting, bi tools
5bd16e09-314f-413d-bb84-1c4b2c63b0a8

An ad hoc report is a one-time report built to answer a specific, urgent business question. Think of it as your company's data hotline; instead of waiting for the regular weekly update, you pull a report right now to figure out why a particular trend just emerged or to tackle a problem that can't wait.
This kind of responsive reporting isn't just a nice-to-have anymore—it's a fundamental part of staying agile and competitive.
Unpacking the Ad Hoc Report

The term "ad hoc" is Latin for "for this," which perfectly sums up what these reports are all about. They are created for one specific purpose, right here and now.
If your standard, scheduled reports are like the daily weather forecast—giving you a reliable overview over time—then an ad hoc report is what you generate when you look outside, see dark clouds, and need to know, "Is it going to rain in the next hour?"
This on-demand capability allows teams to stop being passive data observers and become active investigators. A marketing manager can spin up a report to understand why a social media campaign suddenly tanked. An operations lead can pull one to find the root cause of an unexpected supply chain delay.
The Shift to Self-Service Analytics
The growing reliance on ad hoc reporting signals a huge move away from the old way of doing things. It used to be that getting a new report meant filing a ticket with the IT or data team and then waiting... sometimes for days, or even weeks. That kind of delay kills curiosity and brings decision-making to a screeching halt.
Modern BI tools have completely changed the game, putting the power to create reports directly into the hands of the people who need the answers. Ad hoc reporting has become an essential business intelligence tool, enabling anyone to address immediate questions on their own. In fact, studies show that around 85% of large companies now have some form of ad hoc reporting in place.
Key Takeaway: The goal is to get from a specific business question to a useful, actionable insight as fast as possible, without getting stuck in the queue of traditional reporting cycles.
This speed helps businesses react and adapt in real time. When something strange pops up in the data, teams can dig into the "why" right away, turning a potential crisis into a valuable lesson. This process of spontaneous investigation is the heart of giving you a much deeper, more contextual feel for what’s happening in your business.
By giving everyone the ability to explore data, you build a culture of curiosity where every employee is empowered to find answers and make smarter decisions, faster.
To quickly summarize, here's a look at the defining characteristics of an ad hoc report.
Key Characteristics of Ad Hoc Reports
Characteristic | Description |
|---|---|
On-Demand | Created as needed, not on a fixed schedule. |
Specific Purpose | Designed to answer a single, targeted business question. |
User-Driven | Typically created by the business user who needs the insight. |
Short Lifespan | Intended for immediate use and rarely referenced again. |
Highly Focused | Drills down into a narrow dataset to find a specific answer. |
These traits are what make ad hoc reports so powerful for nimble, data-informed organizations.
Ad Hoc vs. Scheduled Reports: What's the Difference?
To really get a feel for ad hoc reporting, it helps to put it side-by-side with its more traditional cousin, the scheduled report. Both are critical for understanding a business, but they serve completely different needs and operate on different timelines. It’s like comparing your planned weekly grocery run to a frantic, last-minute dash to the store because you forgot the main ingredient for dinner.
Scheduled reports are the steady, reliable drumbeat of your business operations. Think of the monthly sales summaries, quarterly financial statements, and daily performance dashboards that show up in your inbox like clockwork. Their job is all about consistency and oversight, giving everyone a standardized look at key performance indicators (KPIs) over a set period.
Ad hoc reports, on the other hand, are your go-to for tackling the unexpected. You build them to investigate a specific, often urgent, question that your regular reports don't cover. When you see a sudden nosedive in website traffic or a mysterious spike in customer churn, you can't afford to wait for next month's summary to figure out what’s going on.
Purpose and Timing: The Core Distinction
At its heart, the difference is about being proactive versus reactive.
Scheduled Reports (Proactive): These are built to monitor the known health of the business. They track established metrics, helping everyone keep a finger on the pulse of performance and measure progress against goals. They answer the question, "Are we on track?"
Ad hoc Reports (Reactive): These are created to investigate the unknown. They're your primary tool for digging into the "why" behind an issue, letting you explore unexpected events, test a new theory, or see if a gut feeling is backed by data. They answer the question, "Why did this just happen?"
Unlike static reports that stick to a rigid schedule and format, ad hoc reports deliver quick answers, letting users make sense of data in the moment. This flexibility is what allows teams to stop just observing and start actively solving problems.
Who Creates It, and How Long Does It Live?
Another big difference is who builds the report and how long it stays useful. Scheduled reports are usually designed and automated by specialized data teams or IT departments. They’re built to be used over and over by a wide audience. While ad hoc reports are all about on-demand insights, it’s still helpful to know how automation works. For anyone curious about the nuts and bolts, here's a practical guide to automating Excel reports.
In contrast, an ad hoc report is typically whipped up by the business user who actually has the question—a marketer, a product manager, or a sales leader.
Key Insight: The person closest to the problem is empowered to find the solution. This direct access to data dramatically shortens the time from question to action.
Because they’re built for a single, specific purpose, ad hoc reports have a very short lifespan. Once the question is answered and a decision is made, the report has done its job. It’s rarely needed again. This "disposable" quality helps keep your analytics environment clean and focused, preventing the clutter of outdated and irrelevant reports from piling up.
How Ad Hoc Reporting Solves Real Business Problems
Theory is one thing, but the real magic of ad hoc reporting happens when you see it solve tangible, everyday business problems. It’s the tool that turns a sudden question from the boss into a data-backed strategy, right when you need it. Let's dig into how different teams use it to make smarter, faster decisions.

Picture this: a marketing lead notices a recent campaign is blowing all expectations out of the water. Instead of just celebrating the win, they ask the crucial question: "Why is this specific campaign so successful?"
A quick, on-demand report is the perfect tool for the job. By pulling data on audience demographics, ad creative, and timing, they might discover a new ad design is really connecting with a younger demographic they hadn't reached before. That insight is pure gold. It allows them to immediately shift budget to double down on what’s working—a decision they couldn't have made if they'd waited for the standard end-of-month report.
From Sales Slumps to Supply Chain Solutions
The value of digging into data on the fly extends far beyond marketing. Think about these common scenarios where immediate answers provide a clear path forward:
Sales Stagnation: A sales manager sees that a top-selling product has suddenly stalled in the Northeast. An ad hoc report could quickly cross-reference sales data with regional logistics, revealing a recent shipping delay is causing stockouts. The problem isn't a drop in demand—it's a lack of availability.
Operational Bottlenecks: An operations team is dealing with an unexpected slowdown on the production floor. By generating a report that analyzes machine uptime, shift performance, and raw material intake, they can pinpoint the exact stage in the assembly line causing the jam.
These one-off reports are built for a single purpose, like figuring out how many support tickets were resolved last week or tracking daily calls made by a salesperson. This laser-focused approach is what makes them so effective, and you can see more examples of how organizations use them in this great overview from OWOX BI.
The core function of an ad hoc report is to bridge the gap between a sudden business curiosity and a clear, actionable answer. It replaces guesswork with evidence, right when it's needed most.
Finding the Root Cause
At the end of the day, every ad hoc report is a mini-investigation. It starts with a pressing question and uses data to tell the story behind the numbers. In each case, the team didn't need another comprehensive, recurring dashboard; they needed a specific, targeted answer to solve a problem that was happening right now.
This ability to quickly define the ad hoc report needed for any situation is what empowers teams to be proactive and agile. Instead of waiting for data to be served to them, they can go out and find the insights that drive the business forward, turning unexpected challenges into opportunities for real growth.
The Strategic Advantages of On-Demand Analysis
Adopting ad hoc reporting is more than just a nice-to-have; it's a strategic move that brings speed and intelligence right into your team's daily workflow. The most obvious win? A massive boost in decision-making speed.
Instead of getting stuck in a queue waiting for the analytics team, business users can get their own answers in minutes, not days. This agility means you can jump on opportunities or tackle problems before they snowball. In fact, some organizations have seen their decision-making cycles shorten by as much as 70% after getting ad hoc reporting right.
Fostering a Data-Driven Culture
Something powerful happens when you give people the tools to answer their own questions: curiosity takes over. Data stops being a mysterious resource locked away in a database and becomes the common language for solving problems. This is the very heart of self serve BI which enables users to access and analyze data without needing deep technical expertise. This approach empowers individuals across an organization to make informed decisions using data insights, promoting data-driven strategies and efficiency.
, where anyone on the team is empowered to make smarter choices.
To get the most out of this, a business has to commit to embracing data-driven decision-making and turning raw numbers into a real competitive edge. The benefits here are twofold:
Reduced IT Bottlenecks: This approach frees up your data analysts and IT pros from the endless grind of small, one-off report requests. They can finally shift their focus to bigger, more strategic projects like building better data models or improving infrastructure.
Deeper, Contextual Insights: The person closest to a business problem is usually the one who knows which questions to ask. A marketing manager digging into a weird campaign spike has way more context than a data analyst ever could, which almost always leads to better, more actionable insights.
Uncovering Hidden Opportunities
Standard, scheduled reports are great for what they do—monitoring known metrics and keeping an eye on established goals. They tell you if you're on track. But they rarely show you something completely new.
An ad hoc report is like a flashlight in a dark room. It lets you follow a hunch, dig into an unexpected outlier, and connect dots that no one had even thought to look for.
This kind of free-form exploration is how you find the gold. You might stumble upon a hidden customer segment, an operational bottleneck that's been quietly costing you money, or an emerging market trend just waiting to be captured. By enabling this kind of proactive digging, you shift from simply monitoring the business to actively discovering new ways to grow.
A Practical Framework for Effective Ad Hoc Reporting
Giving everyone access to data without a clear playbook is a recipe for chaos. To really get the most out of on-the-fly analysis, you need a simple but solid framework. This is what ensures every ad hoc report is not just fast, but also accurate, insightful, and trustworthy.
The goal here is to shift from just reacting to data requests to proactively structuring your investigations. If you follow a few key best practices, anyone can create an ad hoc report that sparks confident, data-backed decisions instead of costly mistakes built on misinterpreted info.
Start With a Crystal-Clear Question
Honestly, the most important step happens before you even touch a single piece of data. You absolutely have to define the specific question you're trying to answer. A fuzzy goal like "look into last month's sales" will get you lost in a sea of spreadsheets.
Instead, you need to frame a precise, targeted question. Think about the difference:
Vague: "How did our new feature do?"
Precise: "Which customer segments had the highest adoption rate of our new filtering feature in the first 30 days after launch?"
Getting this level of clarity acts as a compass for your entire analysis. It keeps you on track, guides every step you take, and stops you from getting distracted by metrics that don't matter. This is how you define the ad hoc report's scope right from the get-go.
Select Relevant Data and Keep It Simple
Once you've locked in your question, it's time to figure out which data sources you need. Fight the urge to pull in every dataset you can get your hands on. More data doesn't automatically mean better insights; often, it just adds noise and confusion. Stick only to the information that directly helps answer your question.
After you have your data, keep the analysis simple. The objective is to find a clear answer, not to build some ridiculously complex, multi-layered dashboard. Use straightforward calculations and steer clear of convoluted formulas that could introduce errors or make the results impossible for anyone to understand.
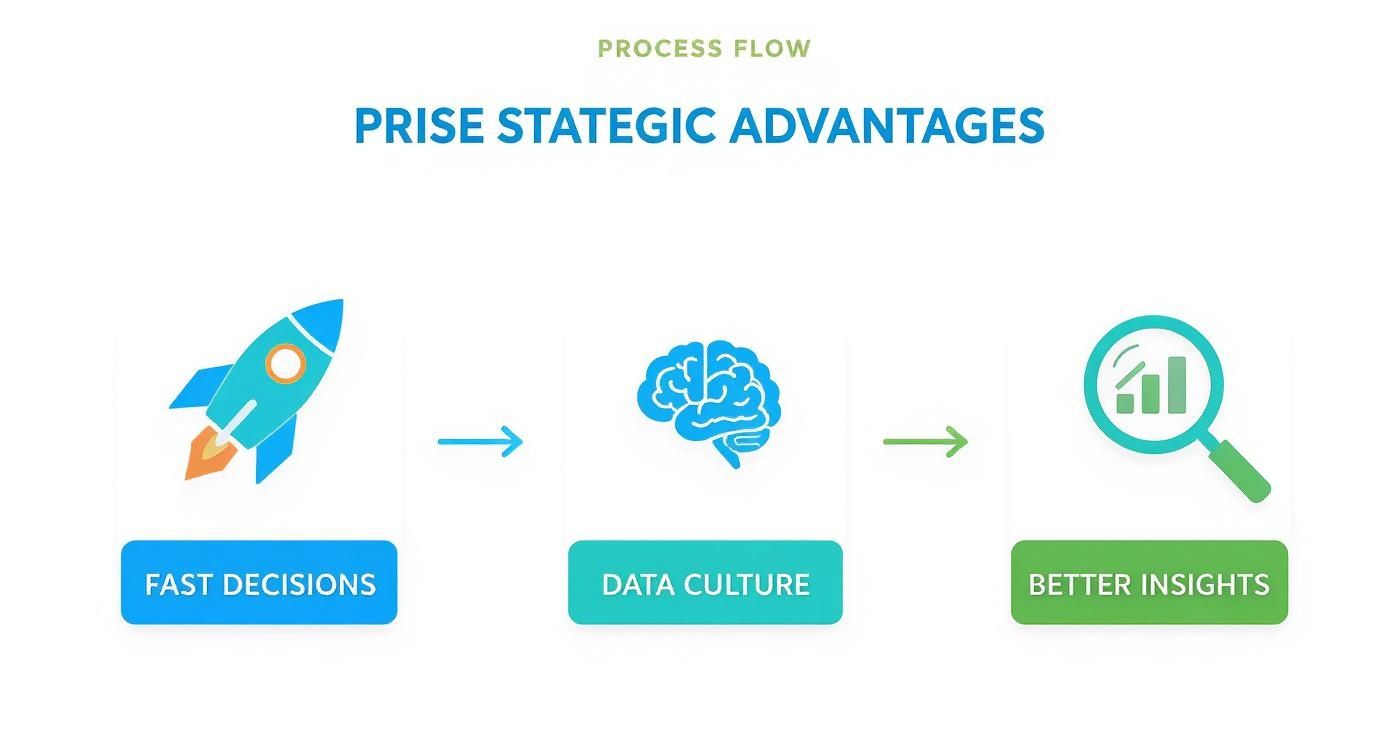
As you can see, this process of on-demand analysis directly fuels faster decisions, helps build a stronger data culture, and ultimately leads to much better business insights.
Visualize to Tell a Story
Finally, remember that how you present your findings is just as important as the analysis itself. Nobody wants to decipher a raw spreadsheet packed with numbers. Simple, clean visuals are the secret to telling a compelling story with your data.
A well-chosen chart can communicate a complex trend in seconds. For most ad hoc reports, a basic bar chart, line graph, or pie chart is more than enough to make your point clearly and effectively.
In a fast-paced environment where quick insights give you a competitive edge, this visual approach is incredibly valuable. As discussed on OWOX.com, this method ensures your findings aren't just seen but truly understood, letting stakeholders grab the key takeaways instantly and act. Of course, solid governance is crucial for making sure data is used correctly; you can learn more by checking out our guide on data governance framework examples.
How AI Is Transforming Ad Hoc Reporting
The next evolution of on-demand analysis is already here, and it’s being driven by artificial intelligence. While traditional ad hoc reporting is a huge leap forward, it often still requires a bit of technical know-how or at least a working knowledge of a specific BI tool. AI changes that dynamic entirely, making data exploration feel as natural as having a conversation.
This shift is made possible by a technology called natural language query (NLQ). It sounds complex, but the idea is simple: you can ask questions about your data using plain English and get an answer right away. The wall between your business question and a data-backed insight crumbles.
Instead of wrestling with menus and filters, anyone on the team can just type a direct question like, “What were our top-selling products in California last quarter by revenue?” The AI understands the request, grabs the right data, and usually hands back a ready-made chart or graph in seconds.
Making Advanced Analytics Accessible to Everyone
This conversational style does more than just save time—it genuinely democratizes data. When you can define an ad hoc report as a simple question, you enable every employee, from marketing to operations, to act as their own analyst. The need to rely on technical gatekeepers for every little inquiry starts to fade away.
AI-powered BI platforms add another layer of intelligence to this process. A sophisticated system won't just answer your question; it might also suggest related metrics or flag an unusual trend you hadn't even thought to look for.
Modern tools like Querio are built with solid governance frameworks working quietly in the background. This setup ensures that while people have incredible freedom to explore, they're only seeing the data they have permission to see. Security and compliance are maintained without creating frustrating delays. For any organization trying to empower its teams, this is how you reduce ad hoc analysis bottlenecks with AI.
Ultimately, AI is turning business intelligence from a one-way street into a dynamic, collaborative conversation. It removes the friction from data analysis and helps build a culture where curiosity is rewarded instantly with clear, reliable answers. When that happens, every team member is equipped to make smarter decisions on the fly.
Your Ad Hoc Reporting Questions, Answered
As teams start digging into their data on the fly, some common questions always pop up. Getting these details straight from the beginning can make the difference between a smooth, insightful process and a whole lot of confusion.
Let's clear up some of the most frequent questions people have when they first start building out an ad hoc reporting process.
Is Ad Hoc Reporting Secure?
It can be, and it absolutely should be. The key is using the right tools for the job. Modern business intelligence platforms are built from the ground up with security in mind. They typically connect to your databases with read-only permissions, so an analyst can’t accidentally change or delete precious source data.
On top of that, strong governance features let you control exactly who sees what. You can set permissions so that a marketing team member can only query marketing datasets, while the finance team sees only financial data. This keeps sensitive information protected while still giving people the freedom to explore.
Do I Need to Be a Tech Whiz to Create an Ad Hoc Report?
Not anymore. It used to be that you needed a solid grasp of SQL or had to be a spreadsheet wizard to pull any kind of custom report. Thankfully, those days are fading fast.
Today’s AI-driven tools have completely changed the game. You can now use natural language to simply ask your question, just like you would in a search bar.
The Big Idea: The whole point of modern ad hoc reporting is to get data into the hands of people who don't have a technical background. If you can ask a question, you can get an answer.
This is a huge shift. It means the people who know the business inside and out—your marketing managers, sales leads, and operations specialists—can get answers for themselves without having to wait in line for a data analyst.
How Is an Ad Hoc Report Different From a Dashboard?
It all comes down to purpose and how long you plan to use it.
Dashboards are for long-term monitoring. They track your most important Key Performance Indicators (KPIs) day in and day out, giving you a consistent, at-a-glance look at the health of the business.
Ad Hoc Reports are built to answer a single, specific question that just came up. They have a very short lifespan; once the question is answered, the report has served its purpose.
Here's a simple analogy: A dashboard is like the speedometer in your car—it’s always on, always telling you your speed. An ad hoc report is like pulling up a map app to find out why you’re suddenly stuck in a traffic jam. It's for a specific, immediate problem.
Ready to give your teams the power to get instant, accurate answers? Querio’s AI-powered platform lets anyone ask questions in plain English and get insights in seconds, finally breaking down those data bottlenecks. See how you can build a truly data-driven culture by visiting the official Querio website.

