Analytics for Finance: Transform Your Data into Strategic Insights
Discover analytics for finance with real-world use cases and a practical roadmap to turn financial data into strategic decisions.
published
Outrank AI
analytics for finance, financial analytics, data-driven finance, FP&A strategy, business intelligence
ef393346-44de-4397-af5d-fcdc152acb9e

Finance analytics is what happens when the finance team stops being just a record-keeper and becomes a strategic partner to the business. It’s about using data, statistical models, and modern tools to dig for deep insights, predict what’s coming next, and recommend smart moves that actually boost growth and profitability.
Why Analytics For Finance Is No Longer Optional
Think about it this way: for decades, traditional finance has been like driving a car by only looking in the rearview mirror. You get a perfect, crystal-clear view of where you've been, but it tells you nothing about the road ahead.
Now, imagine swapping that mirror for a live GPS with predictive traffic alerts and multiple route suggestions. That’s analytics for finance. It’s a fundamental change that gives finance leaders the power to see around corners, spot hidden opportunities, and steer the entire company toward its goals with confidence.
The market is already signaling this shift. The global financial analytics market, currently valued at USD 9.20 billion, is expected to skyrocket to around USD 27.51 billion. This isn't just a fleeting trend; it shows that companies everywhere are scrambling to adopt technologies that can process huge volumes of financial data with speed and accuracy.

From Hindsight To Foresight
The journey from old-school reporting to modern analytics unfolds across four distinct stages. Each step up the ladder answers a more sophisticated question, moving your finance team from a reactive "what happened?" mindset to a proactive, forward-looking one.
To make this crystal clear, here’s a breakdown of the four types of financial analytics.
The Four Types of Financial Analytics Explained
Analytics Type | Core Question | Finance Example |
|---|---|---|
Descriptive | What happened? | Generating a quarterly income statement to review historical revenue and expenses. |
Diagnostic | Why did it happen? | Drilling down into sales data to find out why a specific region missed its revenue target. |
Predictive | What is likely to happen? | Using historical data and market trends to forecast cash flow for the next six months. |
Prescriptive | What should we do about it? | Running simulations to determine the optimal pricing strategy to maximize profit margins. |
This evolution is what separates a finance team that reports on the past from one that shapes the future.
The Strategic Value Of A Data-First Approach
Embracing analytics is about much more than just building better spreadsheets. It’s about weaving data into the fabric of every single financial decision. This mindset empowers finance teams to work hand-in-hand with other departments, providing the critical financial intelligence everyone needs to stay aligned.
When marketing, sales, and operations are all working from the same data-driven playbook, the entire organization moves faster and with far greater purpose.
By transforming how data is analyzed and acted upon, analytics empowers finance teams to make smarter, faster decisions that drive value across the entire organization.
Ultimately, this is how finance cements its role as a true driver of business value. Instead of just closing the books, the modern finance team guides the company forward, using data to navigate uncertainty and pounce on opportunities before anyone else. That's why implementing purpose-built solutions for your finance team isn't a luxury anymore—it's essential for long-term, sustainable growth.
Core Use Cases Driving Modern Finance Teams
Knowing the theory behind finance analytics is one thing, but seeing it in action is where things get interesting. The real value comes out when you apply these ideas to the challenges finance teams face every single day. Instead of just reporting on what happened, analytics gives you a playbook to actually influence what happens next.
These applications are what shift finance from a reactive cost center to a proactive, strategic part of the business. Let's look at a few of the most important ways analytics is making a real impact.
Dynamic Cash Flow Forecasting
Traditional cash flow forecasting is often built on static, historical data, which leaves a business wide open to surprises. It’s a bit like trying to predict tomorrow's weather by only looking at a photo from last week. Finance analytics brings a much more dynamic and intelligent way of doing things to the table.
By pulling in real-time data from sales, operations, and even external market trends, predictive models can create cash flow forecasts that are far more accurate and resilient. This helps teams:
Anticipate Shortfalls: Spot potential cash crunches weeks or even months ahead of time, giving you plenty of runway to arrange financing or adjust spending.
Optimize Working Capital: Find clear opportunities to tighten up the cash conversion cycle by digging into payment terms and inventory turnover rates.
Model Scenarios: Run "what-if" simulations to see how a delayed product launch or a sudden jump in material costs would ripple through your cash position.
This forward-looking approach turns cash flow management from a guessing game into a genuine strategic advantage, making sure the business always has the liquidity it needs to run and grow.
Granular Profitability Analysis
One of the most powerful things you can do with finance analytics is dissect profitability with surgical precision. It's easy to know which products bring in the most revenue, but are they actually the most profitable? The answer might surprise you.
Take a retail company that used analytics to get to the bottom of customer profitability. They found out that some of their highest-revenue enterprise clients were actually losing them money. Why? The high cost of sales, custom service demands, and frequent returns were completely eating away the margins.
Armed with this insight, the company restructured its service tiers and pricing models, turning its most demanding clients into its most profitable ones. This is the kind of game-changing discovery that analytics unlocks.
This granular view can be applied to almost anything—products, service lines, customer segments, sales regions—to uncover hidden truths that lead to smarter decisions. Modern finance teams use these deep insights to power their strategic business financial planning, grounding every choice in solid data.
Proactive Risk Modeling and Management
Risk is just part of doing business, but analytics allows finance teams to get ahead of it instead of just reacting to it. By sifting through massive datasets, AI-powered models can pick up on subtle patterns and anomalies that signal a threat long before it becomes a crisis.
For example, analytics can flag the early warning signs of credit risk by analyzing customer payment behaviors. It can also spot potential supply chain disruptions by keeping an eye on geopolitical and economic indicators.
This transforms risk management from a simple compliance checkbox into a continuous, forward-looking process that protects the company’s bottom line and its reputation. Of course, having the right framework is crucial. If you're building out your team's toolkit, you can explore various FP&A data analysis tools for forecasting and scenario planning to see what's out there. By bringing these tools into the fold, finance teams can build a more resilient and agile organization, ready to face uncertainty with confidence.
The Metrics That Truly Matter in Financial Analytics
Traditional finance has always spoken the language of income statements and balance sheets. These are non-negotiable for official reporting, but let's be honest—they're historical records. They tell a great story about where the business has been, not where it's headed. Of course, a solid understanding the difference between P&L and Balance Sheet is the bedrock of any financial analysis.
But modern analytics for finance adds a new, forward-looking layer to the conversation. It’s all about tracking metrics that signal momentum, operational efficiency, and future value. These KPIs give you a far richer, more actionable picture of business performance, transforming the finance team from a scorekeeper into a strategic guide.
This isn't just a niche trend; it's a massive shift. The global financial analytics market is on track to more than double, jumping from roughly USD 15.2 billion to an estimated USD 34.1 billion. Why the explosive growth? Because companies are finally seeing the power of combining AI and big data to get ahead.
Moving Beyond The Rearview Mirror
Instead of just reporting what happened last quarter, analytics-driven finance teams are obsessed with metrics that help predict what's coming next. This is the critical shift from reacting to past events to proactively making decisions that actually drive growth.
Here are a few examples of the KPIs that data-driven finance teams live and breathe:
Customer Lifetime Value (CLV): This isn't just a marketing metric anymore. It forecasts the total net profit you can expect from a single customer over their entire relationship. Analytics takes this a step further by using predictive models to forecast CLV with impressive accuracy.
Cash Conversion Cycle (CCC): The CCC tells you how long it takes to turn your investments in inventory and other resources back into cold, hard cash. A shorter cycle is a sign of a healthy, liquid business.
Scenario-Based Forecast Accuracy: We're moving beyond simple forecast accuracy. This is about testing your financial models against different "what-if" business scenarios to see how resilient your plan truly is.
These metrics offer a completely new lens for looking at business health. Before we dive deeper, let's look at how this new way of thinking stacks up against the old one.
Traditional vs Analytics-Driven Financial KPIs
The table below highlights the evolution of financial metrics. It's a shift from static, historical snapshots to dynamic, predictive indicators that connect directly to business strategy.
Metric Category | Traditional KPI | Analytics-Driven KPI |
|---|---|---|
Profitability | Gross Profit Margin | Profitability by Customer Segment or Product Line |
Liquidity | Current Ratio | Cash Conversion Cycle (CCC) with root-cause analysis |
Valuation | Historical Revenue Growth | Predictive Customer Lifetime Value (CLV) |
Forecasting | Static Annual Budget vs. Actual | Rolling Forecasts with scenario-based accuracy tracking |
Efficiency | Days Sales Outstanding (DSO) | Automated Invoice-to-Cash Cycle Analysis identifying bottlenecks |
This comparison makes it clear: analytics doesn't just give you new numbers; it gives you a whole new way to understand and influence the business.
How Analytics Supercharges Key Financial Metrics
It’s one thing to know what these metrics are, but it’s another thing entirely to see how analytics makes them so powerful. This is where data science takes traditional financial concepts and uncovers insights that were completely hidden before.
Analytics doesn’t just track metrics; it breathes life into them. It connects operational activities directly to financial outcomes, showing you not just what is happening, but why—and what you can do about it.
For example, by digging into your operational data, you can pinpoint the exact bottlenecks that are dragging out your Cash Conversion Cycle. Is it slow-moving inventory stuck in one specific warehouse? Or maybe a delay in the invoicing process for a particular group of clients? Analytics gives you those answers.
Likewise, predictive models for Customer Lifetime Value can completely change how you approach marketing spend. By identifying your most valuable customer segments, you can focus your resources where they’ll generate the highest return. Understanding what metrics really matter and how AI can surface them is what unlocks this strategic potential. This data-driven vocabulary allows you to lead strategic conversations, moving from just reporting the numbers to actively shaping them.
Your Roadmap to Implementing Financial Analytics
Making the leap from traditional reporting to a dynamic analytics framework can feel daunting, but you don't need a team of data scientists to get there. It’s a practical, phased journey that any finance team can tackle with the right plan. Think of it less as a massive technical overhaul and more as building a new capability one logical step at a time.
This roadmap breaks down the process into four clear phases. The goal is to build momentum and deliver value quickly, ensuring your investment in analytics for finance starts paying off right away.
Following this process completely changes how you see financial metrics—transforming them from static reports into strategic tools for growth. The diagram below shows exactly how that evolution happens.
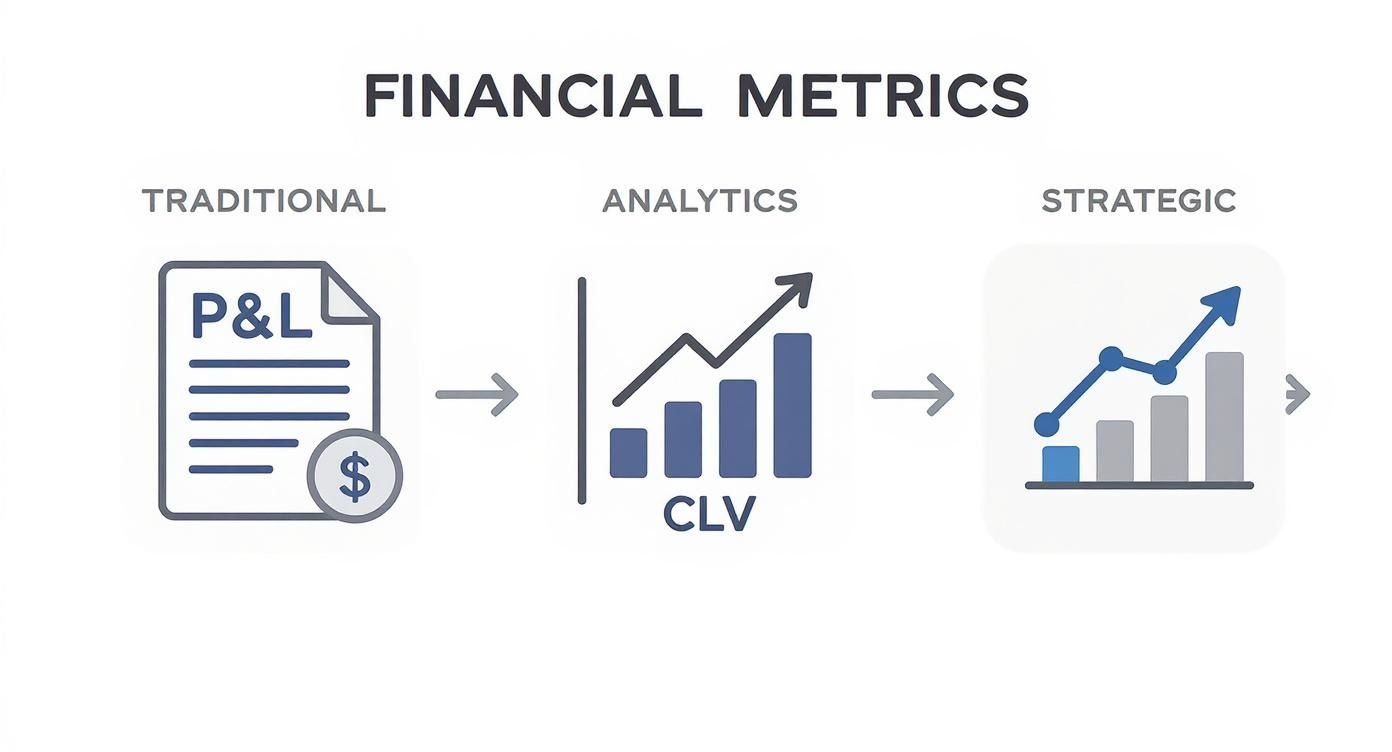
As you can see, this journey takes finance from foundational P&L statements all the way to using advanced analytics like CLV to drive smarter business decisions.
Phase 1: Define Your Business Objectives
Before you even think about software, you have to answer one simple question: what business problem are you trying to solve? Without a clear "why," the most powerful analytics tool is just an expensive dashboard that nobody uses. A successful project always starts with sharp, well-defined goals tied directly to business outcomes.
Don't aim for something vague like "better reporting." Get specific. Are you trying to shorten the cash conversion cycle? Do you need to finally understand profitability by customer segment? Or is the priority to improve forecast accuracy for the next two quarters?
A clear objective acts as your North Star throughout the implementation. It guides every decision, from which data sources to prioritize to the features you’ll actually need in an analytics tool.
I always recommend starting with a small, high-impact project. A quick win not only proves the value of analytics to the rest of the company but also builds the confidence and momentum you'll need for bigger initiatives down the road.
Phase 2: Unify Your Disparate Data Sources
Most finance teams don't have a data problem; they have a data silo problem. Your most valuable information is probably scattered across systems that don't talk to each other—your ERP, CRM, payroll software, and a dozen different spreadsheets. The next critical step is to bring all that data together.
This is often the hardest part, but it's where the real magic happens. Unifying your data creates a single source of truth, a reliable foundation for all your analysis. This is how you finally break the endless cycle of manually exporting, cleaning, and reconciling data in Excel—a process that’s not just slow but also notoriously prone to errors.
Key steps here include:
Identify Critical Systems: Pinpoint the main data sources needed to solve the business problem you defined in Phase 1.
Establish Connections: Work with your IT team or use a modern BI platform to build automated data pipelines from these systems.
Clean and Standardize: Get your data in order. For example, make sure "customer name" is formatted the same way across every system.
Phase 3: Select the Right Tools for Your Team
With your objectives defined and your data unified, it's time to choose your toolkit. The analytics market is huge. The global financial analytics market, valued at USD 12.57 billion, is projected to hit USD 29.65 billion soon. This growth is fueled by demand for real-time tracking and the integration of AI and ML, especially in North America which holds over 34% of the market share. You can discover more insights about financial analytics market trends from IMARC Group.
The key is to pick tools that fit your team's current skills and future goals. Here’s what to look for:
Ease of Use: Can your team get answers without having to write code or wait for a data expert? Look for platforms with intuitive interfaces or natural language query features.
Integration: Does the tool connect easily with your existing data sources, like your ERP and CRM?
Scalability: Will the platform grow with you as your data volume and analytical needs get more complex?
Collaboration: Does it make it easy to share dashboards and insights across the organization?
Ultimately, the choice often boils down to an all-in-one BI platform versus a collection of specialized tools. For most finance teams, an integrated platform offers a much simpler and more cost-effective solution.
Phase 4: Foster a Data-Curious Culture
The final—and most important—phase has nothing to do with technology. It's about people. A successful analytics program depends on building a culture where asking questions and challenging assumptions with data becomes the norm.
This kind of cultural shift has to start at the top. When finance leadership champions data-driven decision-making, the rest of the team will follow. Encourage experimentation and learning, and make a point to celebrate the insights people discover.
Here are a few ways to get started:
Provide Training: Give your team the skills they need to use the new tools confidently.
Start Small: Focus on one or two key dashboards that answer truly critical business questions.
Make it Collaborative: Create a central place, like a shared channel or weekly meeting, where insights are shared and discussed.
By following this roadmap, you can systematically build a powerful financial analytics capability that turns your finance team into a true strategic partner for the business.
How to Design Dashboards That Drive Action
Let’s be honest: data is just noise until you turn it into a story people can understand. A great dashboard does exactly that. It takes dense, complex financial information and transforms it into a clear narrative that points directly toward the next best decision. The goal isn’t to just splash numbers on a screen; it's to communicate what those numbers mean so clearly that the next step becomes obvious.
This means we have to move beyond the generic pie charts and bar graphs that come standard in most tools. The most effective analytics for finance dashboards are built with a specific person in mind, using carefully chosen visuals to answer their most pressing business questions. A CEO’s view of the world is entirely different from a treasury manager’s, and both need something different from a product team. Good design is all about tailoring the story to the audience.
Know Your Audience and Their Questions
Before you even think about picking a chart type, the first rule of dashboard design is to know exactly who you're building it for. A single, one-size-fits-all dashboard is a recipe for a tool that no one uses because different roles have fundamentally different priorities.
You have to get inside their heads. Start by asking these critical questions:
Who is this for? Are we building this for the C-suite, a department head, or an analyst on the front lines?
What are their top 3-5 questions? What information do they absolutely need to do their job better today?
How deep do they need to go? An executive wants the 30,000-foot summary, while an analyst needs to be able to dig into the raw data.
What action will this drive? A dashboard should directly support the decisions they are paid to make.
Answering these questions first ensures you’re building a practical tool, not just a pretty report. A well-designed dashboard feels like it’s anticipating what the user needs, providing answers before the questions are even fully formed.
Choosing the Right Visuals for the Story
Once you understand your audience and their burning questions, the next step is picking the right way to show them the answer. Different charts tell different stories. Using the wrong one can easily hide a crucial insight or, even worse, lead someone to the completely wrong conclusion.
Think of each chart type as a unique storytelling tool. Your job is to pick the one that gets the message across most clearly and quickly.
Here are a few powerhouse visuals for financial storytelling:
Waterfall Charts: These are absolute gold for variance analysis. They perfectly illustrate how a starting value (like last year's revenue) gets to an ending value by showing all the positive and negative steps along the way. You can instantly see what drove the change.
Scatter Plots: When you need to spot a relationship between two different things, scatter plots are your best friend. For instance, you could plot marketing spend against new customer acquisition to see if there's a real connection.
Bullet Graphs: For tracking performance against a target, nothing beats a bullet graph. It packs a ton of context into a tiny space, showing the current value, the target, and performance ranges (like poor, good, and great) all in one.
Heat Maps: Got a massive dataset where you need to spot risk or concentration? Heat maps are perfect. An accounts receivable heat map, for example, could use color to instantly draw your eye to customers who pose the biggest credit risk.
The goal is to make the data intuitive. A stakeholder should be able to glance at a chart and grasp the main takeaway in five seconds or less. If they have to stare at it and squint, the visualization has failed.
Structure a Narrative That Guides Decisions
A truly great dashboard is much more than a random collection of charts. It’s a structured narrative that guides the user's eye logically from the most important, high-level numbers down to the finer details. Think of it as an "inverted pyramid" approach, just like in journalism.
Start with the big picture and work your way down:
Top-Level KPIs: Put the three to five most critical metrics right at the top, front and center. These are the headline numbers that give an immediate pulse-check on the health of the business.
Trends and Comparisons: Right below the headlines, show how those key metrics are trending over time or how they stack up against targets or prior periods. This layer adds crucial context to the big numbers.
Detailed Breakdowns: Finally, the bottom section should be reserved for the detailed charts and tables that let users explore the "why" behind the numbers. This is where they can drill down into specific regions, products, or customer segments to find answers.
This structure creates a natural flow, helping leaders quickly assess the situation and then dig deeper only where they see something interesting or concerning. By turning data into a clear story, you empower everyone in the organization to stop just looking at information and start taking decisive, data-backed action.
Navigating Data Governance, Security, and Compliance
Let's be honest: bringing all your financial data into one place is incredibly powerful, but it also creates a massive responsibility. You're essentially building a vault of your company's most sensitive information. This makes a rock-solid plan for data governance and security non-negotiable—it's the bedrock of any analytics program worth its salt.
If people can't trust the numbers, the whole system falls apart. Without a framework for protecting and managing that data, you're not just risking a breach; you're risking the credibility of your insights. Think of it less as an IT problem and more as a core finance priority.
Building Your Data Governance Framework
Data governance is really just the rulebook for your data. It answers the simple but critical questions: Who can see what? What are they allowed to do with it? And how do we keep it clean and accurate? The goal is to create that elusive single source of truth everyone talks about, putting an end to the chaos of conflicting spreadsheets.
To get there, you have to put some structure in place. Following key data governance best practices is the only way to build an analytics function the rest of the company will actually rely on. This boils down to a few key components:
Access Controls: This is all about need-to-know. Set up roles so people only see data relevant to their job. Your sales team, for example, has no business looking at raw payroll files.
Data Quality Standards: You need clear, repeatable processes for cleaning and validating data. This is how you guarantee the numbers hitting your dashboards are accurate and consistent. Garbage in, garbage out, right?
Data Lineage: You should be able to trace every piece of data back to its origin and see how it’s been changed along the way. This creates a clear audit trail and builds huge confidence in your financial reporting.
Upholding Security and Regulatory Compliance
In the world of finance, security isn’t just a feature; it’s a requirement. You’re handling everything from employee PII to confidential M&A plans, and it's all heavily regulated. One slip-up can lead to crippling fines and a PR nightmare you can’t recover from.
Think of compliance not as a roadblock, but as a blueprint for building trust. Meeting standards like GDPR, CCPA, and SOC 2 shows you’re serious about protecting stakeholder data—a cornerstone of modern finance.
You have to be proactive. This goes way beyond just having a good firewall. It means fostering a security-first mindset within the finance team itself. Things like regular training on how to spot phishing attempts and securely handle sensitive information should be second nature. Your analytics platform has to pull its weight, too, with features like end-to-end encryption and detailed audit logs. By weaving security into your daily operations from the very beginning, you create an analytics program that's not just powerful, but resilient and trustworthy.
Answering Your Top Questions About Financial Analytics
Diving into analytics for finance can feel like a big leap, but it's a game-changer. It's also completely normal to have questions as you get started. Let's walk through some of the most common ones we hear from finance pros.
Do We Need to Hire a Data Scientist?
Not at all. This is probably the biggest misconception out there. Modern business intelligence platforms are built for business people, not data specialists.
Think of it this way: you don't need to be a mechanic to drive a car. The best tools today have simple drag-and-drop interfaces or even let you ask questions in plain English, like, "Show me our product profitability by region for Q3." Your team gets the answers they need on their own, which means they can stop being number-pullers and start being strategic partners to the business.
What's the Real Cost of a Financial Analytics Solution?
This is a classic "it depends" situation, but I can give you some guideposts. The cost really hinges on the size of your team, the volume of your data, and the specific capabilities you're looking for. You'll find everything from affordable monthly subscriptions for smaller teams to major enterprise-level systems.
The key is to think about the total cost of ownership—that includes the software license, implementation, training, and any ongoing maintenance. But don't forget the other side of the equation: the return. A 2023 study confirmed a direct link between adopting analytics and stronger financial performance.
When you're looking at different tools, don't just focus on the price tag. Focus on the value it will create. A good platform should pay for itself by uncovering major cost savings or highlighting revenue opportunities you couldn't see before.
What's the Best Way to Start?
Don't try to boil the ocean. The biggest mistake people make is trying to build a massive, do-it-all dashboard right out of the gate. The best approach is to pick one specific, high-impact business problem and solve it first.
Here are a few great places to start:
Analyze Your Cash Conversion Cycle: Find out exactly where the bottlenecks are in your invoice-to-cash process.
Dig Into Customer Profitability: Figure out which customers are actually making you money (and which ones aren't).
Sharpen Your Forecast Accuracy: Start tracking the variance between your forecasts and actuals to see where you can improve.
Nailing a focused project like this delivers a quick win. That success creates momentum and gives you a powerful story to tell when you're ready to expand your analytics for finance program.
Ready to stop wrestling with spreadsheets and start getting instant answers from your data? With Querio, your finance team can ask questions in natural language, build insightful dashboards, and automate reporting in minutes, not weeks. Discover how Querio can transform your financial analytics today.

