Top 12 Data Democratization Tools for Self-Serve Analytics in 2026
Discover the 12 best data democratization tools for 2026. A guide to features, pricing, and use cases for scaling self-serve analytics.
published
Outrank AI
data democratization tools, self-serve analytics, business intelligence, data tools, ai analytics
815cfbcd-f4e2-438e-89f7-099bef498c8f

True data democratization isn’t just about giving everyone a dashboard; it’s about empowering every team member, from product managers to marketing leads, to answer their own questions with confidence and speed. The bottleneck is no longer data collection, but data access. Overwhelmed data teams become 'human APIs,' and critical business decisions are delayed for days or weeks. This common roadblock prevents startups and established companies alike from reacting quickly to market changes and customer needs.
The right platform can dismantle these barriers, turning curiosity into immediate insight. But choosing from a crowded market is a significant challenge. This article moves beyond generic lists to provide a realistic evaluation of 12 leading data democratization tools. We'll explore how platforms like Querio, Power BI, and Looker address core challenges such as natural-language queries, governed self-service, and embedded analytics. Data democratization, at its core, is about empowering users to extract insights from raw data, much like how specialized expert data analytics services help businesses uncover strategic value.
Our goal is to help you find the best solution for your specific needs. For each tool, you'll find a concise summary, core feature analysis, ideal use cases, and honest pros and cons. We also include implementation considerations and direct links, so you can make an informed decision and finally unlock your organization's collective intelligence.
1. Querio
Querio positions itself as a powerful AI-driven analytics layer that sits directly on top of your data warehouse, turning it into a self-serve platform. Instead of data teams acting as a "human API" fielding constant requests, Querio enables them to build reusable, version-controlled logic using Python notebooks. This foundational context allows non-technical users, from product managers to founders, to ask complex questions in natural language and receive immediate, code-backed answers.
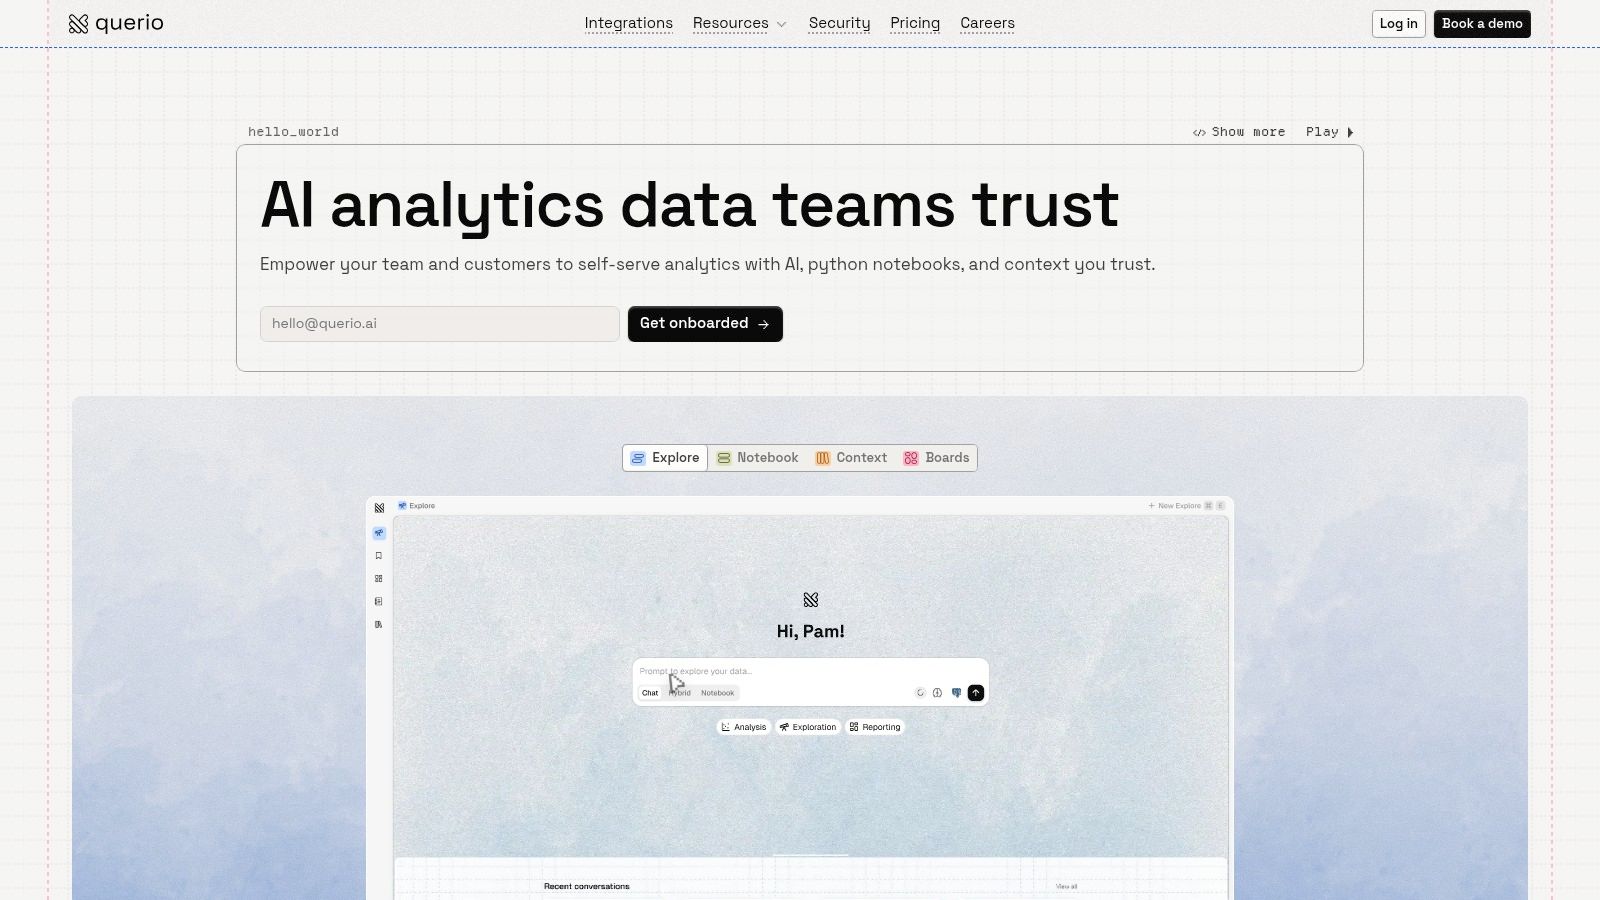
The platform’s standout feature is its explicit-code model. Every answer generated by its AI agent is backed by readable Python and SQL stored in Git-backed notebooks. This transparency makes analytics auditable, collaborative, and trustworthy. Business users get instant answers, while data teams can review, edit, and harden the underlying logic, creating a scalable system of verified insights. This unique notebook-first approach makes it one of the most practical data democratization tools for organizations aiming for both speed and governance.
Core Features and Use Cases
Reactive Python Notebooks: Cells in a notebook automatically recompute when their dependencies change, ensuring dashboards and analyses are always live. This is ideal for real-time monitoring of product KPIs, marketing campaign performance, or operational metrics.
AI Coding Agents: Non-technical users can query data using natural language. The agent generates the necessary SQL and Python, which is then executed against the pre-approved context built by the data team. This dramatically reduces the "time-to-insight" for ad-hoc questions.
Embeddable Analytics: Dashboards and reports can be embedded directly into internal tools or customer-facing applications via iFrame, API, or as a Micro-frontend Component Part (MCP). This is perfect for SaaS companies wanting to offer in-app customer dashboards or for embedding live metrics into a company-wide portal.
Enterprise Governance: The platform supports robust Role-Based Access Control (RBAC) and connects to major data warehouses like Snowflake, BigQuery, and Redshift, inheriting existing security protocols.
Evaluation and Pricing
Querio’s primary value is in reducing analyst bottlenecks and operational costs, with on-site case studies claiming significant annual savings and accelerated reporting cycles.
Feature | Details |
|---|---|
Best For | Mid-market companies looking to scale self-serve analytics without hiring more analysts. Product teams needing embedded analytics. |
Pros | Transparent, code-backed AI; drastically reduces analyst workload; strong embedding and integration options. |
Cons | No public pricing requires a sales demo; initial setup requires data team involvement to build the foundational context. |
Pricing | Custom. You must contact their sales team for a demo and quote. |
Website |
If your goal is to create a transparent, auditable, and scalable self-service analytics culture, Querio offers a compelling, code-first solution.
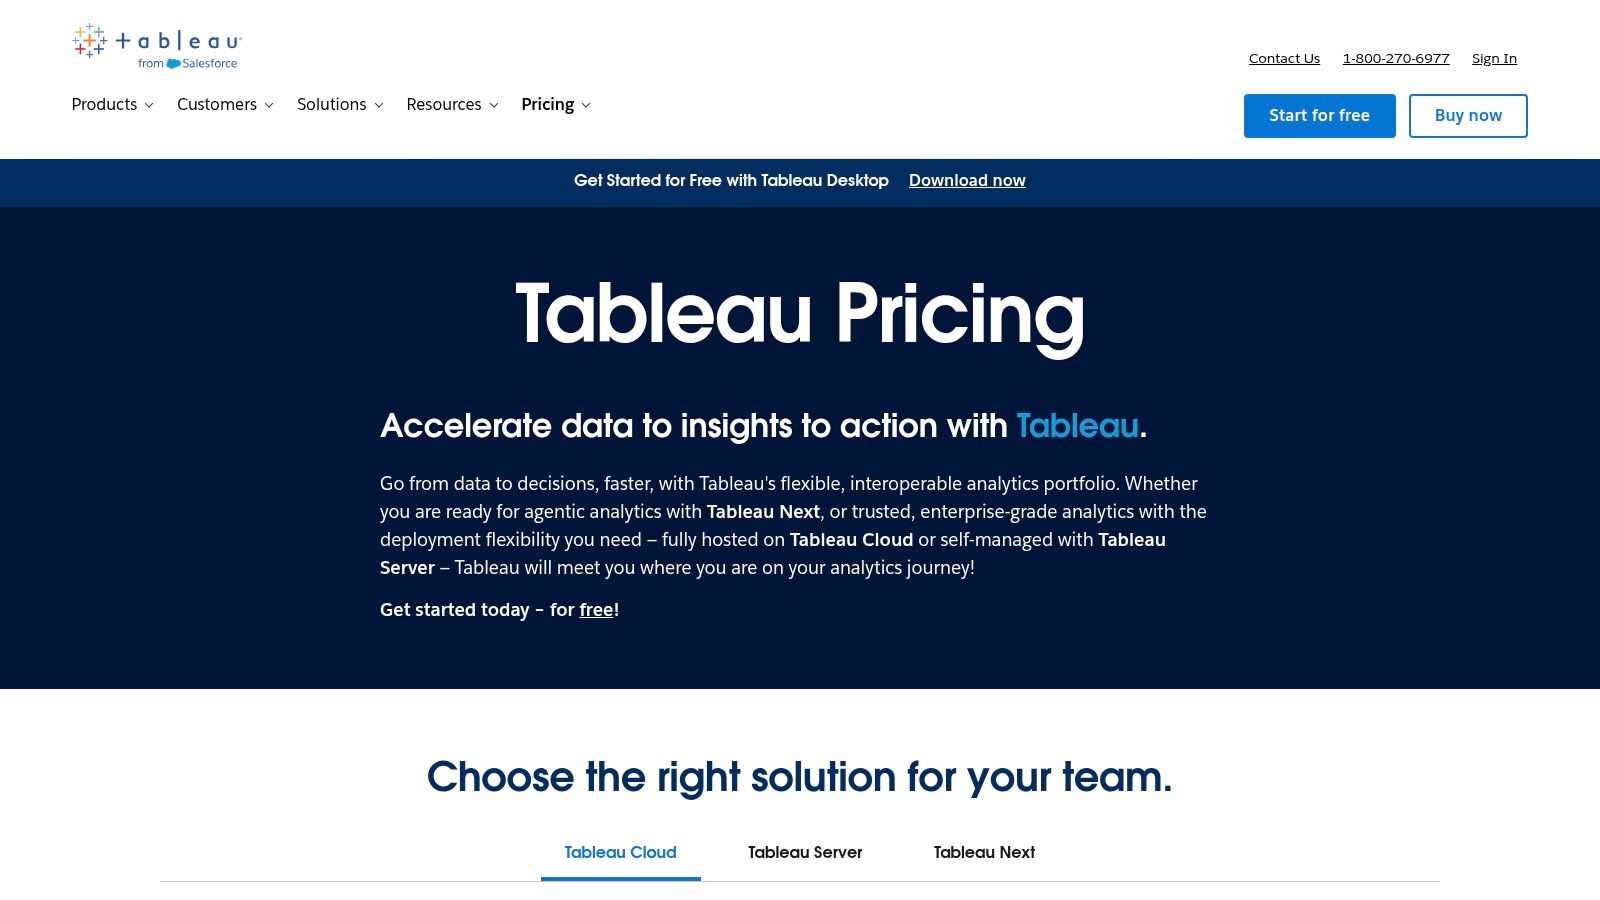
2. Tableau (Salesforce)
Tableau has long been a heavyweight in the business intelligence space, providing an enterprise-grade platform that balances deep analytical power for data experts with accessible dashboards for business users. It excels at visual analysis and storytelling, allowing teams to build complex, interactive reports from a wide range of data sources. As a mature solution, it’s one of the most established data democratization tools available.
Its strength lies in its role-based licensing (Creator, Explorer, Viewer), which allows organizations to manage access and capabilities with precision. Creators build the data sources and advanced dashboards, while Viewers can interact with them securely. The recent addition of AI-powered features like Tableau Pulse helps non-technical staff ask questions and get automated insights, further broadening data access. For a detailed breakdown of how it stacks up against newer, self-serve options, see our complete comparison of Querio vs. Tableau.
Key Features and Considerations
Best For: Large organizations with established data teams that need robust governance, compliance, and powerful visual analytics for both analysts and business stakeholders.
Pros: Its ecosystem is immense, with a huge community, extensive training resources, and proven scalability for thousands of users.
Cons: The licensing structure can become costly, particularly for large teams of Creators and Explorers. Data modeling and defining the semantic layer often require significant effort outside the platform, which can be a hurdle for smaller teams.
Pricing: Role-based per-user, per-month billing. Creator licenses start at $75/user/month. Viewer licenses are less expensive but have limited functionality.
Website: https://www.tableau.com/pricing
3. Microsoft Power BI (part of Microsoft Fabric)
As a cornerstone of the Microsoft ecosystem, Power BI has become one of the most widely adopted data democratization tools, largely due to its cost-effective licensing and deep integration with Office 365. It empowers business users to create and share insights within the familiar environments of Teams and SharePoint, lowering the barrier to entry for self-service analytics. Its recent integration into Microsoft Fabric positions it as a key component of a much larger, end-to-end data and AI platform.
The platform’s strength lies in its ability to provide a complete analytics workflow, from data preparation with Power Query to advanced modeling with DAX. This allows organizations to build a governed semantic layer that business users can explore with confidence. To better understand the capabilities of this powerful tool, explore more about Business Intelligence Power BI. For a detailed analysis of how it compares to agile, AI-native alternatives, check out our Querio vs. Power BI comparison.
Key Features and Considerations
Best For: Organizations heavily invested in the Microsoft stack that need an affordable, scalable BI solution for a large number of report consumers and business analysts.
Pros: The price-to-value ratio is excellent, especially for large teams of viewers. A familiar interface reduces the learning curve for users already comfortable with Microsoft products, and the platform benefits from a rapid, monthly feature release cycle.
Cons: The learning curve for advanced data modeling with DAX and Power Query can be steep for non-technical users. Licensing is also becoming more complex as it shifts toward Fabric capacities, which may require migration planning for existing customers.
Pricing: A free desktop version is available. Pro licenses start at $10/user/month. Premium plans offer capacity-based pricing for broader distribution.
Website: https://powerbi.microsoft.com
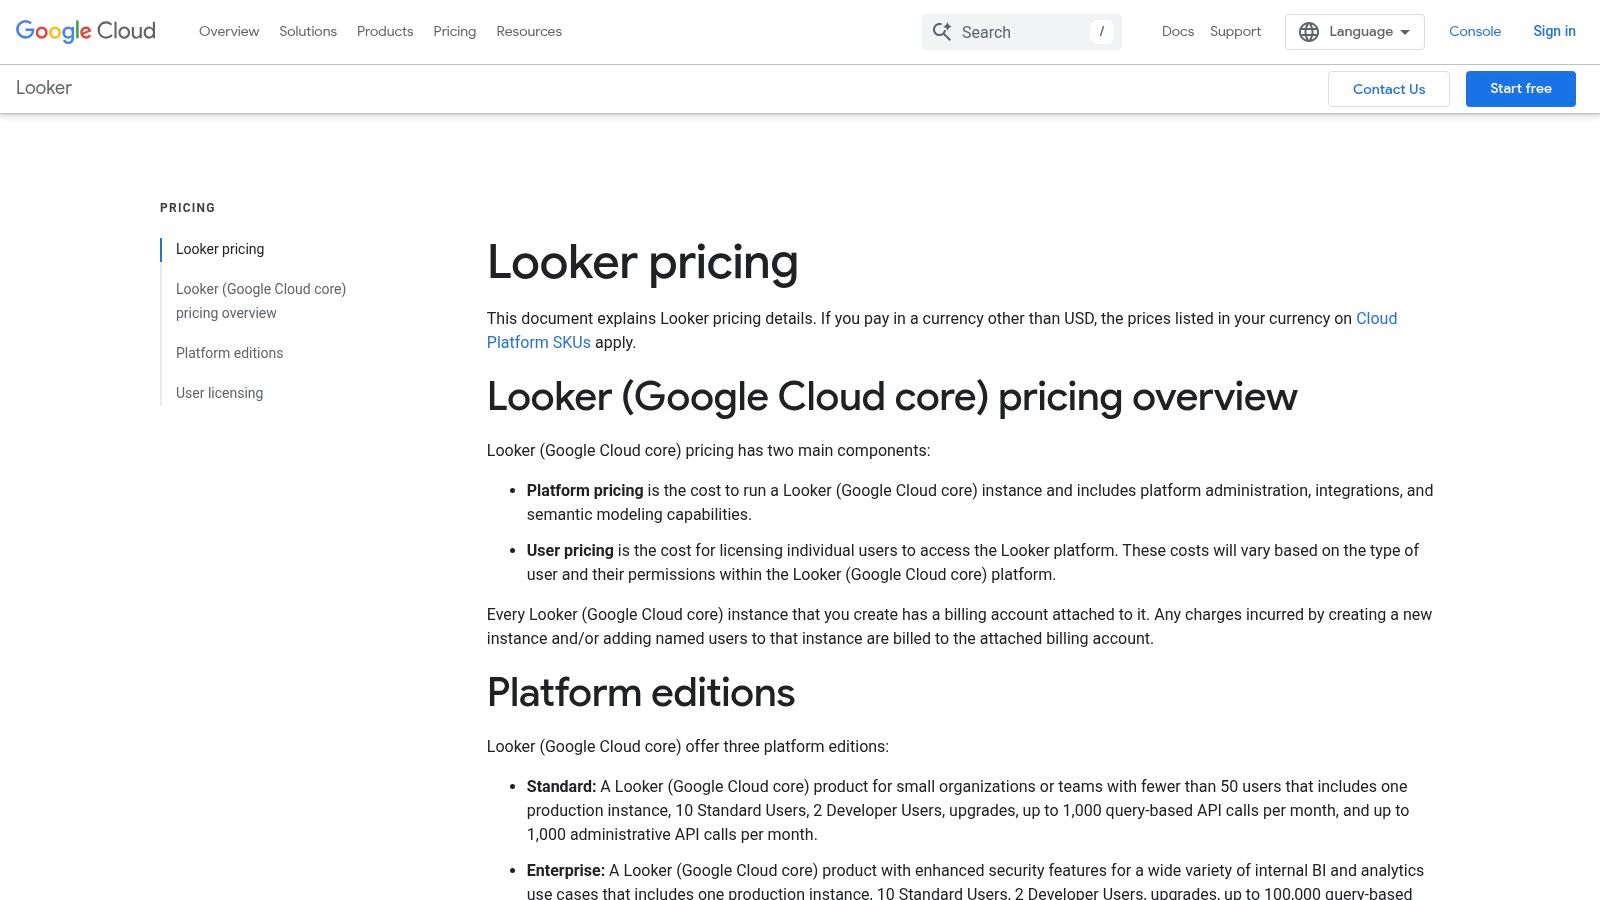
4. Google Cloud Looker (Looker core)
Google Cloud's Looker is a governed, model-driven BI platform built around its powerful semantic layer, LookML. This approach prioritizes creating a single source of truth, where all business metrics and logic are centrally defined and managed by data teams. Once this foundation is set, business users can confidently explore data, knowing the definitions are consistent and vetted, making it one of the most robust data democratization tools for organizations that value governance.
Its strength is in enabling governed self-service. The developer-centric workflow, which uses LookML and integrates with Git, allows analytics engineers to build a reusable and scalable analytics framework. This means non-technical users can ask questions using its conversational analytics feature or build their own reports without needing to write SQL or understand the underlying data structure. To see how this model-driven approach compares to more agile solutions, review our in-depth analysis of Querio vs. Looker.
Key Features and Considerations
Best For: Mid-size to large companies that need a "single source of truth" for metrics and want to embed analytics into their products or internal applications with strong governance.
Pros: The centralized semantic layer (LookML) provides exceptional governance and consistency. It offers mature APIs for embedding and powerful developer workflows for analytics engineering.
Cons: The quote-based pricing can lead to a higher total cost of ownership compared to more straightforward tools. Its developer-centric modeling has a steeper learning curve and can be a hurdle for small teams without dedicated analytics engineering resources.
Pricing: Custom quote-based. Pricing is determined by user types, deployment scale, and edition (Standard, Enterprise, Embed).
Website: https://cloud.google.com/looker/pricing
5. Looker Studio (Free) and Looker Studio Pro (Google)
Looker Studio, formerly Google Data Studio, offers one of the most accessible entry points into data visualization, making it a popular choice for rapid dashboarding and insight sharing. Its browser-based interface and seamless integration with the Google ecosystem (especially Google Analytics, Ads, and BigQuery) allow marketing, growth, and product teams to get started with minimal friction. The free tier’s unlimited reporting is a powerful feature, establishing it as one of the most widely used data democratization tools for small to mid-sized teams.

The platform operates on two levels: the widely used free version and Looker Studio Pro. The Pro tier adds critical enterprise features like team workspaces for collaboration, organizational ownership of assets, and SLAs for support. This dual model allows teams to start for free and scale into a more governed environment as their needs grow, though the distinction and upgrade path can sometimes be confusing for new users. Its core strength remains its cloud-native simplicity and the ease of sharing reports via a simple link.
Key Features and Considerations
Best For: Marketing, growth, and product teams, especially those heavily invested in the Google ecosystem, that need fast, free, or low-cost dashboarding and reporting.
Pros: The free version has an extremely low barrier to entry, enabling quick adoption across an organization. Its cloud-native design makes sharing and collaboration straightforward.
Cons: Advanced governance and semantic modeling capabilities are limited compared to enterprise BI platforms. The pricing and project structure for the Pro version can be dispersed and difficult to navigate.
Pricing: The standard Looker Studio is free with unlimited reports. Looker Studio Pro is priced per project, per user, per month, with costs tied to the number of users and specific Google Cloud project settings.
Website: https://lookerstudio.google.com
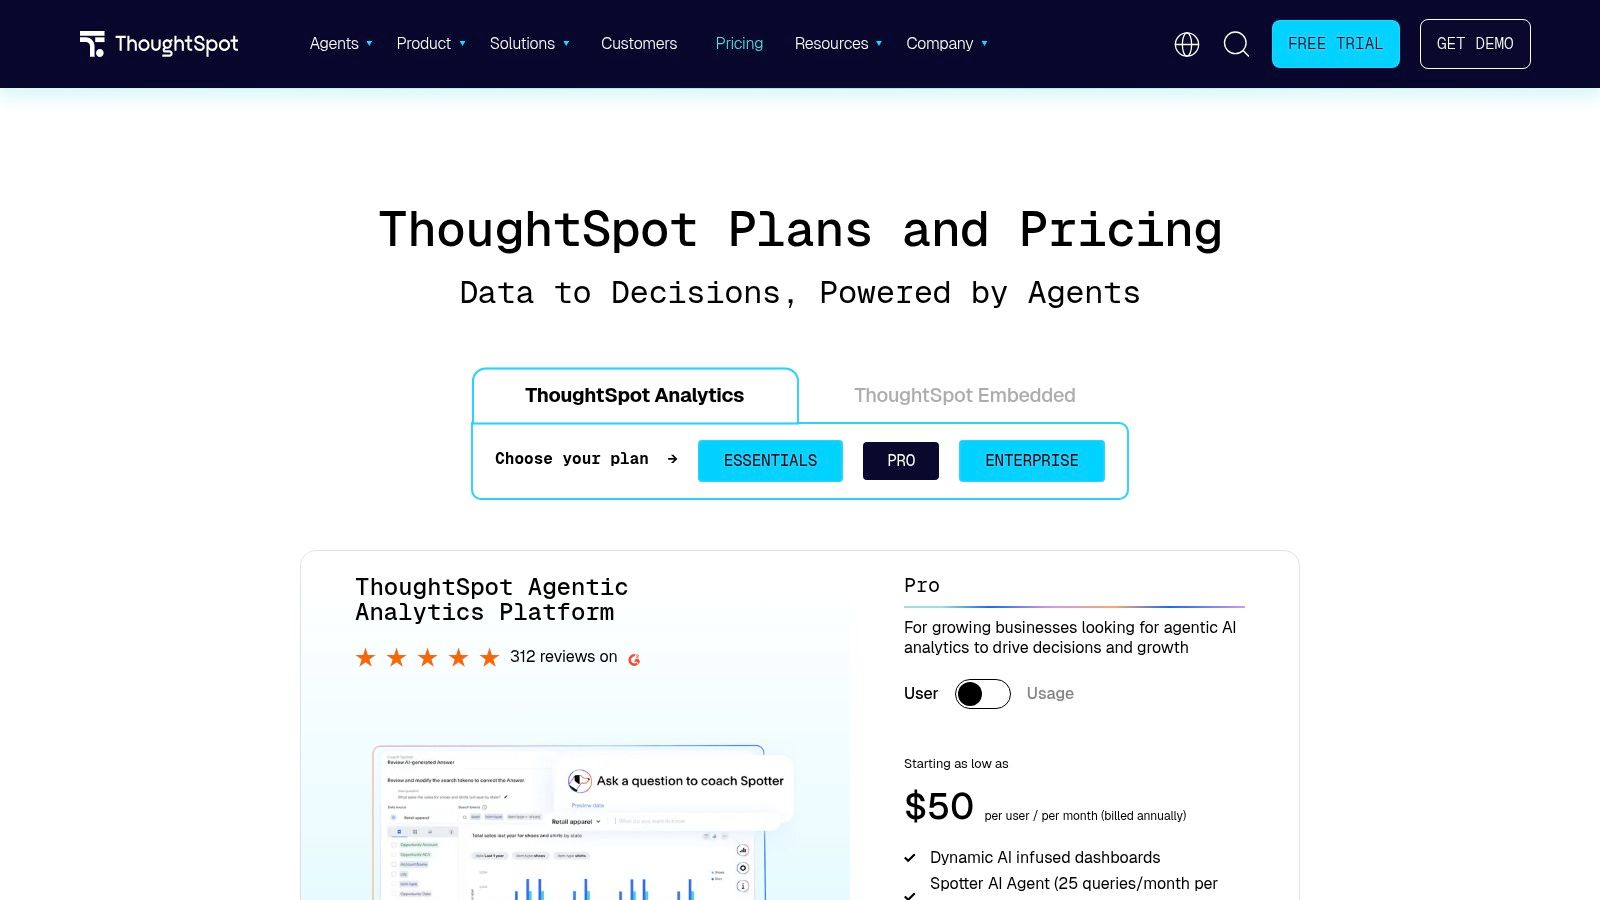
6. ThoughtSpot
ThoughtSpot positions itself as a modern analytics cloud focused on search and AI-driven insights. Its core strength is enabling non-technical business users to explore governed data using a natural-language search interface, much like using a consumer search engine. This approach dramatically lowers the barrier to entry for data exploration, making it one of the most user-friendly data democratization tools for organizations aiming for widespread adoption.
The platform is designed to deliver answers and charts instantly, bypassing the traditional report-request cycle. Features like its AI-assisted analysis automatically surface trends and anomalies that a user might have missed. For product teams, ThoughtSpot Everywhere provides a robust solution for embedding these powerful search-based analytics directly into applications, creating a seamless user experience. To understand how this fits into the broader ecosystem, you can learn more about the principles of self-serve analytics and how they empower teams.
Key Features and Considerations
Best For: Enterprise-scale organizations that want to empower business departments with genuine self-service capabilities and reduce their reliance on central data teams for ad-hoc queries.
Pros: The search-first interface is extremely approachable for non-analysts. It is excellent for broad rollouts where speed-to-insight and user adoption are primary goals.
Cons: Pricing is largely quote-based, and the total cost of ownership for an enterprise license can be high. The platform's effectiveness depends heavily on having a well-defined and robust data model prepared upstream.
Pricing: Custom pricing based on usage, features, and deployment model. They offer specific editions for product teams (Embedded) and programs for startups.
Website: https://www.thoughtspot.com/pricing
7. Sigma
Sigma positions itself as the spreadsheet for your cloud data warehouse, blending the familiar, cell-based interface of Excel or Google Sheets with the power of live-querying enterprise-scale data. Its core innovation is compiling familiar spreadsheet formulas directly into warehouse-native SQL, allowing business users to explore billions of rows of live data without writing code or waiting for data extracts. This direct connection makes it a powerful choice among data democratization tools for organizations aiming to eliminate shadow IT and empower teams with self-serve analytics.
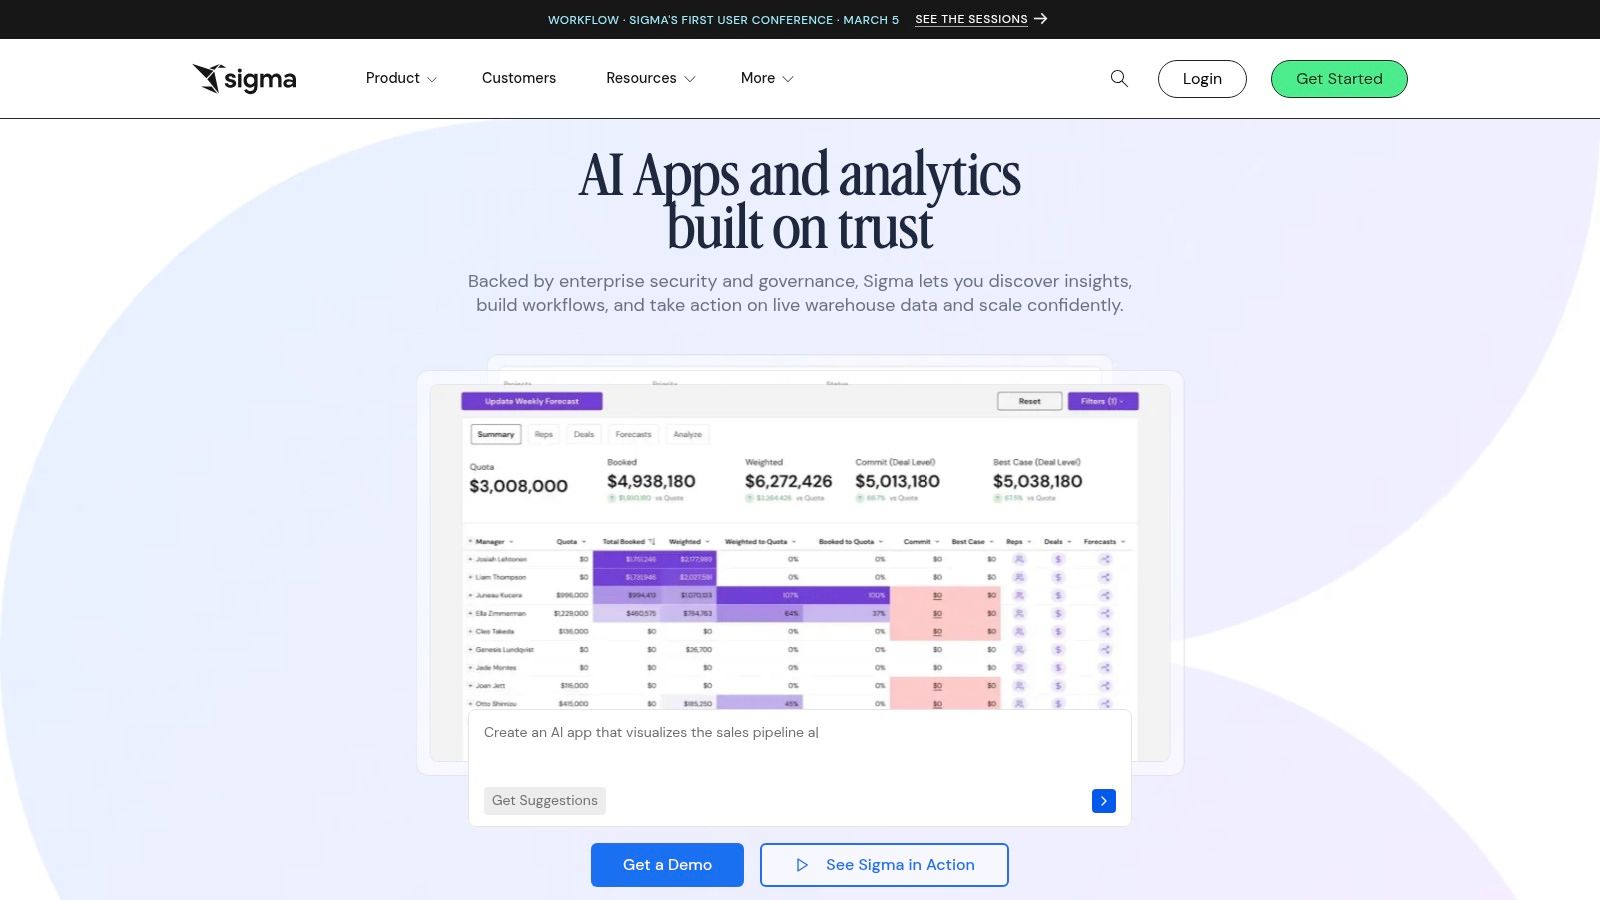
The platform's live-query architecture means all analysis and governance remain centralized within the warehouse. Unique features like Input Tables allow users to write data back to the warehouse, enabling lightweight application development and scenario modeling directly within the analytics interface. By integrating with semantic layers from tools like dbt and Snowflake, Sigma ensures that business users are working with governed, consistent metrics while retaining the analytical freedom they are accustomed to in a spreadsheet.
Key Features and Considerations
Best For: Organizations with a modern cloud data warehouse (like Snowflake, BigQuery, or Redshift) that want to empower finance, operations, and marketing teams with a familiar spreadsheet interface for live data exploration.
Pros: The spreadsheet paradigm ensures rapid user adoption for non-technical staff. It effectively reduces data silos and outdated "shadow spreadsheets" by keeping all work connected to the live warehouse.
Cons: Pricing is quote-based and not publicly listed, which can make initial budget planning difficult. While great for exploration and standard charting, its custom visualization capabilities are more constrained compared to dedicated BI tools.
Pricing: Custom pricing based on a quote. Plans are typically structured around user roles and warehouse usage, but specifics require a direct sales inquiry.
Website: https://www.sigmacomputing.com
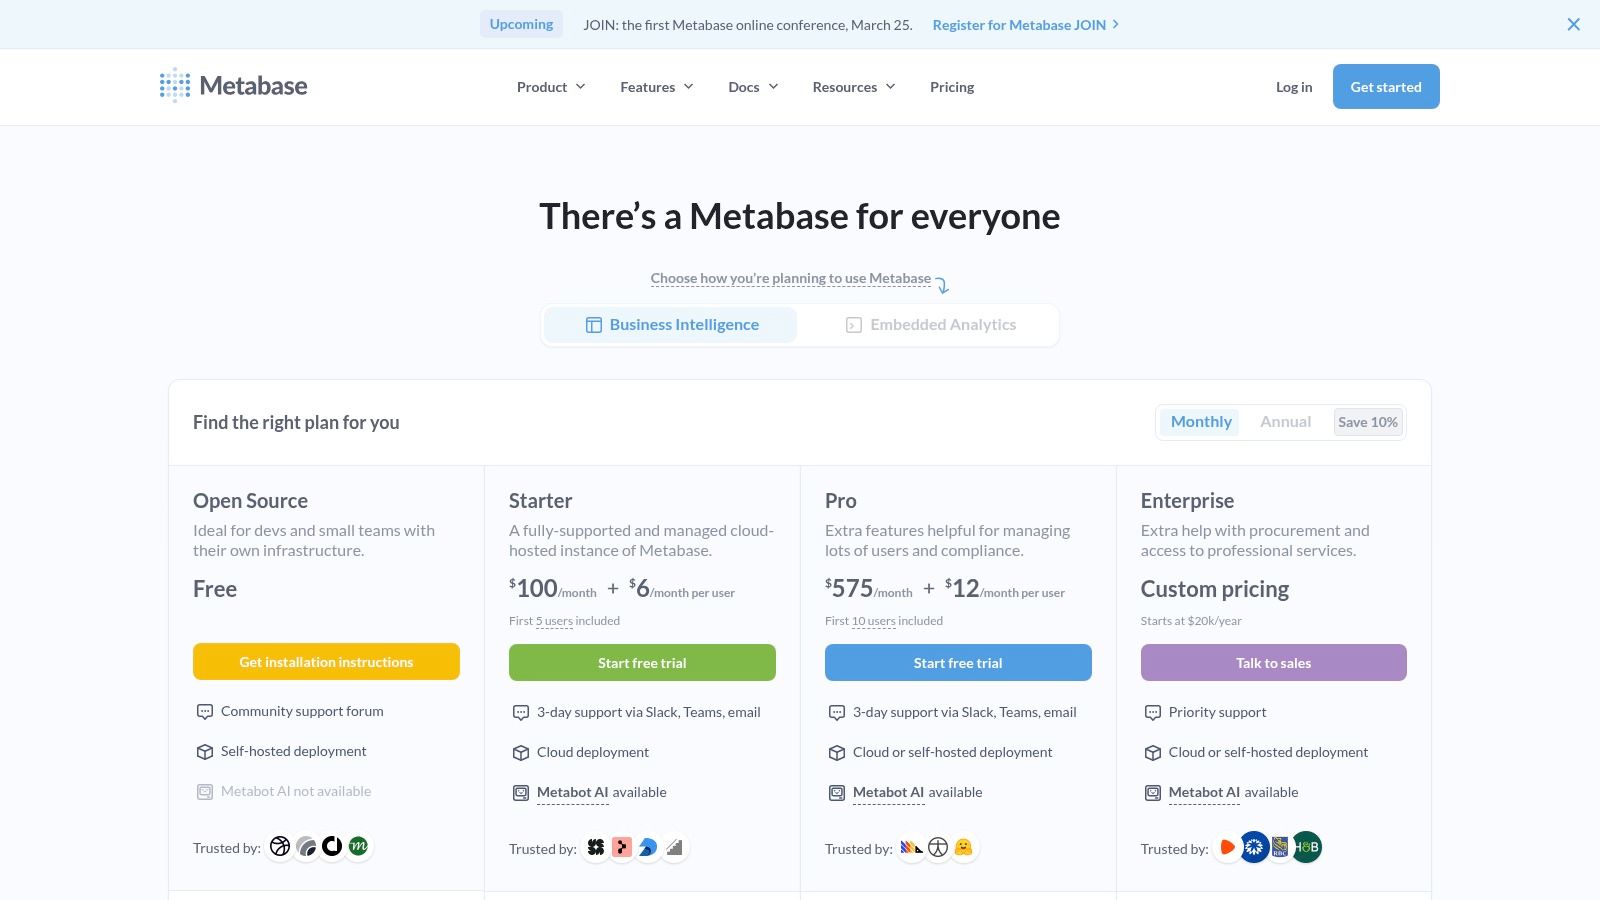
8. Metabase
Metabase champions an open-source, self-serve approach to business intelligence, making it an accessible choice for startups and product teams. It simplifies data exploration for non-technical users through an intuitive question builder, while still providing a full SQL editor for analysts. By focusing on a clean user experience and quick setup, Metabase is one of the fastest data democratization tools to implement for both internal reporting and customer-facing embedded analytics.
The platform’s strength lies in its balance of simplicity and power. Users can ask questions using a guided interface or, with Metabot, use natural language to generate queries and charts. For data teams, the Pro and Enterprise tiers add crucial governance features like a verifiable semantic layer, row and column-level permissions, and options for multi-tenant embedding. This tiered model allows a company to start small and scale its data capabilities as its needs grow.
Key Features and Considerations
Best For: Startups, small to mid-sized businesses, and product teams needing a fast, low-cost way to enable self-serve analytics and embed dashboards into applications.
Pros: Transparent and affordable pricing, including a free open-source version. The user interface is exceptionally clean, which speeds up onboarding for non-technical staff.
Cons: The visualization library is less extensive compared to top-tier BI platforms. Advanced governance features like audit logs and granular permissions are locked behind the higher-priced Pro or Enterprise plans.
Pricing: Offers a free open-source version. Paid cloud plans start at $85/month for up to 5 users, with Pro and Enterprise tiers offering advanced features and user scaling.
Website: https://www.metabase.com/pricing
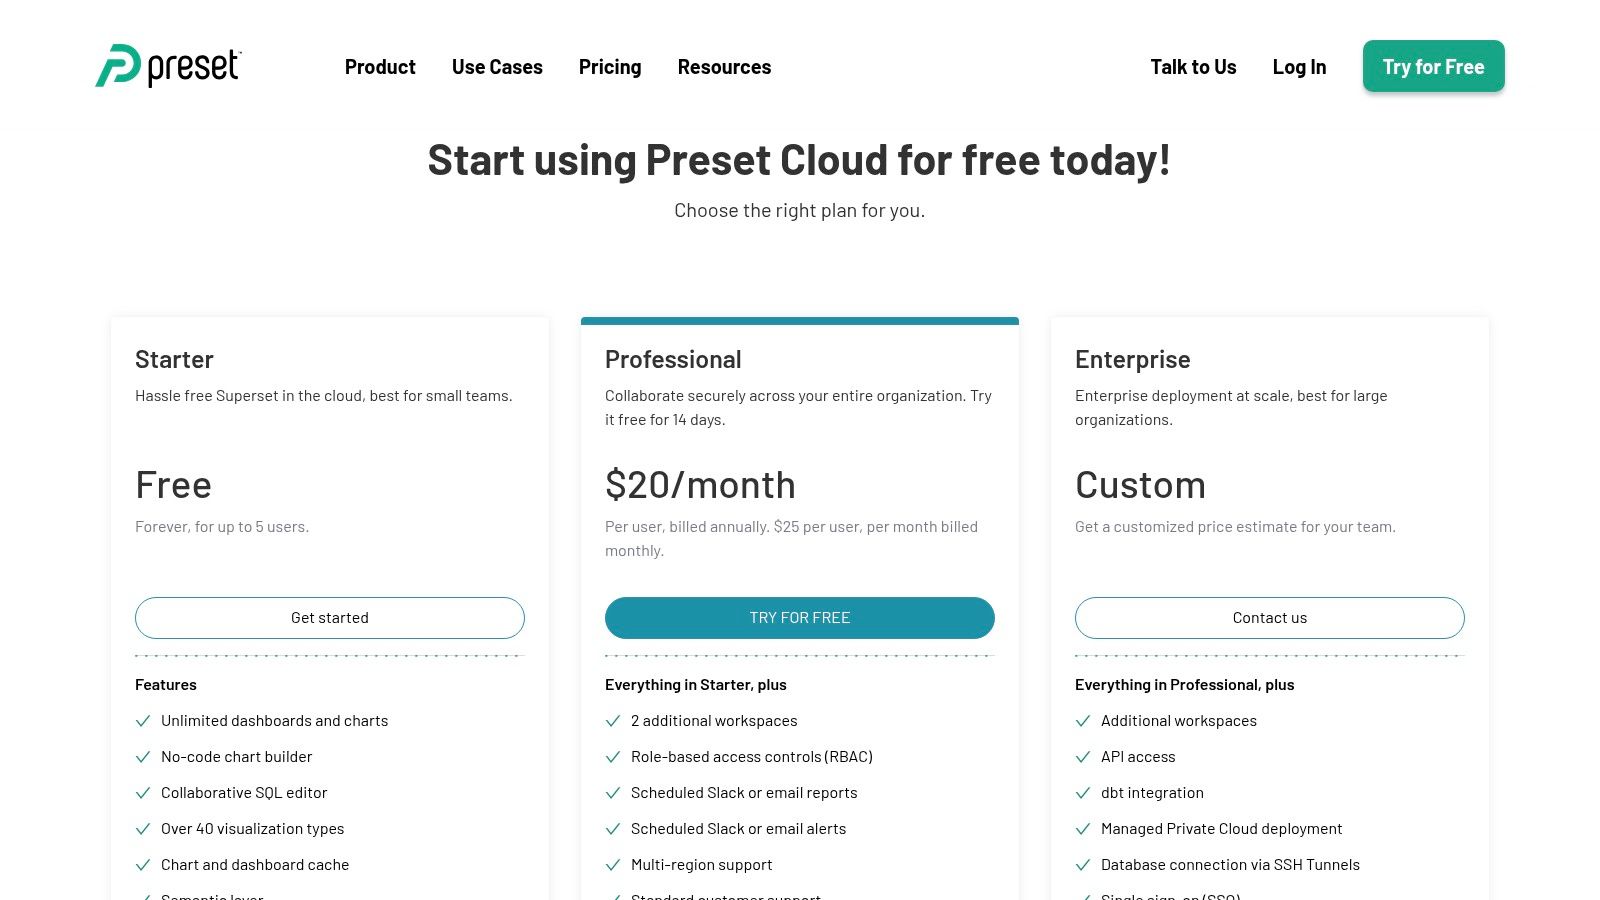
9. Preset (Managed Apache Superset)
Preset offers a fully managed, enterprise-grade version of the popular open-source platform, Apache Superset. It aims to deliver the flexibility and cost-effectiveness of open source with the convenience and security of a SaaS solution. By providing both a no-code chart builder and a collaborative SQL editor, it caters to a wide spectrum of users, from business stakeholders to data analysts, making it a strong contender among modern data democratization tools.
The platform stands out by adding critical enterprise features like SOC 2 compliance, SSO/SCIM, and detailed audit logs on top of Superset's core functionality. Recent additions like an AI-assisted natural-language-to-SQL feature and a semantic layer lower the barrier to entry for non-technical users. Its model, with discounted licensing for viewers, makes embedding analytics and sharing dashboards across an entire organization financially viable.
Key Features and Considerations
Best For: SQL-centric teams and organizations that use modern cloud data warehouses and want an open-source alternative to legacy BI without managing the infrastructure themselves.
Pros: Very cost-competitive, with no platform fees on standard plans, making it scalable. The open-source foundation provides an "escape hatch," reducing vendor lock-in risk.
Cons: While rapidly evolving, some advanced enterprise features still lag behind top incumbents. It is best suited for teams comfortable with a SQL-first approach and modern data stacks.
Pricing: User-based pricing with Professional plans starting at $20/user/month. Significant discounts are available for users with view-only permissions, encouraging broad access.
Website: https://preset.io/pricing
10. Qlik Cloud Analytics
Qlik's platform stands out with its powerful associative analytics engine, which allows users to explore connections across all their data without the constraints of query-based tools. This unique approach enables a more intuitive and free-form data discovery process, where users can see both related and unrelated values. As one of the more established data democratization tools, Qlik Cloud packages this engine with generative AI and automated machine learning, making it a powerful choice for organizations aiming for broad, governed self-service analytics.
Its capacity-based pricing model is a key differentiator, allowing for an unlimited number of basic users who can view and interact with reports without individual licenses. This simplifies org-wide rollouts and encourages widespread data access. Features like the generative AI-powered Qlik Answers and the included Reporting Service further support non-technical users, allowing them to ask questions in natural language and receive automated reports, which helps break down traditional data barriers.
Key Features and Considerations
Best For: Mid-to-large enterprises seeking a single, governed platform for self-service analytics that supports flexible exploration and can be deployed to a wide user base cost-effectively.
Pros: The associative engine provides a fast and flexible exploration experience. Capacity-based licensing is excellent for promoting broad data access across an entire organization.
Cons: The semantic modeling approach is different from traditional SQL-first tools and requires dedicated training to master. Pricing details can vary by region and often require a conversation with sales for exact figures.
Pricing: Offers tiered, capacity-based pricing (Standard, Premium, Enterprise) that enables unlimited basic users, alongside a per-user option for advanced roles.
Website: https://www.qlik.com/pricing
11. Domo
Domo positions itself as an end-to-end data platform, aiming to consolidate data integration, ETL, business intelligence, and even app development into a single, cloud-native solution. It is designed to bring governed, real-time insights directly to frontline workers, moving beyond traditional executive dashboards. This all-in-one approach makes it a strong contender among data democratization tools for organizations looking to reduce vendor complexity.
The platform’s strength is its ability to manage the entire data lifecycle, from connecting to hundreds of sources with its robust connectors and drag-and-drop ETL to building mobile-first operational apps with its low-code studio. Features like AI assistants and integrated workflow automation help bridge the gap between insight and action, allowing business users to not only see data but also act on it directly within the platform.
Key Features and Considerations
Best For: Mid-to-large enterprises that want a unified platform for data integration, BI, and operational apps, with a strong focus on mobile access for all employees.
Pros: The all-in-one platform design simplifies the tech stack for integration and BI, reducing vendor sprawl. Its mobile experience and executive dashboards are highly polished and effective.
Cons: Pricing is consumption-based and requires engaging with a sales team, which can be a barrier for smaller companies. While it has ETL capabilities, complex data modeling may still demand dedicated data engineering resources.
Pricing: Quote-based pricing is determined by consumption, data storage, and query volume. A free trial is available, but you must contact sales for a custom quote.
Website: https://www.domo.com/pricing
12. GoodData (GoodData Cloud)
GoodData approaches business intelligence from a composable, API-first perspective, making it ideal for developers and data teams building custom analytics experiences. Instead of a monolithic platform, it offers a "headless" BI engine and semantic layer that can power analytics within applications, portals, or other systems. This model excels at delivering consistent, governed metrics across an organization, positioning it as one of the more developer-centric data democratization tools.
The platform’s core strength is its modern semantic layer, where metrics can be defined as code, version-controlled, and managed with Git-based workflows. This allows distributed teams to collaborate on business logic while ensuring everyone uses the same definitions for key performance indicators. Its architecture is built for embedding, providing robust APIs and SDKs to integrate analytics directly into user-facing products, a key requirement for data-driven applications.
Key Features and Considerations
Best For: Product teams embedding analytics into their applications, and data engineers creating governed "metrics stores" to serve multiple internal and external stakeholders.
Pros: Highly flexible for embedded use cases and delivering consistent metrics across different channels. The developer-friendly "metrics-as-code" workflow helps standardize definitions at scale.
Cons: The pricing structure is entirely custom and requires direct engagement with their sales team, which can be a barrier for teams wanting quick, transparent cost estimates. Its community of practitioners is smaller compared to giants like Tableau or Power BI.
Pricing: Custom enterprise pricing based on usage, number of workspaces, and support levels. A free tier is available with limitations for individuals and small projects.
Website: https://www.gooddata.com/pricing
Top 12 Data Democratization Tools — Feature Comparison
Product | Core features & approach | Target users & UX | Governance & integrations | Unique strengths & value | Pricing & ROI |
|---|---|---|---|---|---|
Querio (Recommended) | Python notebook–first, reactive cells, AI coding agents running on your warehouse | Mid‑market data teams, product managers, non‑technical analysts; notebook + no‑wait UX | Git‑backed notebooks, RBAC, third‑party audits, connects to major warehouses | Explicit‑code AI answers, embeddable boards, reduces analyst bottlenecks, auditable | Quote‑based; demos required; vendor claims large ROI (e.g., $120K–$200K+ saved, 20x faster reporting) |
Tableau (Salesforce) | Visual analytics, role‑based authoring, advanced calculations, AI features | Analysts, BI teams, storytellers; rich visual authoring | Strong governance, enterprise connectors, Cloud/Server options | Deep visual capabilities, large partner ecosystem, enterprise scale | License‑based; can be expensive at scale |
Microsoft Power BI (Fabric) | DAX/Power Query semantic modeling, tight M365/Fabric integration | Microsoft‑centric orgs, broad viewer rollouts; familiar UI | Row‑level security, Fabric capacities, Teams/SharePoint sharing | Strong price‑to‑value for viewers, fast feature cadence | Low per‑user entry; Fabric SKU migration considerations |
Google Cloud Looker | LookML semantic layer, model‑driven BI, embedding & APIs | Analytics engineering, product teams, orgs needing single source of truth | Centralized metrics, multi‑cloud support, robust APIs | Governance & developer workflows, mature embedding | Quote‑based; can lead to higher TCO |
Looker Studio / Pro | Browser dashboards, many connectors; Pro adds team controls | Marketing/growth/product teams; easy, link‑share UX | Pro adds admin controls, org content, BigQuery integration | Very low barrier (free), fast sharing | Free tier; Pro paid with dispersed pricing info |
ThoughtSpot | Search‑driven NLQ, AI‑assisted insights, embedding | Non‑technical users, broad rollouts, product embeds | Works best with strong upstream models, embedding APIs | Natural‑language exploration, quick time‑to‑insight | Quote‑based; enterprise TCO can be high |
Sigma | Spreadsheet‑style live queries, writeback (Input Tables) on warehouse | Business users who prefer spreadsheets, ops teams | Live queries keep governance in warehouse, semantic integrations | Spreadsheet UX with warehouse governance, reduces shadow sheets | Quote‑based pricing |
Metabase | Open‑source/cloud BI, guided question builder, Metabot AI | Startups, product teams, low‑cost explorers | OSS option, Pro+ tiers add permissions & governance | Transparent pricing, fast onboarding, OSS escape hatch | Affordable cloud tiers + OSS; clear pricing |
Preset (Managed Superset) | Managed Apache Superset, no‑code charts, collaborative SQL | SQL‑centric teams, cost‑conscious orgs | RBAC, SSO/SCIM, audit logs, multi‑workspace | Cost‑competitive, open‑source escape hatch, embedding | Competitive plans; pricing listed per plan |
Qlik Cloud Analytics | Associative analytics engine, generative AI assistants | Organizations seeking flexible exploration and broad access | Capacity‑based licensing, governance, ML & reporting | Associative exploration, flexible licensing for org‑wide rollouts | Capacity tiers; region/quote variations |
Domo | End‑to‑end (connectors, ETL, BI, apps, automations) | Frontline workers, ops teams, executives; mobile‑first UX | Hundreds of connectors, enterprise governance, SSO | All‑in‑one platform, mobile dashboards, low‑code apps | Consumption/quote‑based pricing |
GoodData (Cloud) | Headless/composable BI, metrics‑as‑code, semantic layer | Product analytics, embedded metrics, federated teams | APIs/SDKs, row/column security, versioned metrics | Embedding‑first, metrics‑as‑code, consistent metrics across apps | Custom pricing; sales scoping required |
Making Data a Team Sport
We've explored a wide array of powerful data democratization tools, from established enterprise giants like Tableau and Power BI to modern, nimble platforms like Querio and Sigma. The central theme connecting them all is a fundamental shift in how organizations approach their data. It's no longer about guarding access but about granting it responsibly, moving information from isolated silos into the daily workflows of every team member.
The journey through this list reveals a clear truth: there is no single "best" tool for every company. The ideal choice is deeply contextual, depending on your organization's unique makeup. A large enterprise with complex security needs might find a good fit with Qlik or GoodData, which offer robust governance and granular control. Conversely, a fast-moving startup might prioritize speed and ease of use, finding immense value in Metabase's quick setup or Sigma's spreadsheet-like interface.
From Evaluation to Empowerment
Choosing your platform is just the first step. The true test of any of these data democratization tools is not just their feature set, but their adoption. A successful implementation hinges on a few critical factors:
Skill Alignment: Does the tool meet your team where they are? A business team comfortable with spreadsheets will adapt quickly to Sigma, while engineers and product managers may prefer the SQL-first and natural language capabilities of a tool like Querio.
Governance Guardrails: Democratization without governance is chaos. Tools that provide strong data modeling layers (like Looker's LookML) or clear row-level security (a key feature in most modern platforms) are essential for building trust and ensuring data integrity.
Workflow Integration: The most effective tools don't force users into a separate, isolated analytics portal. Instead, they bring insights directly into the applications where work happens. This is where embedded analytics, a core feature of Querio, GoodData, and others, becomes a game-changer. It makes data a natural part of the decision-making process, not a separate task.
The ultimate goal is to foster a culture of curiosity. When a marketing manager can independently analyze campaign performance, or a product manager can track feature adoption without filing a data request, the entire organization accelerates. You reduce the dependency on a central data team, freeing them to focus on more strategic, complex challenges. This creates a positive feedback loop: accessible data encourages questions, which leads to more informed decisions and, ultimately, better business outcomes.
The Future is Self-Serve
The era of waiting days for a simple report is over. The platforms we've discussed, from the visual drag-and-drop interface of Power BI to the search-based analytics of ThoughtSpot, all point toward a self-serve future. By carefully selecting and implementing one of these solutions, you are not just buying software; you are investing in your team's potential. You are providing the means to transform every employee from a passive data consumer into an active, empowered participant. This is how you make data a true team sport, where everyone has the tools they need to play, contribute, and win.
Ready to see how a code-first, AI-powered approach can accelerate your data democratization efforts? Querio combines natural language queries, powerful embedded analytics, and a developer-friendly setup to put data insights directly into your product. Explore how Querio can help your entire team build and self-serve analytics in minutes, not months.

