Business intelligence architecture: A blueprint for data-driven success
Explore how business intelligence architecture transforms raw data into strategic insight with scalable components, principles, and best practices.
https://www.youtube.com/watch?v=FO-44ICx6sk
published
Outrank AI
business intelligence architecture, data warehouse design, bi components, etl process, data analytics strategy
9caecc76-48c8-4184-bdeb-84185a65f40b

A business intelligence architecture is the master blueprint for how data moves through your company. It’s the entire ecosystem of technologies and processes you use to take raw, scattered information from all corners of your business and turn it into clear, actionable insights that drive smarter decisions.
Unpacking the Blueprint for Your Data
Think of all the data your company generates as a landscape filled with raw resources. You've got sales figures in one mine, customer feedback in another, and operational logs over in a third area. By themselves, they’re just isolated pockets of potential. A BI architecture is the infrastructure—the refineries, pipelines, and power grid—that processes those raw materials into a refined, usable form of energy for your entire organization.
This framework is much more than a technical diagram on a whiteboard. It’s the very foundation of a data-driven culture. It sets the rules for how you collect, clean, store, and ultimately analyze information. Without this structure, you get data silos, where different teams pull conflicting numbers, leading to slow decisions and a general mistrust of the data. A well-designed architecture gives everyone a single, reliable source of truth to work from.
Why a BI Architecture Matters Today
The need for a solid BI framework has never been greater. Companies are swimming in more data than ever before, and the ability to make sense of it is a massive competitive advantage. You can see this reflected in the market itself; the global business intelligence software market, a core component of any modern architecture, hit USD 41.74 billion and is expected to reach USD 47.48 billion. This growth is fueled by the intense demand for systems that can wrangle data processing, storage, and analytics into a cohesive whole. You can find more market insights from Precedence Research.
A robust BI architecture solves several critical business problems:
Consistency: It ensures everyone is on the same page. Key metrics like "monthly recurring revenue" or "customer lifetime value" are defined and calculated the same way across every department, ending the confusion.
Accessibility: It puts data into the hands of non-technical users. With self-service tools, business teams can explore data and find their own answers without waiting on a specialized data team.
Scalability: A good design is built to grow with you. It can handle more data, more users, and more complex questions as your business expands without collapsing under the pressure.
Security: It provides a clear structure for data governance, making sure sensitive information is protected and only seen by the people who are supposed to see it.
In essence, a business intelligence architecture moves an organization from reactive data retrieval to proactive strategic insight. It’s the difference between asking "what happened?" and being able to confidently answer "what should we do next?"
To put it simply, the architecture is the central nervous system for your data. It connects all your disparate systems—your CRM, ERP, marketing tools, and more—into one unified ecosystem. At the heart of this system is often a data warehouse, which acts as a clean, organized, and reliable repository for all your analytical data. You can learn more about this crucial component in our complete guide to business intelligence data warehousing. By building this solid foundation, you create a system where data isn't just collected—it's put to work.
Let’s take a look at how this data journey unfolds. The following table breaks down the typical flow within a BI architecture, from the moment data is created to when it becomes a valuable insight.
Key Stages of a Business Intelligence Architecture
Stage | Purpose | Key Technologies Involved |
|---|---|---|
Data Sourcing | The initial collection of raw data from all relevant systems and applications. | CRM (e.g., Salesforce), ERP (e.g., SAP), marketing platforms, databases. |
Data Integration (ETL/ELT) | Extracting, transforming, and loading data into a centralized repository. | ETL tools (e.g., Fivetran, Stitch), custom scripts, data pipelines. |
Data Warehousing | Storing structured, cleaned, and integrated data optimized for analysis and reporting. | Cloud data warehouses (e.g., Snowflake, BigQuery), on-premise solutions. |
Data Analysis & Modeling | Applying analytical techniques and business logic to uncover patterns and insights. | SQL, Python, R, data modeling tools. |
Data Visualization | Presenting the analyzed data in an accessible, visual format for end-users. | BI platforms (e.g., Tableau, Power BI), dashboards, reporting tools. |
Each of these stages is a critical link in the chain. A failure in one stage, like poor data integration, will inevitably impact the quality of the insights you can generate at the end. A strong architecture ensures every step is sound.
The Core Components of Your Data Ecosystem
Every solid business intelligence architecture is built on a handful of key components that work in tandem. Think of it as an information factory. You start with raw materials, run them through an assembly line for processing, store the finished goods in a warehouse, and then deliver them to the people who need them.
This process is a logical flow that turns raw, messy data into clear, actionable insights.
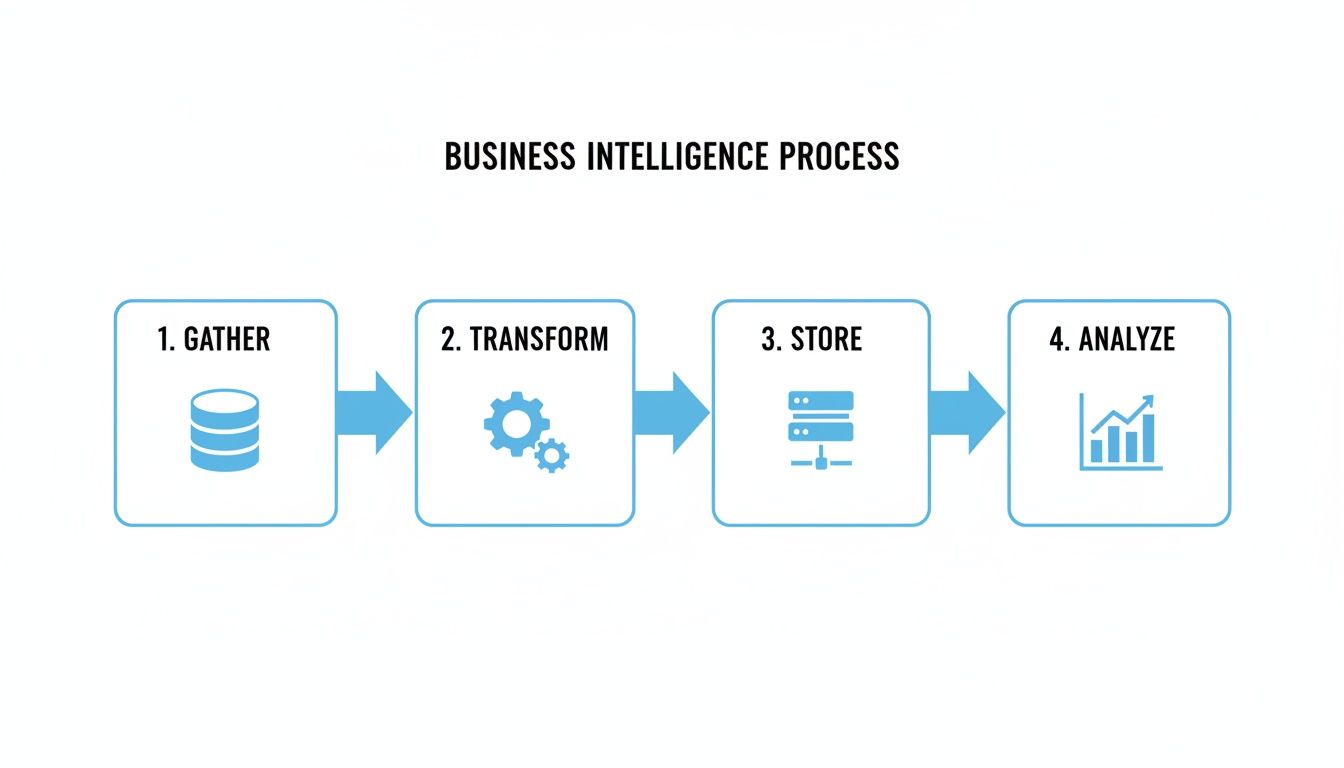
As the diagram shows, it all starts with gathering data, then transforming it, storing it, and finally, putting it to work through analysis. Let's peel back the layers on each of these stages.
Data Sources: The Raw Materials
This is where the entire BI journey kicks off. Data sources are simply all the different places your business information comes from. To build a complete picture, a good BI system needs to pull from a wide range of them.
These inputs can be anything from your internal sales software to external market data feeds. The goal here is to cast a wide net and capture every relevant piece of the puzzle.
Common data sources include:
Transactional Systems: This is the daily-grind data from your CRM (like Salesforce) or ERP platforms. It's packed with crucial details on sales, operations, and finances.
Databases: Whether you’re using traditional SQL or more flexible NoSQL databases, they are the backbone of your applications and hold a ton of structured data.
Cloud Platforms and APIs: So much of modern business happens in the cloud. We're talking about data from Google Analytics, HubSpot, social media, and dozens of other SaaS tools, usually pulled in via APIs.
Flat Files: Never count out the humble spreadsheet. Excel and CSV files are still everywhere, used for manual data uploads or for getting data out of older systems. For instance, incorporating reliable Financial Data Sources for Stock Analysis is a key step in feeding your BI systems with high-quality information.
Data Integration: The Factory Assembly Line
Once you’ve collected all your raw materials, they need to be prepped and processed. This is the job of the data integration layer, which uses processes known as ETL (Extract, Transform, Load) or ELT (Extract, Load, Transform). This step is all about cleaning, standardizing, and structuring the data so it all plays nicely together.
It's like taking a pile of ingredients from different grocery bags—some fresh, some a bit bruised—and getting them ready for a single recipe. You sort things out, toss the duplicates, fill in any gaps, and make sure everything is in a consistent format. Skip this, and you’re stuck with the classic "garbage in, garbage out" problem, building your analysis on a shaky foundation.
A well-oiled data integration process is the unsung hero of BI. It's what ensures that when your sales team and your finance team both ask for "revenue," they're looking at the exact same number, calculated the exact same way.
For a deeper look into this critical layer, check out our guide on the modern analytics stack.
The Data Warehouse: The Organized Library
After the data has been cleaned and structured, it needs a permanent home. That home is the data warehouse, a massive, centralized repository specifically designed for running fast and efficient analytical queries. It's fundamentally different from the databases that run your day-to-day operations, which are built for quick transactions, not deep analysis.
Think of it as a perfectly organized library. Every piece of information is cataloged and shelved in just the right spot, making it incredibly easy for your analysts and business users to find exactly what they need, right when they need it.
Analytical Engines: The Brains of the Operation
With all your data sitting neatly in the warehouse, the analytical engine is what brings it to life. This is the component that fields the questions your users ask, running complex calculations, aggregations, and models on the stored data.
This is where the real number-crunching happens. When someone wants to know, "What was our average customer lifetime value by region last quarter?" the analytical engine dives into the data, does the math, and serves up the answer. Today's engines are powerful enough to chew through massive datasets and return results in seconds.
BI and Visualization Tools: The Dashboard
The final piece of the puzzle is the interface—the part business users actually see and interact with. BI and visualization tools like Tableau, Power BI, or Querio take the raw numbers from the analytical engine and turn them into intuitive charts, graphs, and interactive dashboards.
This is the storytelling layer of your BI architecture. It translates complex data into a language anyone can understand, allowing people to spot trends, notice anomalies, and make smart decisions without writing a single line of code. It’s like the dashboard in your car, turning a ton of complex engine data into simple, actionable signals like your speed and fuel level.
Choosing the Right BI Architecture Model
Picking the right business intelligence architecture isn't about finding a single "best" solution. It's about finding the blueprint that fits your company's reality—your budget, your data, and your long-term ambitions. The model you land on will define how quickly your teams can get answers and how well you can adapt to new challenges.
Think of it like building a house. You wouldn't use the same blueprint for a small cabin that you would for a sprawling mansion. The design has to match the purpose. In the same way, your BI architecture needs to be built for your specific data needs.
The Traditional On-Premise Model
The traditional BI architecture is the classic, time-tested approach. It’s typically built on-premise, with a very methodical, top-down process. Data follows a straight line: it’s pulled from source systems, pushed through a rigid ETL process, and loaded into a highly structured data warehouse.
This is the assembly line of the data world—it’s predictable, secure, and produces consistent, reliable outputs. For companies in heavily regulated fields or those with strict data sovereignty rules, keeping everything in-house offers total control. But that control comes at a price. The rigidity makes it slow to adapt, and scaling up means buying and installing more physical hardware, which gets expensive fast.
The Modern, Agile Architecture
The modern BI architecture was a direct response to the need for speed and flexibility. It shatters the rigid, linear flow of the traditional model by bringing in concepts like data lakes and real-time data streaming. Instead of only storing perfectly clean data, a data lake can hold massive volumes of raw, untouched information.
This is a game-changer. It means data scientists and analysts can dive in and explore data in its original state, hunting for new patterns without waiting for a long, drawn-out transformation process. This model is built for the age of big data, capable of handling everything from social media streams to IoT sensor logs. Its nimbleness makes it a perfect fit for companies that need to innovate on the fly.
The jump from traditional to modern architecture is like going from a perfectly organized library to a hands-on research lab. The library has everything cataloged and easy to find (structured data), but the lab gives you the raw materials and tools to make entirely new discoveries (unstructured data).
The Cloud-Based Revolution
Cloud-based BI architecture takes the flexibility of the modern approach and adds nearly limitless scale and impressive cost-efficiency. By running the entire BI stack on platforms like AWS, Azure, or Google Cloud, companies can sidestep the huge upfront costs of buying and maintaining their own hardware.
This model has truly leveled the playing field. A startup can now spin up a powerful data warehouse in a matter of hours and pay only for what it uses. This pay-as-you-go model lets businesses scale their analytics power up or down instantly. It’s no surprise that cloud deployment is reshaping the industry, with the overall BI market projected to grow from USD 34.82 billion to a massive USD 63.20 billion by 2032. You can dig deeper into these BI market trends and projections.
Comparing BI Architecture Models
To help you map out the best path for your organization, the table below breaks down the key differences between these architectural models.
Attribute | Traditional Architecture | Modern Architecture | Cloud-Based Architecture |
|---|---|---|---|
Data Types | Primarily structured data. | Structured, semi-structured, and unstructured data. | All data types, optimized for variety and volume. |
Flexibility | Low; changes are slow and costly. | High; adaptable to new data sources and use cases. | Very high; services can be added or removed on demand. |
Scalability | Limited by physical hardware. | Scalable, but can require complex engineering. | Elastic; scales automatically with business needs. |
Cost Model | High upfront capital expenditure (CapEx). | Mix of CapEx and operational expenditure (OpEx). | Primarily operational expenditure (OpEx); pay-as-you-go. |
Best For | Stable enterprises in regulated industries. | Data-driven companies needing agility and deep analytics. | Businesses of all sizes seeking scalability and cost-efficiency. |
Ultimately, the right architecture often comes down to the tools that support it. To see which platforms align best with each style, take a look at our detailed business intelligence tools comparison.
How Self-Service and AI Are Reshaping BI
A modern business intelligence architecture isn't just a static pipeline for churning out historical reports anymore. It’s become a living, breathing system, driven by two major forces that have completely changed the game: self-service analytics and artificial intelligence. Together, they're redefining who gets to use data and what they can actually accomplish with it.
Not long ago, BI was stuck behind a massive bottleneck. A marketing manager or sales lead would have a question, so they'd file a ticket with the IT or data team. Weeks, or even months, might go by before a report finally landed on their desk. By then, the opportunity had often passed, creating a culture where business users were completely dependent on a small group of specialists.

The Rise of Self-Service BI
Self-service BI completely flips that old model on its head. It puts the power to explore data, build visualizations, and find answers directly into the hands of non-technical users. Think of it as giving everyone in the company a key to the data library and a user-friendly map, instead of making them ask a librarian to fetch every single book.
This shift radically accelerates the speed of decision-making. A product manager can now dig into user engagement funnels on their own, without waiting on an analyst. A sales director can drill down into regional performance right in the middle of a team meeting. This isn't just about convenience; it's about the agility your business needs to stay competitive.
The market's explosive growth tells the whole story. As companies work to break free from IT backlogs, the self-service BI market is projected to soar from USD 6.73 billion to an incredible USD 27.32 billion by 2032.
AI Infusion Making BI Proactive
While self-service changes who uses BI, artificial intelligence is changing how it works. AI and machine learning (ML) are transforming BI from a descriptive tool (telling you what happened) into a predictive and prescriptive one (telling you what will happen and what you should do about it).
So instead of just showing a chart of last quarter's sales figures, an AI-powered BI platform can spot hidden patterns, flag anomalies, and warn you about a potential dip in a key market before it becomes a real problem. It pushes the whole function from reactive analysis to proactive strategy. The integration of AI also enhances the BI architecture with advanced data prediction capabilities, turning raw data into actionable forecasts.
With AI, your BI system stops being a rearview mirror and becomes a GPS. It doesn't just show you the road you've traveled; it highlights upcoming traffic, suggests faster routes, and helps you reach your destination more efficiently.
Practical Applications in Modern BI
The real magic happens when self-service and AI come together. The best modern BI tools embed AI features directly into the self-service experience, making sophisticated analytics accessible to everyone.
Here’s what that looks like in practice:
Natural Language Query (NLQ): Users can ask questions in plain English, like "Show me the top 5 products by revenue in the Northeast last month," and the system instantly serves up the right chart.
Automated Insights: AI algorithms can scan a dataset and automatically surface the key drivers, outliers, and trends that a human analyst might have easily missed.
Predictive Forecasting: A marketing manager can use built-in ML models to forecast campaign ROI without needing a data science degree to build the model from scratch.
These features dramatically lower the technical barrier to entry for deep analysis, helping create a more data-literate organization from the ground up. To see more of how these technologies fit together, check out our article on the key benefits of AI in self-service analytics. This evolution makes the entire business intelligence architecture more valuable, turning it from a simple reporting tool into an engine for genuine, forward-looking growth.
Best Practices for Designing Your BI Architecture
A truly effective business intelligence architecture isn't just about slapping together a collection of powerful tools. It's the result of deliberate, thoughtful planning. Building a framework that delivers lasting value means striking a careful balance between technical requirements and the realities of your business. These practices are my go-to guide for constructing a data ecosystem that's resilient, user-friendly, and ready for whatever comes next.

Without a clear blueprint, even the most expensive technology stack can fall flat. Following these guidelines will help you sidestep common traps and build an architecture that genuinely serves your organization.
Start with Business Goals, Not Technology
This is the most common mistake I see people make. They get dazzled by the latest tech before they even know what problem they're trying to solve. But a great BI system isn't about having the flashiest tools; it's about solving real-world business challenges.
Before you even look at a single platform, get your key stakeholders in a room—sales, marketing, finance, operations. Your first job is to listen. Translate their biggest headaches and highest priorities into specific data questions. For example, a vague goal like "increase customer retention" needs to become a concrete need to analyze churn signals, product usage trends, and support ticket data.
This "goal-first" approach ensures every piece of your architecture is built with a purpose. It’s how you avoid creating "shelfware"—those expensive tools that look great in a demo but collect dust because they don't solve anyone's actual problems.
Establish Strong Data Governance from Day One
Think of data governance as the rules of the road for your data. It’s the collection of processes and standards that ensure your information is accurate, consistent, and secure. If you treat it as an afterthought, you're signing up for chaos—conflicting reports, potential data breaches, and a complete lack of trust in the numbers.
Strong governance transforms data from a potential liability into a reliable asset. It's the framework that guarantees when two different departments look at "monthly revenue," they are seeing the exact same number, calculated the exact same way.
To get governance right from the start, focus on these areas:
Implement Role-Based Access Control (RBAC): Don't give everyone the keys to the kingdom. Define precisely who can see, edit, and analyze specific datasets to protect sensitive info and prevent accidental mistakes.
Create a Data Dictionary: This is your single source of truth. Document key business metrics, how they're defined, and their calculation logic so everyone is speaking the same language.
Track Data Lineage: Keep a clear map of where your data comes from and every transformation it undergoes. This is absolutely critical for auditing, debugging issues, and building trust in your reports.
Design for Scalability and Future Growth
Your business isn't going to stand still, so why would your BI architecture? A system that works great for 10 users and 100 gigabytes of data will buckle under the pressure of 1,000 users and several terabytes. You have to bake scalability into the design from the very beginning.
This means choosing technologies that can grow with you. Cloud-native data warehouses like Snowflake, Google BigQuery, and Amazon Redshift are popular for a reason—they let you scale storage and compute power independently and on demand. This elastic model is far more flexible and cost-effective than old-school on-premise solutions that demand huge upfront hardware investments.
Just as important is a modular design. By keeping your data integration, storage, and visualization layers loosely connected, you give yourself the freedom to upgrade or swap out individual components down the road without having to tear the whole thing down and start over.
Prioritize User-Friendly Tools and Self-Service
At the end of the day, the true measure of your BI architecture's success is how many people actually use it. If your tools are too complicated for the average business user, they'll be ignored. You'll be left with a powerful, expensive system that only a few data specialists can operate.
To get people excited and engaged, you have to prioritize platforms that offer intuitive, self-service features. Look for tools that empower your team to answer their own questions without having to write a line of code or submit a ticket to the IT department.
These are the features that create a true self-service culture:
Drag-and-Drop Interfaces: Let users build their own reports and dashboards without a steep learning curve.
Natural Language Query (NLQ): Enable people to ask questions in plain English, like Querio does, making data exploration feel as easy as a Google search.
Curated Datasets: Offer pre-built, governed data models that business users can explore with confidence, knowing the data is clean and reliable.
When you democratize data access, you do more than just lighten the load on your technical teams. You foster a more data-literate, agile, and curious organization.
Time to Build Your Strategic Data Blueprint
Think of a business intelligence architecture as more than just a technical diagram. It's the strategic blueprint that guides your entire organization toward making smarter, faster decisions. We’ve covered a lot of ground—from the essential components and data flows to the different models you can build, whether you’re sticking with a traditional warehouse or moving to the cloud. We also touched on how game-changers like AI and self-service BI are reshaping what's possible.
The single most important thing to remember? Your BI architecture isn't a "set it and forget it" project. It’s a living system, one that needs to breathe and evolve right alongside your business. Think of it as a continuous cycle of refining and realigning your data capabilities with your core company goals.
Your next step is to take a hard look at your current data challenges and what you want to achieve. Use the insights and best practices from this guide to start sketching out, or simply improving, a BI framework that truly works for you.
With a well-designed architecture in place, you’ll stop asking "what happened?" and start confidently answering "what should we do next?"
When built with clear goals and your users' needs at the forefront, this framework becomes so much more than just infrastructure. It becomes a real competitive advantage, sparking a data-driven culture that empowers every single team to drive growth and innovation. This is how you make your data start working for you, turning raw information into your most valuable business asset.
Have More Questions About BI Architecture?
When you start digging into BI architecture, a few key questions always seem to surface. Let's tackle some of the most common ones head-on, so you can move forward with a clearer picture.
Data Warehouse vs. Data Lake: What's the Real Difference?
It’s easy to get these two mixed up, but a simple analogy clears things up.
Think of a data warehouse as a highly organized, curated library. Everything inside—the books, the journals—has been carefully selected, processed, and cataloged for a specific purpose. It’s perfect when you need structured information to answer known business questions quickly and reliably, like for your weekly sales reports.
A data lake, however, is more like a giant, unfiltered reservoir. It holds absolutely everything in its raw, natural state: structured transaction logs, semi-structured JSON files, and even unstructured video files. This raw potential is exactly what data scientists love for deep exploration and machine learning, allowing them to discover patterns you didn't even know to look for.
The bottom line is this: a warehouse stores refined information for known questions. A lake stores raw potential to explore the unknown.
How Long Does It Take to Actually Implement a BI Architecture?
This is the classic "how long is a piece of string?" question. The timeline for getting a BI architecture up and running can vary wildly depending on what you're trying to build.
A relatively small project—say, a cloud-based setup for one department pulling from a couple of clean data sources—might only take a few months. But if you’re talking about an enterprise-wide overhaul that needs to wrangle dozens of legacy systems for thousands of users, you could easily be looking at a year or more.
Because of this, most smart companies take an agile, phased approach. Instead of aiming for a massive "big bang" launch that takes forever, they deliver value in smaller, iterative chunks. This way, they build momentum, get crucial user feedback, and show results much faster.
What Are the Most Common Sticking Points in a BI Project?
You might be surprised to learn that the biggest roadblocks in a BI implementation are rarely technical. More often than not, the real challenges have to do with people, planning, and process.
Here are the issues that come up again and again:
Poor Data Quality: The old saying "garbage in, garbage out" is the absolute truth here. If your source data is a mess, your fancy new architecture will only produce beautifully formatted, but still incorrect, reports.
Lack of Clear Business Objectives: Building a system without a solid understanding of the problems you need to solve is a fast track to creating expensive, unused software.
Low User Adoption: If the new tools are confusing or the training isn't there, people will fall back on what they know: spreadsheets. And your investment will sit gathering digital dust.
Failing to Plan for Scalability: An architecture built only for today's data volumes will crumble when your company grows. You have to design for the future from day one.
Getting ahead of these foundational issues is the single most important thing you can do to ensure your project succeeds.
Unlock the full potential of your business intelligence architecture with Querio, the AI-powered platform that lets every team get instant, reliable answers from your data. Eliminate reporting backlogs and empower your teams to move from curiosity to insight in seconds. Start making smarter decisions today with Querio.

