7 Best Data Visualization Examples to Inspire You in 2026
Discover the best data visualization examples from top galleries, platforms, and publications. See how to turn raw data into compelling stories and dashboards.
published
Outrank AI
best data visualization examples, data visualization, data storytelling, dashboard design, business intelligence
686dbdd9-b400-4a64-939d-3ca751bc1a0c

The difference between a good decision and a great one often comes down to how data is presented. In a world saturated with information, creating clear, compelling, and actionable data visualizations is no longer a niche skill for analysts. It’s a core competency for product managers, startup founders, and data leaders responsible for driving growth. But where do you find inspiration that goes beyond standard templates and basic charts? The answer lies in studying the best data visualization examples from across the web.
This guide moves past generic bar graphs and pie charts to explore curated galleries, interactive platforms, and masterful storytelling examples that will inspire your next dashboard, report, or embedded analytics feature. We've compiled the top resources where designers, developers, and journalists showcase groundbreaking work. Exploring diverse visual formats can be incredibly insightful. For instance, even a well-structured organizational chart offers a unique way to represent hierarchy and relationships, pushing beyond simple bars and lines to convey complex structures clearly.
For each resource listed, we will break down what makes it a valuable source of inspiration and provide actionable takeaways. You'll learn not just what looks good, but why it works from a strategic and user-experience perspective. We’ll also provide practical tips on how you can recreate these high-impact visuals using modern, flexible tools like Querio, transforming raw numbers into strategic insights that command attention and drive action. Let's dive into the examples that set the standard for effective data communication.
1. Visualizations | Querio Documentation
Kicking off our list is a uniquely practical and powerful resource: the official visualization gallery from Querio's documentation. While not a single dashboard, this curated library serves as a strategic launchpad for creating high-impact visuals, making it one of the best data visualization examples for teams aiming to build a strong, consistent reporting foundation. It’s designed less for passive inspiration and more for active implementation, providing the structural and conceptual building blocks for excellent data storytelling.
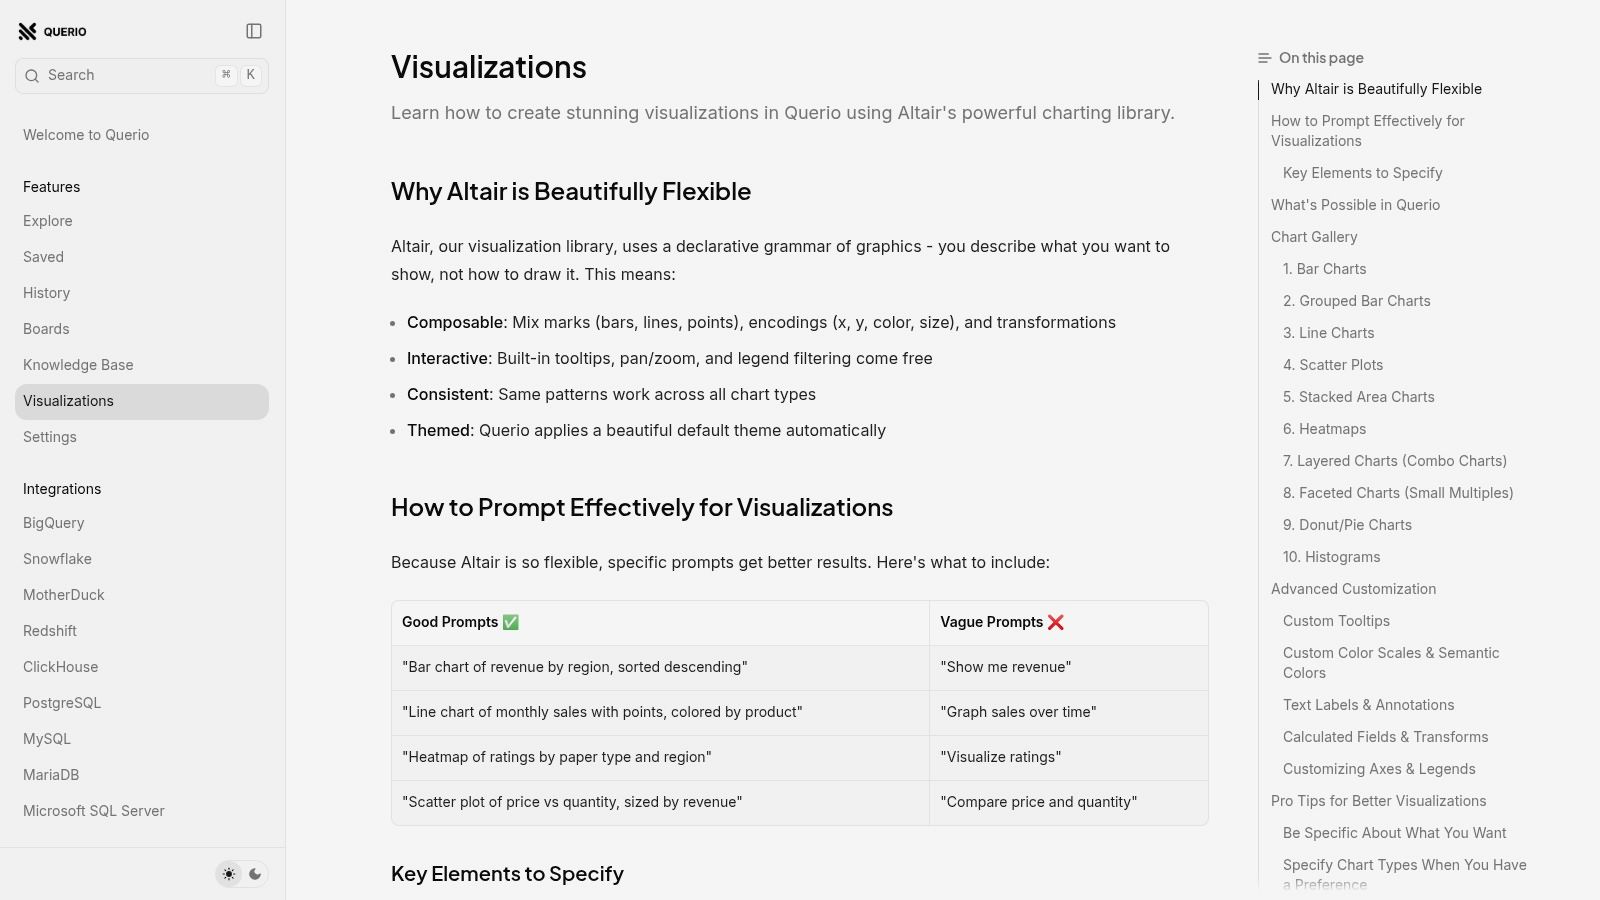
What makes this resource stand out is its direct, actionable approach. It bypasses abstract theory and focuses on pairing common business questions with optimal chart types. For product managers, startup founders, and data leaders, this eliminates guesswork and accelerates the time from query to insight.
Why It's Our Top Choice
The Querio documentation excels by providing a standardized toolkit that empowers both technical and non-technical users to make informed design choices quickly. Instead of just showing finished charts, it gives you the recipe to create them.
Strategic Takeaway: The most effective data cultures are built on a shared visual language. This library provides a prescriptive yet flexible framework, helping teams standardize how they represent key metrics like user growth, financial trends, and feature engagement.
This approach is particularly valuable for organizations scaling their data operations. It ensures that as more team members create dashboards and reports, the results remain consistent, clear, and strategically aligned.
Deep Dive: Key Features & Strengths
Querio's visualization guide is built around a few core principles that make it exceptionally effective for modern data teams.
Actionable "Best For" Guidance: Each chart type, from a simple bar chart to a complex heatmap, includes a clear "Best for" description. This guidance connects the visual format directly to an analytical goal, such as "Comparing values across categories" for bar charts or "Visualizing the relationship between two variables" for scatter plots.
Ready-to-Use Prompts: The platform provides concrete example prompts that can be copied and used directly within Querio's AI agent or visualization builder. This dramatically speeds up prototyping and empowers users who may not know how to phrase a complex data request.
Broad Chart Coverage: The library includes a comprehensive set of visualizations, covering everything from fundamental line and pie charts to advanced options like stacked area charts and heatmaps. This breadth supports a wide range of analytical needs, from high-level executive summaries to granular operational dashboards.
Seamless Platform Integration: As part of the Querio ecosystem, these examples are designed to work flawlessly with its context-aware AI and secure embedded analytics features. This means a chart prototyped from the documentation can be quickly generated with your live data and securely embedded into your application or internal portal. To explore this further, you can read about how AI enhances data visualization dashboards.
Practical Application & Replicating Success
To make the most of this resource, focus on aligning your analytical questions with the provided templates.
Define Your Question: Start with a clear business question, such as "Which marketing channels are driving the most user signups this quarter?"
Match to a Chart Type: Browse the documentation to find the visualization best suited for that question. In this case, a Grouped Bar Chart would be ideal for comparing signups across multiple channels over time.
Adapt the Prompt: Copy the example prompt and modify it to match your specific data schema (e.g., table names, column headers).
Generate and Iterate: Use the adapted prompt in the Querio platform to generate the visual. From there, you can apply filters, change colors, and refine the design before embedding it in a dashboard.
Access and Platform Details
The visualization documentation is publicly accessible and free to browse. However, to generate interactive charts, connect your own data, and use the embedding features, you'll need access to the Querio platform, which requires an appropriate subscription plan and credentials. The user interface is clean and developer-friendly, designed to facilitate a smooth transition from example to implementation.
Website: https://docs.querio.ai/features/visualizations
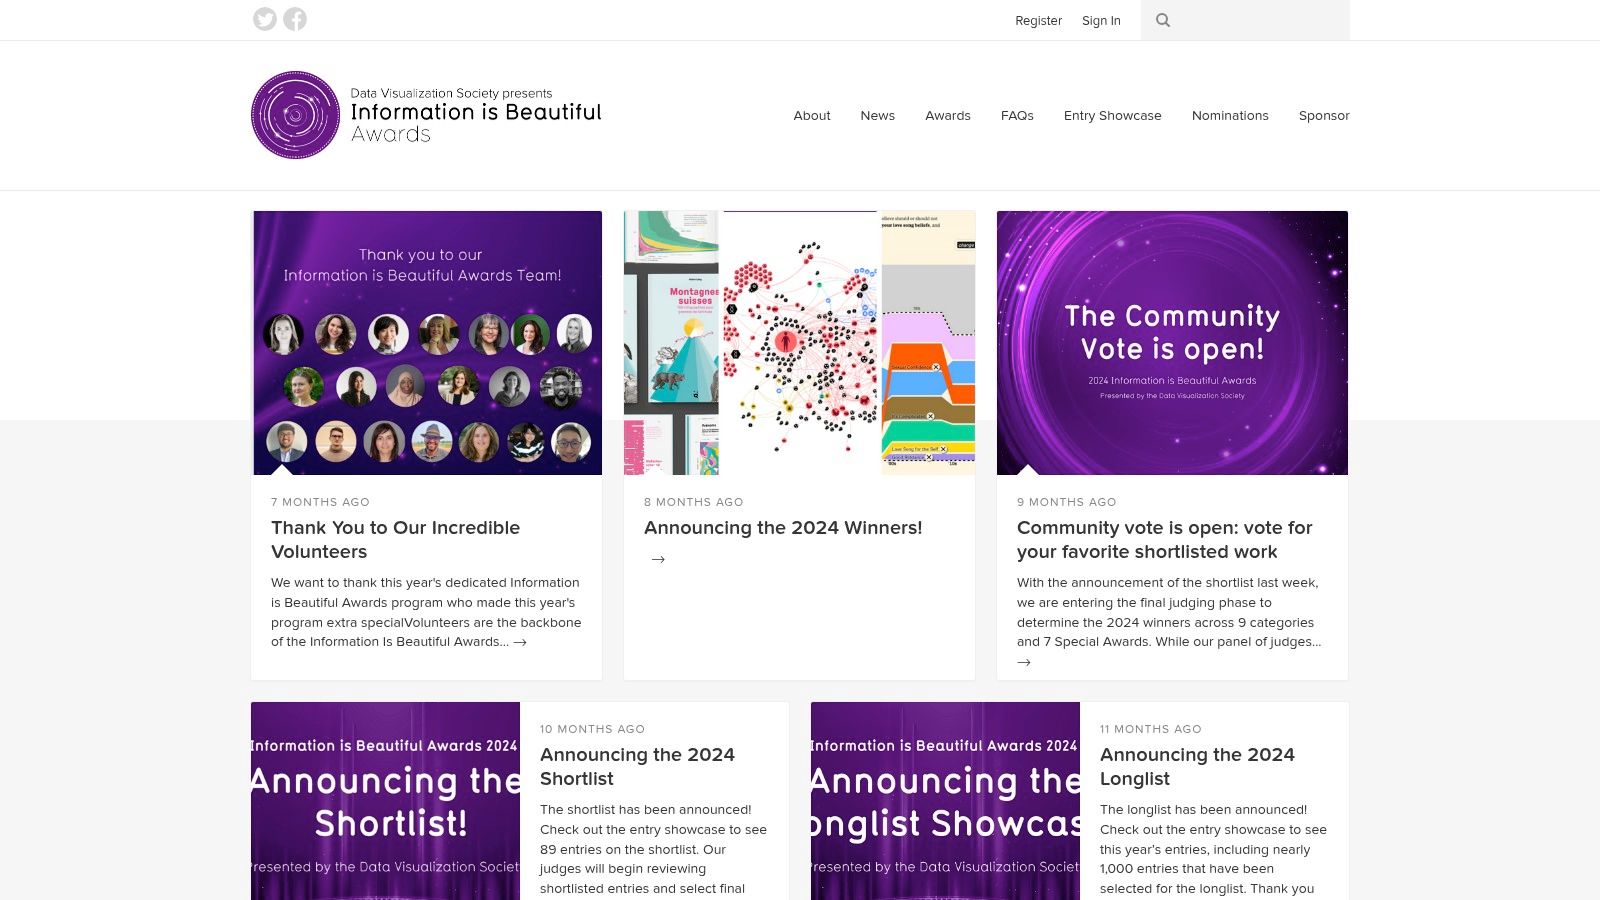
2. Information is Beautiful Awards
The Information is Beautiful Awards website is less a single tool and more an expertly curated, annual gallery of the world's most compelling and impactful data visualizations. It’s an indispensable resource for anyone seeking inspiration, serving as a benchmark for excellence in data storytelling across journalism, business, science, and art. The platform showcases winners, shortlists, and longlists dating back to 2012.
This annual showcase provides some of the best data visualization examples you can find, demonstrating what's possible when creative design meets complex data. Exploring the archives is like taking a masterclass in visual communication, offering a clear view of how visualization trends and techniques have evolved.
Why It’s a Top Resource
What makes this site unique is its focus on the narrative and aesthetic quality of data visualization, judged by a panel of experts alongside a community vote. Unlike tool-specific galleries, this collection prioritizes the final product's impact and clarity over the technology used to create it. It’s a pure-play inspiration engine for product managers, founders, and data leaders looking to elevate their own reporting beyond standard charts.
Key Takeaway: Use the Information is Beautiful Awards not for technical tutorials, but for strategic inspiration. Analyze how winners frame a narrative, use color to guide attention, and choose unconventional chart types to make a powerful statement.
Actionable Tips for Product & Data Teams
The site is completely free to access and browse, making it an accessible resource for any team. While the showcase format doesn't provide technical implementation details, its value lies in strategic guidance.
Benchmark Your Dashboards: Browse the "Business Analytics" or "Corporate" categories to see how award-winning projects present KPIs. Notice how they often combine multiple metrics into a single, cohesive story rather than a disjointed grid of charts.
Inspire Your Team: During a product or analytics planning session, have your team review a few relevant examples. Discuss the storytelling techniques. How could you apply similar principles to your user engagement funnels or churn reports in Querio?
Explore Interactivity: Many winning entries are interactive. Study how they use filters, tooltips, and drill-downs to allow users to explore the data without feeling overwhelmed. This provides excellent UX patterns for building self-serve analytics dashboards.
Feature Analysis | Description |
|---|---|
Content Focus | Curated gallery of award-winning data visualizations. |
Primary Use Case | Inspiration, benchmarking design standards, and storytelling techniques. |
Access | Free and open to the public. |
Pros | High-quality, expert-vetted examples; historical archive for trend analysis. |
Cons | Lacks technical "how-to" details; some older examples use outdated tech. |
By regularly visiting the Information is Beautiful Awards (https://www.informationisbeautifulawards.com), your team can stay on top of best practices in visual communication and find innovative ways to present data that truly resonates with stakeholders.
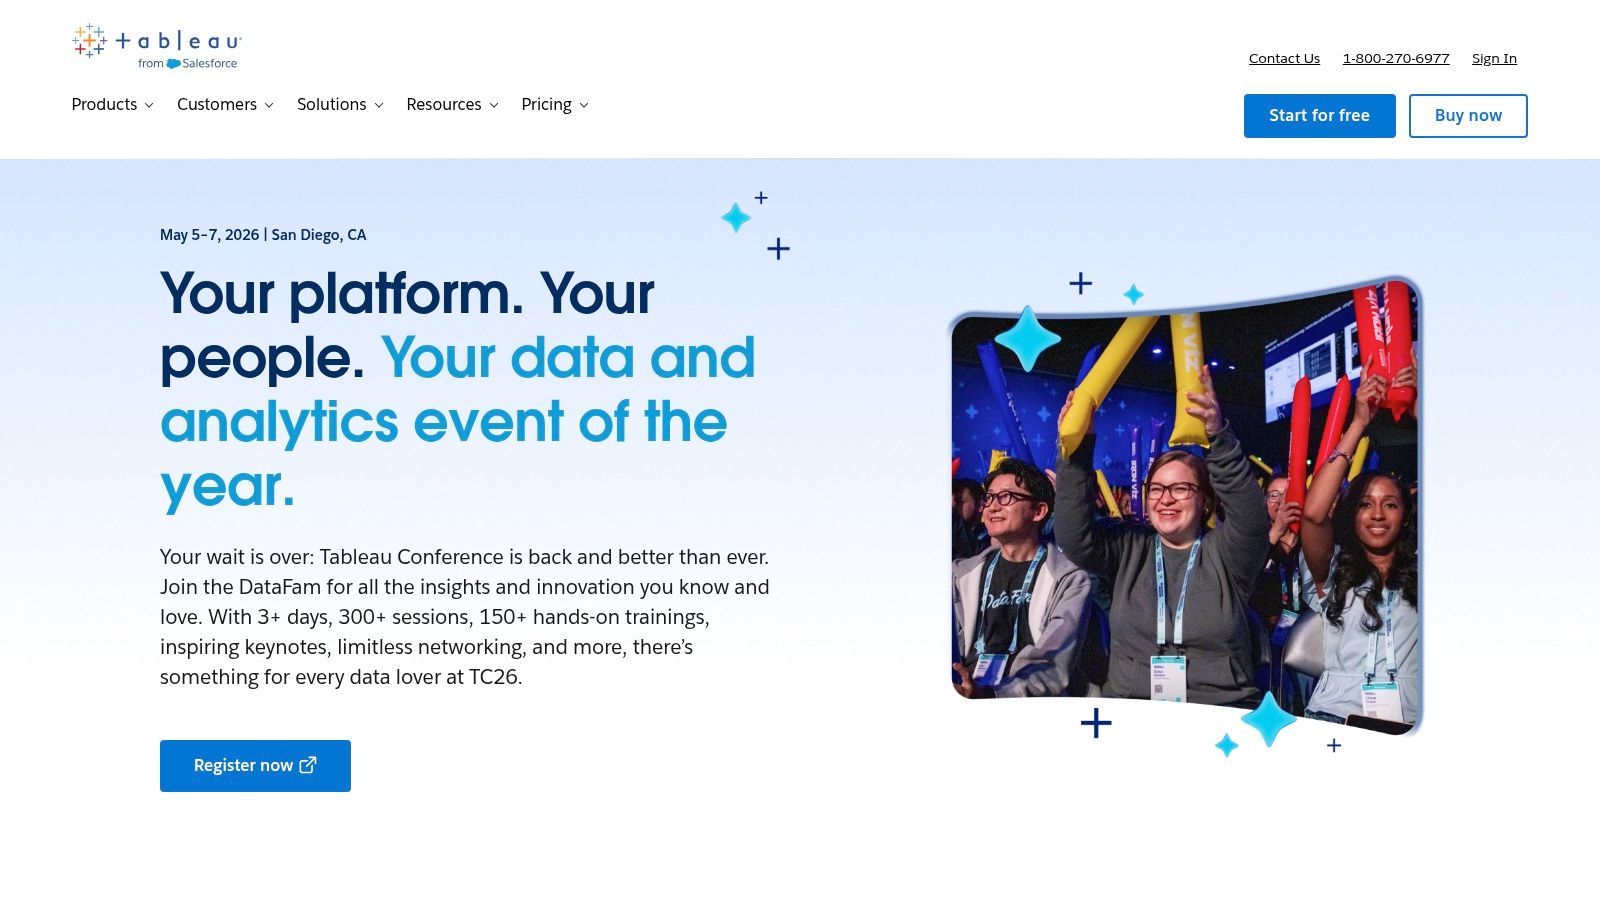
3. Tableau Public Viz Gallery
Tableau Public is a massive, community-driven platform where creators publish interactive data visualizations. It serves as both a portfolio for data professionals and a vast learning library for anyone looking to build compelling dashboards. Its gallery features a "Viz of the Day" and thousands of user-submitted examples, making it one of the most dynamic sources for real-world data storytelling.
Unlike curated award sites, Tableau Public offers a ground-level view of how professionals and hobbyists alike tackle data problems. This makes it an excellent place to find some of the best data visualization examples that are not just beautiful but also highly functional and often built on publicly available datasets, making them perfect for hands-on learning.
Why It’s a Top Resource
The key differentiator for Tableau Public is its practicality and accessibility. Many authors allow their workbooks to be downloaded, which means you can deconstruct their dashboards layer by layer. This reverse-engineering process is invaluable for understanding how complex charts are built, how calculations are structured, and how interactivity is implemented. It bridges the gap between inspiration and execution. For a deeper look at how Tableau compares with modern BI tools, you can explore this Querio vs Tableau breakdown.
Key Takeaway: Use Tableau Public as a hands-on technical workshop. Find a dashboard that aligns with your business needs, download the workbook, and analyze its construction to learn specific techniques you can apply to your own projects.
Actionable Tips for Product & Data Teams
Access to view and interact with visualizations on Tableau Public is completely free. The ability to download workbooks depends on the author's permissions.
Deconstruct Winning Dashboards: Use the "Viz of the Day" section to find high-quality examples. When a workbook is downloadable, open it to study the data source connections, calculated fields, and dashboard actions. This is the fastest way to learn advanced charting and UX techniques.
Prototype New Reports: Find a visualization that presents data similar to yours (e.g., user journey, sales pipeline). Use its structure and chart choices as a template to mock up your next dashboard in Querio, saving significant design and development time.
Learn Niche Chart Types: Looking for a Sankey diagram or a Hexbin map? Search the gallery. You'll find hundreds of examples and downloadable workbooks that show you exactly how to build them, providing a practical blueprint for expanding your team's visualization vocabulary.
Feature Analysis | Description |
|---|---|
Content Focus | Community-driven gallery of interactive dashboards. |
Primary Use Case | Technical learning, dashboard prototyping, and practical inspiration. |
Access | Free to browse and interact; workbook downloads are author-dependent. |
Pros | Enormous volume and variety; many workbooks are downloadable for deconstruction. |
Cons | Quality is highly variable; requires vetting to find best-practice examples. |
By leveraging the Tableau Public Viz Gallery (https://public.tableau.com/app/discover), your team can move beyond theoretical knowledge and gain practical skills by dissecting real-world dashboards built by a global community of data practitioners.
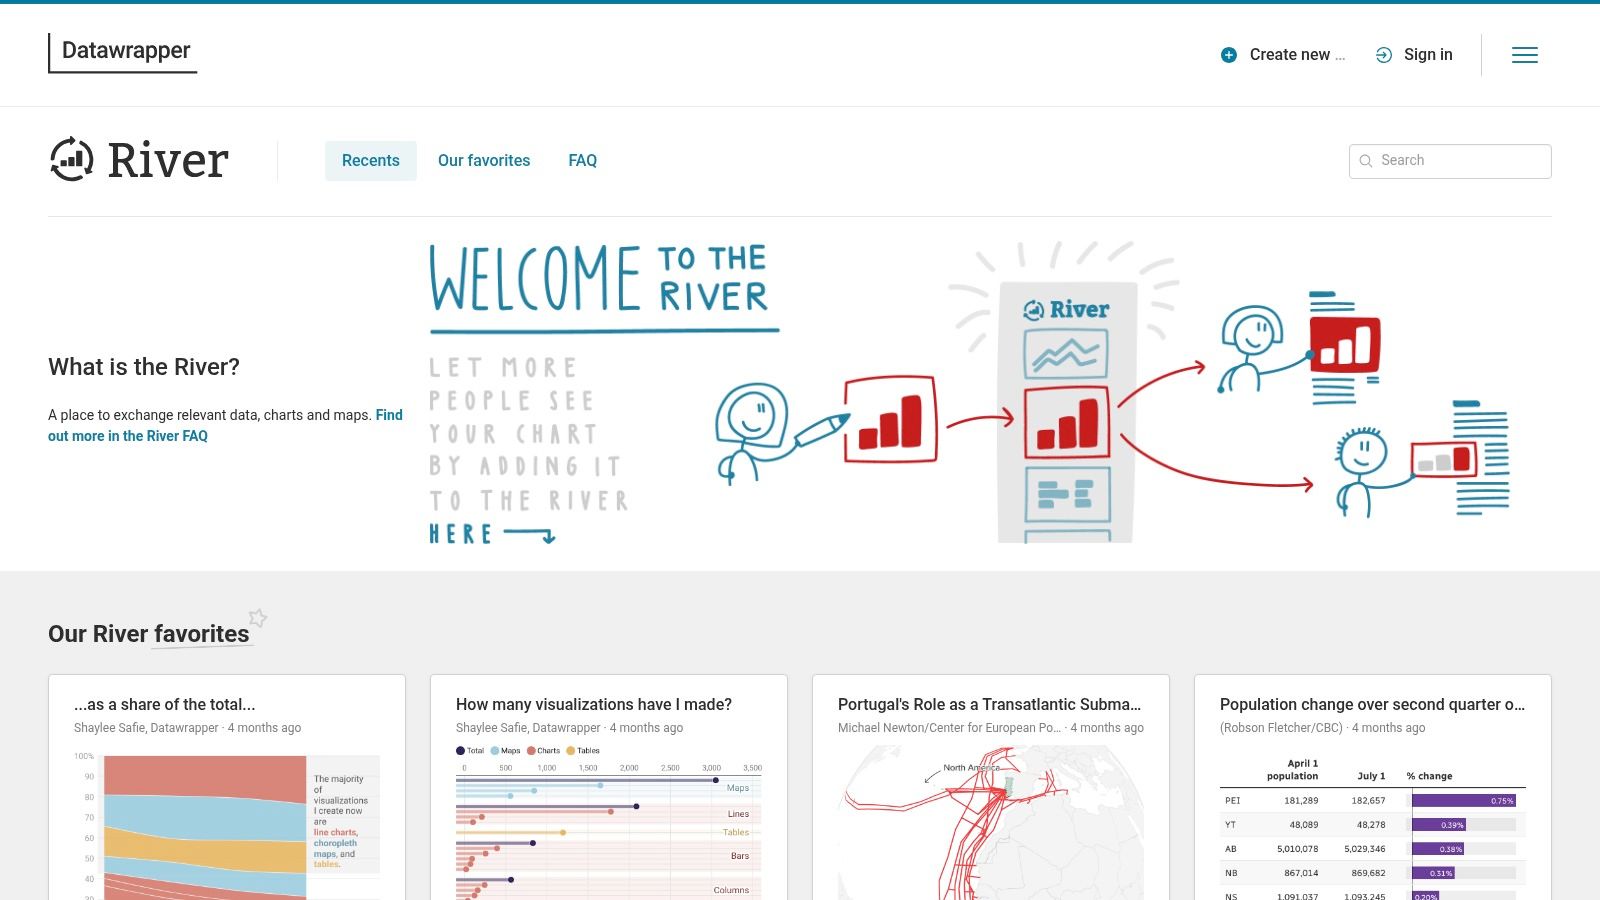
4. Datawrapper River
Datawrapper River is a community-driven gallery showcasing charts, maps, and tables created with the Datawrapper tool. It acts as both an inspiration hub and a practical starting point, bridging the gap between seeing a great visualization and creating your own. The platform is especially powerful for teams in newsrooms, marketing, and analytics who need to produce clean, effective visuals quickly.
Unlike purely inspirational galleries, River is built for action. It provides some of the best data visualization examples with a unique twist: many charts can be opened directly in the Datawrapper editor with a single click. This transforms passive viewing into an active learning and prototyping experience, making it an invaluable resource for rapid implementation.
Why It’s a Top Resource
The key differentiator for Datawrapper River is its focus on reusability and education. The platform isn't just a showcase; it's an integrated part of the Datawrapper ecosystem. It often links directly to Datawrapper Academy articles explaining the methodology or design choices behind a specific chart. This makes it a fantastic tool for product and data teams who need not just ideas, but also a clear path to execution without deep coding knowledge.
Key Takeaway: Use Datawrapper River to accelerate your workflow from concept to a live chart. Find a visualization that tells a similar story to the one you need, open it, replace the data with your own, and customize it for your brand.
Actionable Tips for Product & Data Teams
The platform is free to browse, and many charts are available for one-click reuse within a free Datawrapper account. This low barrier to entry makes it perfect for fast-paced environments.
Prototype Dashboards Quickly: Before committing engineering resources, use River to find a chart type that fits your metric. You can quickly plug in sample data in Querio, export it, and import it into a reused Datawrapper chart to create a high-fidelity prototype for stakeholder feedback.
Standardize Your Visuals: Have your team browse the curated "Favorites" section to establish a shared understanding of what makes a clear and compelling chart. The minimalist, newsroom-style aesthetic of Datawrapper is a great benchmark for internal reporting.
Learn New Charting Techniques: Look for interesting examples and follow the links to associated Academy articles. This can help your team learn how to properly use less common chart types like slope charts or area charts for specific analytical narratives, such as showing change over time.
Feature Analysis | Description |
|---|---|
Content Focus | Community gallery of charts, maps, and tables built with Datawrapper. |
Primary Use Case | Inspiration, rapid prototyping, and learning visualization best practices. |
Access | Free to browse and reuse charts with a Datawrapper account. |
Pros | Low friction from inspiration to implementation; excellent for non-coders. |
Cons | Primarily shows what's possible within Datawrapper; less code-level customization. |
By using Datawrapper River (https://river.datawrapper.de), your team can find practical and high-quality examples to not only inspire your next dashboard but also build it in a fraction of the time.
5. Observable (ObservableHQ)
Observable is an interactive, notebook-based platform where developers, data scientists, and analysts can build and share live data visualizations. It serves as both a powerful development environment and a vast gallery of best data visualization examples, hosting the official D3.js gallery and thousands of community-created notebooks. Its "forkable" nature means any visualization can be instantly copied, edited, and repurposed.
This platform is a go-to resource for teams that need to move beyond standard chart libraries and build custom, interactive data experiences. Unlike static galleries, Observable provides the live code behind every visualization, allowing for deep technical inspection and rapid prototyping of sophisticated, bespoke charts using JavaScript libraries like D3.js and Observable Plot.
Why It’s a Top Resource
Observable’s key differentiator is its technical transparency and interactivity. Every example is a living document where you can see the code, the data, and the final output side-by-side. This makes it an unparalleled learning tool for understanding the mechanics of advanced visualizations and an incredibly efficient workflow for developing custom components for embedded analytics.
Key Takeaway: Use Observable when you need to understand the "how" behind a complex visualization. It’s the ultimate resource for developers and data engineers tasked with building unique, interactive charts that go beyond the capabilities of off-the-shelf BI tools.
Actionable Tips for Product & Data Teams
The platform offers a robust free tier for public notebooks and individual use, with paid plans available for private team collaboration and enterprise features. Its value lies in bridging the gap between design inspiration and technical implementation.
Deconstruct Advanced Visuals: Find a visualization that aligns with your product's data storytelling goals. Fork the notebook to see exactly how it’s built, what data structures it requires, and how interactivity is handled. This is invaluable for scoping custom development work.
Prototype Embedded Analytics: Before committing to a complex build, use an Observable notebook to create a proof-of-concept. Test different chart types, interactions, and data connections in a live environment to validate your approach with stakeholders.
Level-Up Your Team's Skills: Encourage your data and engineering teams to explore the official D3 and Plot galleries on Observable. They provide modern, well-documented examples that can teach them advanced techniques for presenting complex data within your Querio dashboards.
Feature Analysis | Description |
|---|---|
Content Focus | Live, editable notebooks with code for D3, Plot, and other JS libraries. |
Primary Use Case | Prototyping custom visualizations, learning advanced techniques, and technical implementation. |
Access | Free for public notebooks; paid tiers for private team workspaces. |
Pros | Unmatched technical transparency; vibrant community with extensive examples. |
Cons | Requires JavaScript/D3 knowledge for deep customization; pricing can be a factor for teams. |
By leveraging Observable (https://observablehq.com), your team can quickly move from inspiration to implementation, creating the exact data visualizations your product or stakeholders need without being limited by standard tools.
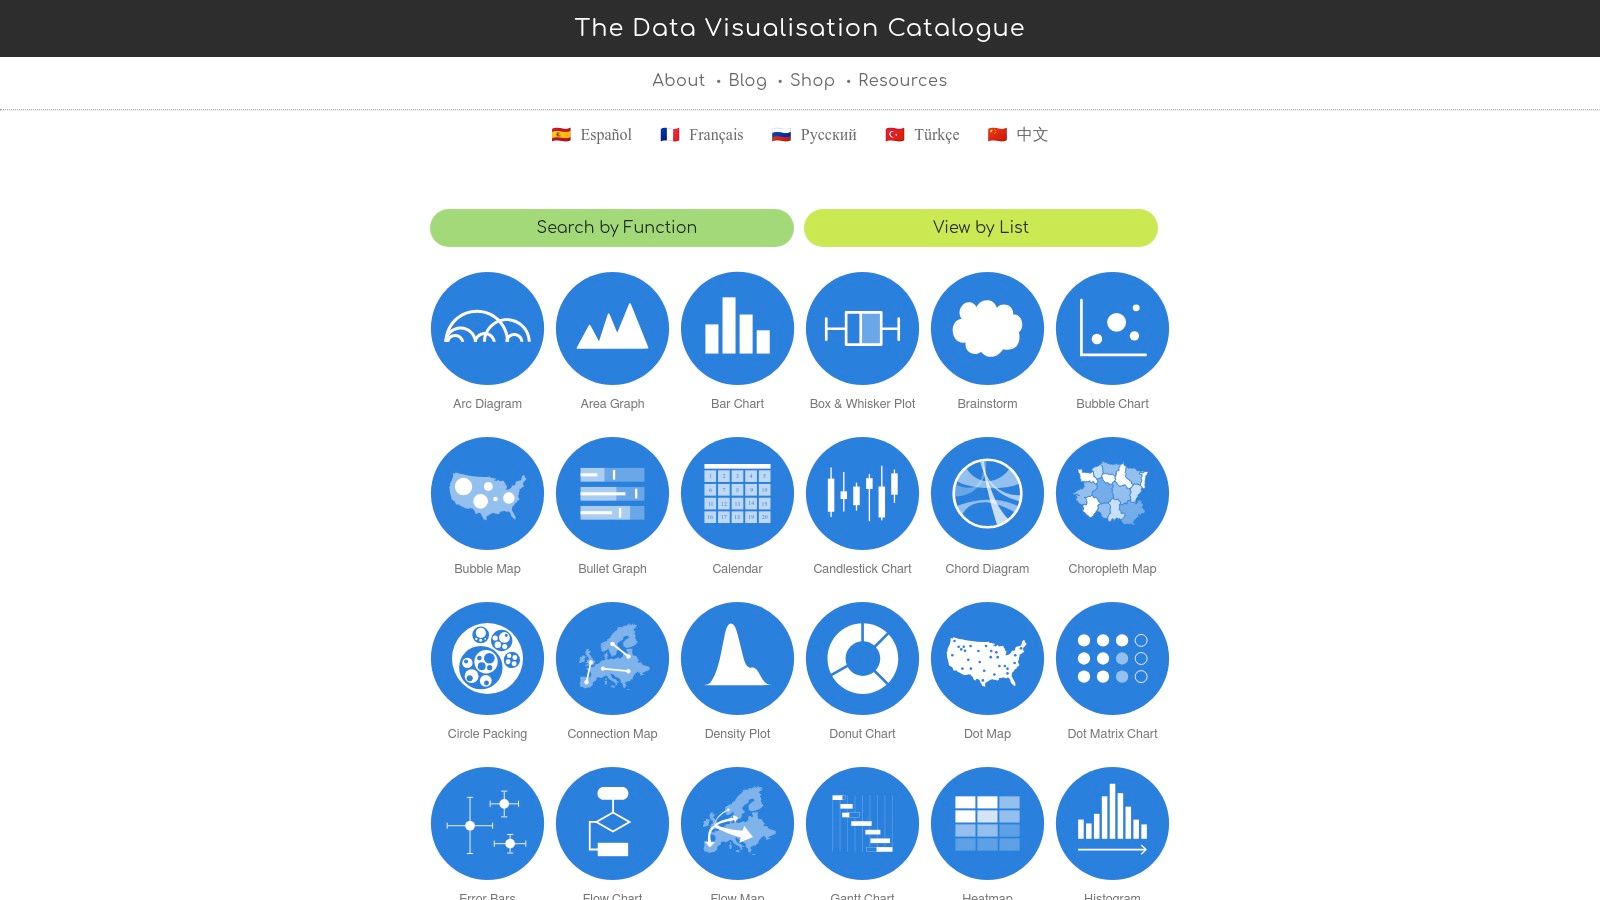
6. The Data Visualization Catalogue
The Data Visualization Catalogue is not a gallery of finished dashboards but an essential foundational resource. It serves as a comprehensive encyclopedia of chart types, meticulously organized and explained in plain language. For any team looking to standardize its visual language, it's the perfect reference guide to ensure everyone from engineers to marketers is choosing the right chart for the right data story.
This catalogue is one of the best data visualization examples of a practical educational tool. It demystifies the process of chart selection by breaking down over 60 different visualization types, detailing their function, anatomy, and common use cases. This helps teams move beyond basic bar and line charts to more nuanced and effective visual representations.
Why It’s a Top Resource
What makes this resource invaluable is its function-first organization. Users can search for charts based on the analytical task they need to perform, such as comparing data, showing distribution, or revealing relationships. This practical approach empowers non-analysts to make informed decisions about visualization, fostering a more data-literate culture across an organization. It’s less about inspiration and more about education and alignment.
Key Takeaway: Use The Data Visualization Catalogue as a definitive team reference. It builds a shared vocabulary and set of principles for chart selection, preventing misinterpretations and ensuring analytical consistency across all company reports and dashboards.
Actionable Tips for Product & Data Teams
The website is entirely free to use, though an offline eBook is available for purchase. Its true value is in establishing internal best practices.
Standardize Your Chart Library: Before building a new dashboard in Querio, have your team consult the catalogue to agree on the most effective chart type. Use its descriptions to create an internal wiki or style guide for your company's analytics.
Train Your Team: Use the catalogue as a training tool for new hires or non-technical team members. A short session walking through different chart functions can dramatically improve the quality of data requests and discussions. For a deeper dive into this topic, explore our data visualization guide to choosing the right charts.
Challenge Default Choices: If your team always defaults to a pie chart for parts-of-a-whole data, use the catalogue to introduce and explain alternatives like a treemap or a stacked bar chart. Discuss the pros and cons of each in the context of your specific data.
Feature Analysis | Description |
|---|---|
Content Focus | An educational index of 60+ chart types with explanations and use cases. |
Primary Use Case | Reference guide for chart selection, team training, and standardizing analytics. |
Access | Free and open to the public; an ad-free eBook is available for purchase. |
Pros | Clear, non-technical guidance; excellent for building cross-functional alignment. |
Cons | Examples are static references, not interactive tutorials; lacks end-to-end build guides. |
By bookmarking The Data Visualization Catalogue (https://datavizcatalogue.com), you provide your team with a powerful tool to build a common language for data, ensuring that every chart you create is both accurate and impactful.
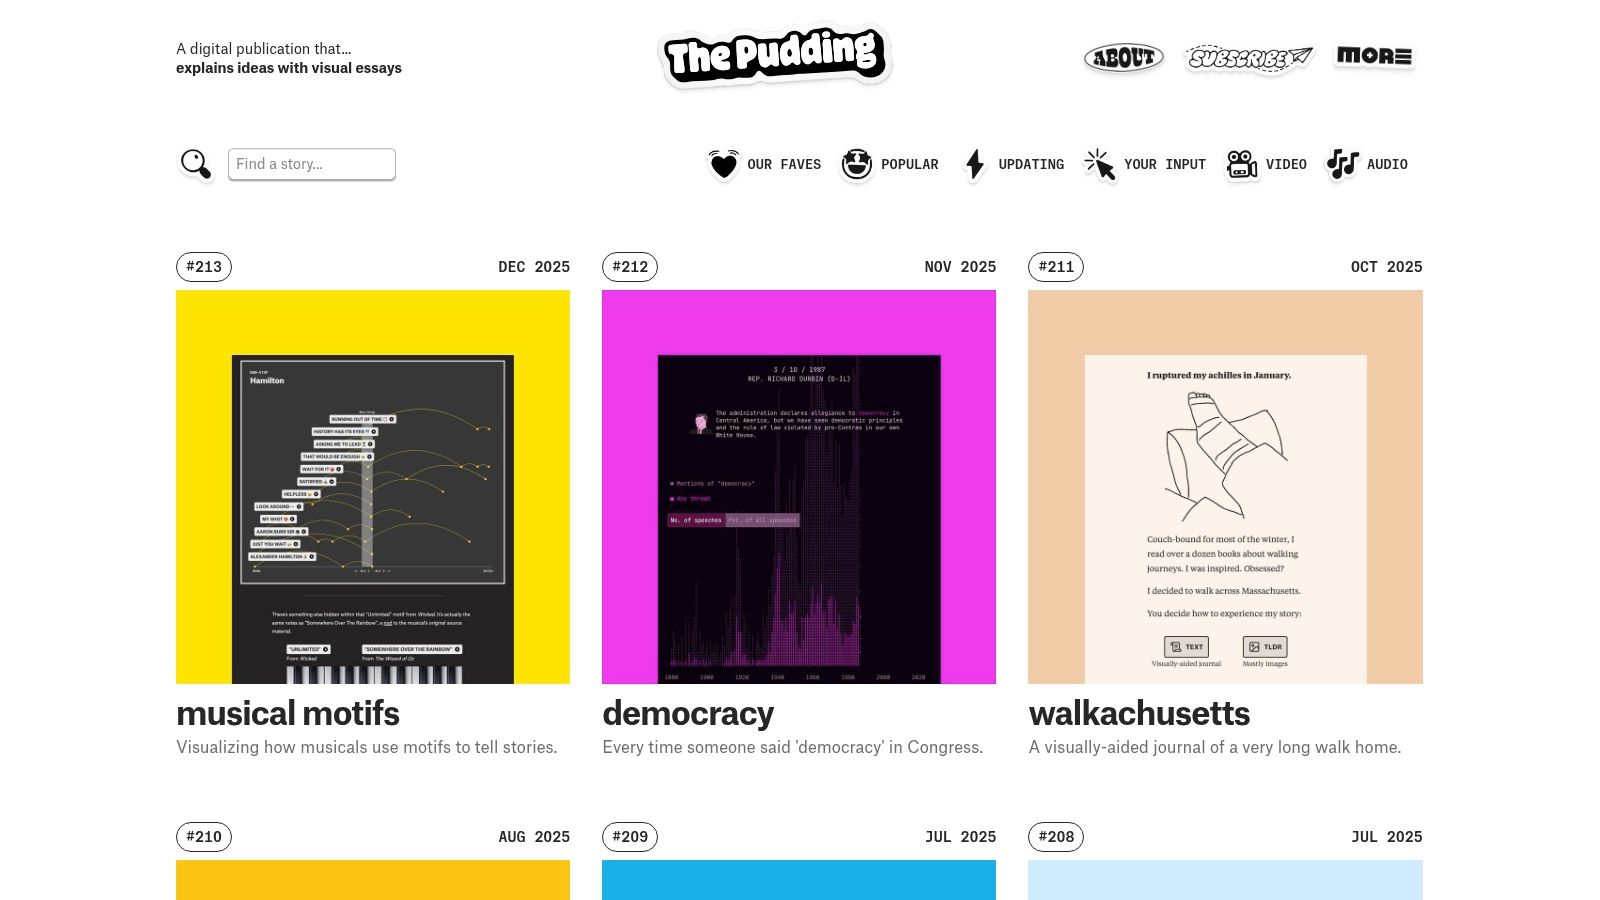
7. The Pudding
The Pudding is a digital publication that explains ideas debated in culture with visual, data-driven essays. It stands out by transforming complex topics into engaging, interactive narratives, making it a goldmine for anyone looking to master the art of data storytelling. Each piece is a meticulously crafted, high-polish project that often feels more like a digital experience than a simple article.
This site offers some of the best data visualization examples for narrative-driven projects, showcasing how to guide a user through a story from start to finish. Exploring their work demonstrates the power of combining journalism, custom visualization, and user interaction to create memorable and persuasive content.
Why It’s a Top Resource
What sets The Pudding apart is its unwavering commitment to storytelling craft. Each visualization is custom-built to serve the narrative, not the other way around. Unlike platforms that showcase standalone charts, The Pudding integrates data directly into a linear, unfolding story. This makes it an essential resource for product marketing teams, content creators, and founders aiming to create impactful data-driven marketing campaigns or compelling in-app educational walkthroughs.
Key Takeaway: Study The Pudding for its narrative structure. Analyze how they introduce a topic, present data points sequentially to build an argument, and use interactivity to personalize the experience for the reader.
Actionable Tips for Product & Data Teams
The entire site is free to access, offering a wealth of inspiration without a subscription. While the projects are bespoke and not easily replicable templates, the underlying principles are universally applicable.
Elevate Marketing Content: Instead of just a blog post with static charts, consider how you could create a "Pudding-style" interactive piece about your industry. Use this approach to show, not just tell, how your product solves a key problem.
Improve User Onboarding: Analyze how The Pudding’s essays guide users step-by-step through complex data. Apply these interactive storytelling techniques to your product’s onboarding flow to explain key features and demonstrate value more effectively.
Find New Story Angles: Use The Pudding's work as a creative spark. If you're struggling with how to present a dataset, their unconventional approaches can help you find fresh narratives. Explore our data visualization ideas generator for more ways to kickstart your creative process.
Feature Analysis | Description |
|---|---|
Content Focus | High-polish, interactive visual essays and narrative data stories. |
Primary Use Case | Inspiration for storytelling, narrative design, and data-driven marketing. |
Access | Free and open to the public. |
Pros | Masterclass in narrative design; US-based topics with broad appeal. |
Cons | Projects are highly custom and not turnkey templates; code is not always shared. |
By dissecting the projects on The Pudding (https://pudding.cool), your team can learn to build more than just dashboards. You can learn to build persuasive, data-backed experiences that captivate your audience and drive action.
Top 7 Data Visualization Examples Comparison
Example | 🔄 Implementation complexity | ⚡ Resource & technical requirements | 📊 Expected outcomes & impact | 💡 Ideal use cases | ⭐ Key advantages |
|---|---|---|---|---|---|
Visualizations | Querio Documentation | Low–Medium — templates plus platform integration | Requires Querio account, clean data and permissions | Standardized reporting, fast prototyping, embedded analytics | Ready-to-use prompts, AI + enterprise integration |
Information is Beautiful Awards | Low — browse and learn | Minimal — web access; not implementation-focused | High-quality inspiration and benchmarking | Design/storytelling inspiration, trend spotting | Expert-curated, high-signal examples |
Tableau Public Viz Gallery | Low–Medium — view or download workbooks | Tableau Desktop/Reader for edits; community support | Actionable dashboards you can inspect and adapt | Learning, remixing real dashboards, prototyping | Large, diverse interactive examples; downloadable |
Datawrapper River | Low — one-click reuse and adapt | Datawrapper account for editing; non-coder friendly | Fast prototyping and newsroom-ready visuals | Newsroom visuals, non-coders, quick embeds | One-click reuse + integrated tutorials |
Observable (ObservableHQ) | High — code-focused notebook workflow | JavaScript/D3/Plot skills; dev time; optional paid workspaces | Fully custom, embeddable interactive components | Developers building bespoke or embedded charts | Fork-and-edit transparency; deep technical examples |
The Data Visualization Catalogue | Low — reference-first | Minimal — web access; optional eBook | Clear chart selection and team alignment | Training, chart choice guidance, standards | Plain-language explanations; quick reference |
The Pudding | High — custom narrative projects | Creative editorial, designers, devs, data journalists | High-polish narrative pieces with strong engagement | Narrative storytelling, product/marketing showcases | Exemplary storytelling and innovative techniques |
From Inspiration to Implementation: Build Your Next Visualization
We've journeyed through a diverse landscape of the best data visualization examples, from the award-winning artistic narratives showcased by Information is Beautiful to the practical, endlessly explorable dashboards in the Tableau Public gallery. Each example, whether it's a dynamic Observable notebook or a clean, effective chart from The Data Visualization Catalogue, reinforces a central truth: great visualization is not just about presenting data; it's about telling a compelling, actionable story.
The core lesson from these top-tier examples is the power of intention. The most effective visuals are built with a clear purpose, a deep understanding of the audience, and a relentless focus on clarity. They transform raw numbers from a source of confusion into a catalyst for decisive action.
Synthesizing the Key Takeaways
As you move from inspiration to your own implementation, remember the foundational principles we've uncovered. These are the threads that connect all the best data visualization examples we've explored.
Clarity Over Complexity: The goal is insight, not artistic flair for its own sake. A simple, well-labeled bar chart that drives a decision is infinitely more valuable than a visually stunning but confusing radial diagram. Always ask: "Does this make the core message easier to understand?"
Audience-Centric Design: A dashboard for a startup founder tracking runway needs to be direct and high-level. An embedded analytics UI for a SaaS customer tracking their own usage requires more granular detail and interactivity. Tailor your charts, metrics, and level of detail to the person who will be using them.
Narrative is Non-Negotiable: Data points are just facts; a narrative gives them meaning. As seen in examples from The Pudding, guiding your audience through the data with annotations, logical flow, and a clear story arc makes the insights memorable and impactful.
Interactivity Drives Engagement: Static charts provide a single answer. Interactive visualizations, like those found in the Tableau and Observable communities, invite exploration and empower users to ask and answer their own follow-up questions. This moves them from passive consumption to active analysis.
Your Action Plan for Building Better Visualizations
Feeling inspired is the first step, but turning that inspiration into a tangible, high-impact dashboard or report is what truly matters. Here is a practical roadmap to get started.
Define the "One Question": Before you choose a chart type or connect to a data source, articulate the single most important question this visualization needs to answer. This North Star will guide every design decision you make.
Sketch and Prototype First: Don't jump straight into a tool. Use a whiteboard or a simple design tool to sketch out your layout. This low-fidelity approach allows you to focus on the structure and user flow without getting bogged down in technical details.
Choose the Right Tool for the Job: Your tool should accelerate, not hinder, your progress. For data scientists and engineers who need deep customization, a code-first platform like Observable is ideal. For business users who need to build and share dashboards quickly, a user-friendly BI platform is a better fit.
Iterate with Real User Feedback: The first version of your visualization is never the final version. Share your draft with your target audience. Watch how they use it. Ask them what’s confusing. Their feedback is the most valuable resource you have for refinement.
Ultimately, the journey to creating world-class data visualizations is one of continuous learning and practice. Use the resources we've covered not as a static gallery, but as a living library of ideas and techniques. By combining these proven strategies with the right modern tools, you can bridge the gap between complex data and the clear, actionable insights your team needs to succeed.
Ready to move from inspiration to implementation without the traditional complexity? Querio empowers your entire team to build stunning, interactive dashboards and embedded analytics using natural language, turning questions into insights in seconds. See how the best data visualization examples can be built faster than ever by exploring Querio today.

