Business Intelligence
What is data insight?
Transform raw data into actionable insights through structured processes, AI automation, and best practices for improved business decision-making.
Data insight is the process of turning raw data into actionable knowledge. It helps businesses understand patterns, identify opportunities, and make better decisions. Here’s the key breakdown:
Raw Data: Unprocessed facts with no immediate value.
Data Analysis: Organizes data to show trends or patterns.
Data Insights: Explains why things happen and what to do next.
Why it matters: Companies using data insights are 5% more productive and 6% more profitable. With insights, businesses like MGM Resorts and American Express have improved operations, boosted revenue, and retained customers.
Quick Overview:
Steps to Get Insights:
Collect relevant data.
Clean and prepare the data for accuracy.
Analyze and interpret patterns.
Visualize findings for clarity.
AI's Role:
Enables natural language data queries for easier access.
Provides predictive and prescriptive analytics.
Best Practices:
Use feedback loops to refine insights.
Minimize bias in analysis.
Plan for scalability as data grows.
Bottom Line: Data insights transform numbers into strategies, helping businesses grow, improve efficiency, and reduce risks.
Data vs. Findings vs. Insights
Steps to Get Actionable Data Insights
Turning raw data into meaningful insights is a step-by-step process. Each phase builds on the last, creating a solid structure for informed decision-making. Organizations that follow a structured approach often achieve better results compared to those relying on unplanned methods. Below is a guide that outlines the journey from data collection to visualization.
Step 1: Data Collection
Every insight begins with gathering the right data from the right places. Before diving in, set clear objectives to ensure you focus on relevant information and avoid being overwhelmed [1].
Modern businesses draw data from a variety of sources, including CRM systems, marketing platforms, transactional databases, social media, and customer service logs. Automated data pipelines are key to maintaining a steady and consistent flow of information [2].
By automating these pipelines and standardizing data entry, businesses can improve accuracy by up to 20% and cut errors by 25% [2]. It's also critical to define who collects what data, from where, and when, to ensure the information has proper context [1].
Inconsistent data collection can cost businesses up to 30% of potential insights [2]. To avoid this, establish a robust data governance framework and assign data stewards to oversee quality and ensure standards are met [2].
Step 2: Data Cleaning and Preparation
Once the data is collected, the next step is to refine it for reliability and accuracy.
Raw data is rarely ready for immediate use. Cleaning involves correcting or removing errors, duplicates, incomplete entries, and other inconsistencies to ensure the data is trustworthy [5]. This step is time-consuming but crucial for generating meaningful insights [7].
"When using data, most people agree that your insights and analysis are only as good as the data you are using. Essentially, garbage data in is garbage analysis out." – Tableau [5]
Key aspects of data cleaning include:
Eliminating duplicate or irrelevant entries to streamline analysis [5].
Correcting structural errors, such as typos or inconsistent formatting, to avoid analytical mistakes [8].
Filtering out unnecessary outliers caused by data entry errors [5].
Addressing missing data by either removing incomplete entries, imputing missing values, or adjusting your analysis [5].
Documenting every step in the cleaning process, including identified issues, corrections, and assumptions, while keeping backups of the original data for reference [6].
Routine data audits can further enhance reliability by up to 15% [2].
Step 3: Analyzing and Interpreting Data
With clean data, the analysis phase uncovers patterns and relationships that drive value.
This step transforms structured data into actionable insights that align with business objectives. For example, clustering can help with customer segmentation, regression analysis can forecast sales, and correlation analysis can reveal the relationship between marketing spend and customer acquisition.
Interpretation is where technical findings become practical business intelligence. Trends like a sudden rise in customer complaints could indicate a product issue, while seasonal sales patterns could guide inventory planning.
AI and machine learning can play a role in spotting anomalies or automating pattern recognition [3][4]. However, always validate AI-driven insights within the context of your business. Use key performance indicators (KPIs) to measure data quality, focusing on completeness, consistency, and accuracy [2]. These metrics help ensure your analysis is dependable and highlight areas for improvement.
Step 4: Visualizing Data
The final step is visualization, which transforms complex data into graphics that make insights easy to grasp.
Visualization helps you quickly identify key trends and patterns [10]. Organizations that excel in data visualization are three times more likely to see a 20% or greater impact on earnings before interest and taxes [10]. Choosing the right visualization type is critical - line charts are great for trends, bar charts for comparisons, scatter plots for correlations, and heat maps for patterns in large datasets. KPI dashboards, in particular, enable real-time monitoring and quick issue identification [13].
"Data is a universal language, but how it's interpreted depends on the lens through which it's viewed. The choices you make with your data visualizations aren't just aesthetic; each decision you make is critical to shaping the message you wish to convey." – Tom Czaban [9]
To make visualizations clear and accessible, keep them straightforward and easy to understand [9]. Use color thoughtfully to highlight important details [11], ensure bar chart axes start at zero to avoid misleading viewers [12], and limit line charts to five or six lines for clarity [12].
Interactive features like filters, tooltips, and drill-down options allow users to explore data in real time, enhancing engagement [9][10]. Regularly refining visual tools based on feedback ensures they remain effective for decision-making.
Good visualization isn't just about creating appealing charts. It's about designing tools that help quickly identify issues and enable timely action, fostering a data-informed culture throughout your organization [10].
How AI Improves Data Insight Generation
Once data is collected and cleaned, AI takes the next step by automating complex processes to reveal patterns that might take weeks - or even months - for humans to uncover manually. With the AI market projected to expand from $241.8 billion in 2023 to nearly $740 billion by 2030, it’s clear these tools are becoming a cornerstone of modern data analysis [15].
Unlike traditional methods that might miss subtle connections, AI systems can process massive datasets in real time, delivering insights that are both actionable and timely. Let’s explore some key ways AI enhances data exploration.
AI-Driven Pattern Recognition
AI is particularly effective at spotting trends, anomalies, and relationships in large datasets. By leveraging machine learning techniques like supervised, unsupervised, and deep learning, AI systems can extract features and train models to recognize patterns in new data. This capability helps businesses identify shifts in customer behavior or operational inefficiencies before they escalate [14].
Take cybersecurity as an example: companies like Cisco Systems and McAfee use AI-powered intrusion detection systems. These tools learn from network behavior, adapt to emerging threats, and provide real-time alerts by continuously monitoring traffic and user activity [15]. AI also excels in anomaly detection, rapidly identifying outlier data points with precision - something that would be nearly impossible to achieve manually [15].
Natural Language Data Querying
Natural language query (NLQ) technology simplifies complex data analysis by allowing users to interact with databases using everyday language. These systems translate plain-language questions into database commands, creating an intuitive interface. This means even non-technical users can extract insights without needing specialized skills or IT assistance [16].
For instance:
In healthcare, a doctor might ask, “What are John’s lab results?”
In finance, users can generate visual reports with queries like, “Compare Q1 and Q2 revenue.”
In retail, managers can retrieve key metrics by asking, “Which products had the highest returns last month?” [17].
Despite its potential, less than 20% of companies currently use their unstructured data due to its complexity [16].
Predictive and Prescriptive Analytics
AI also empowers organizations to look ahead and take proactive steps through predictive and prescriptive analytics. Predictive analytics uses historical data to forecast future trends, while prescriptive analytics goes further, offering recommendations to achieve specific goals [18].
This market is growing rapidly, with projections showing an increase from $12.3 billion in 2022 to $60.39 billion in 2023 - a compound annual growth rate of 22% [19].
In healthcare, prescriptive analytics helps optimize treatment plans and allocate hospital resources more efficiently. Retailers use these tools for personalized product recommendations and dynamic pricing, while financial institutions rely on them to automate investment strategies, optimize portfolios, and maintain regulatory compliance [20].
Using Querio to Transform Data into Actionable Insights
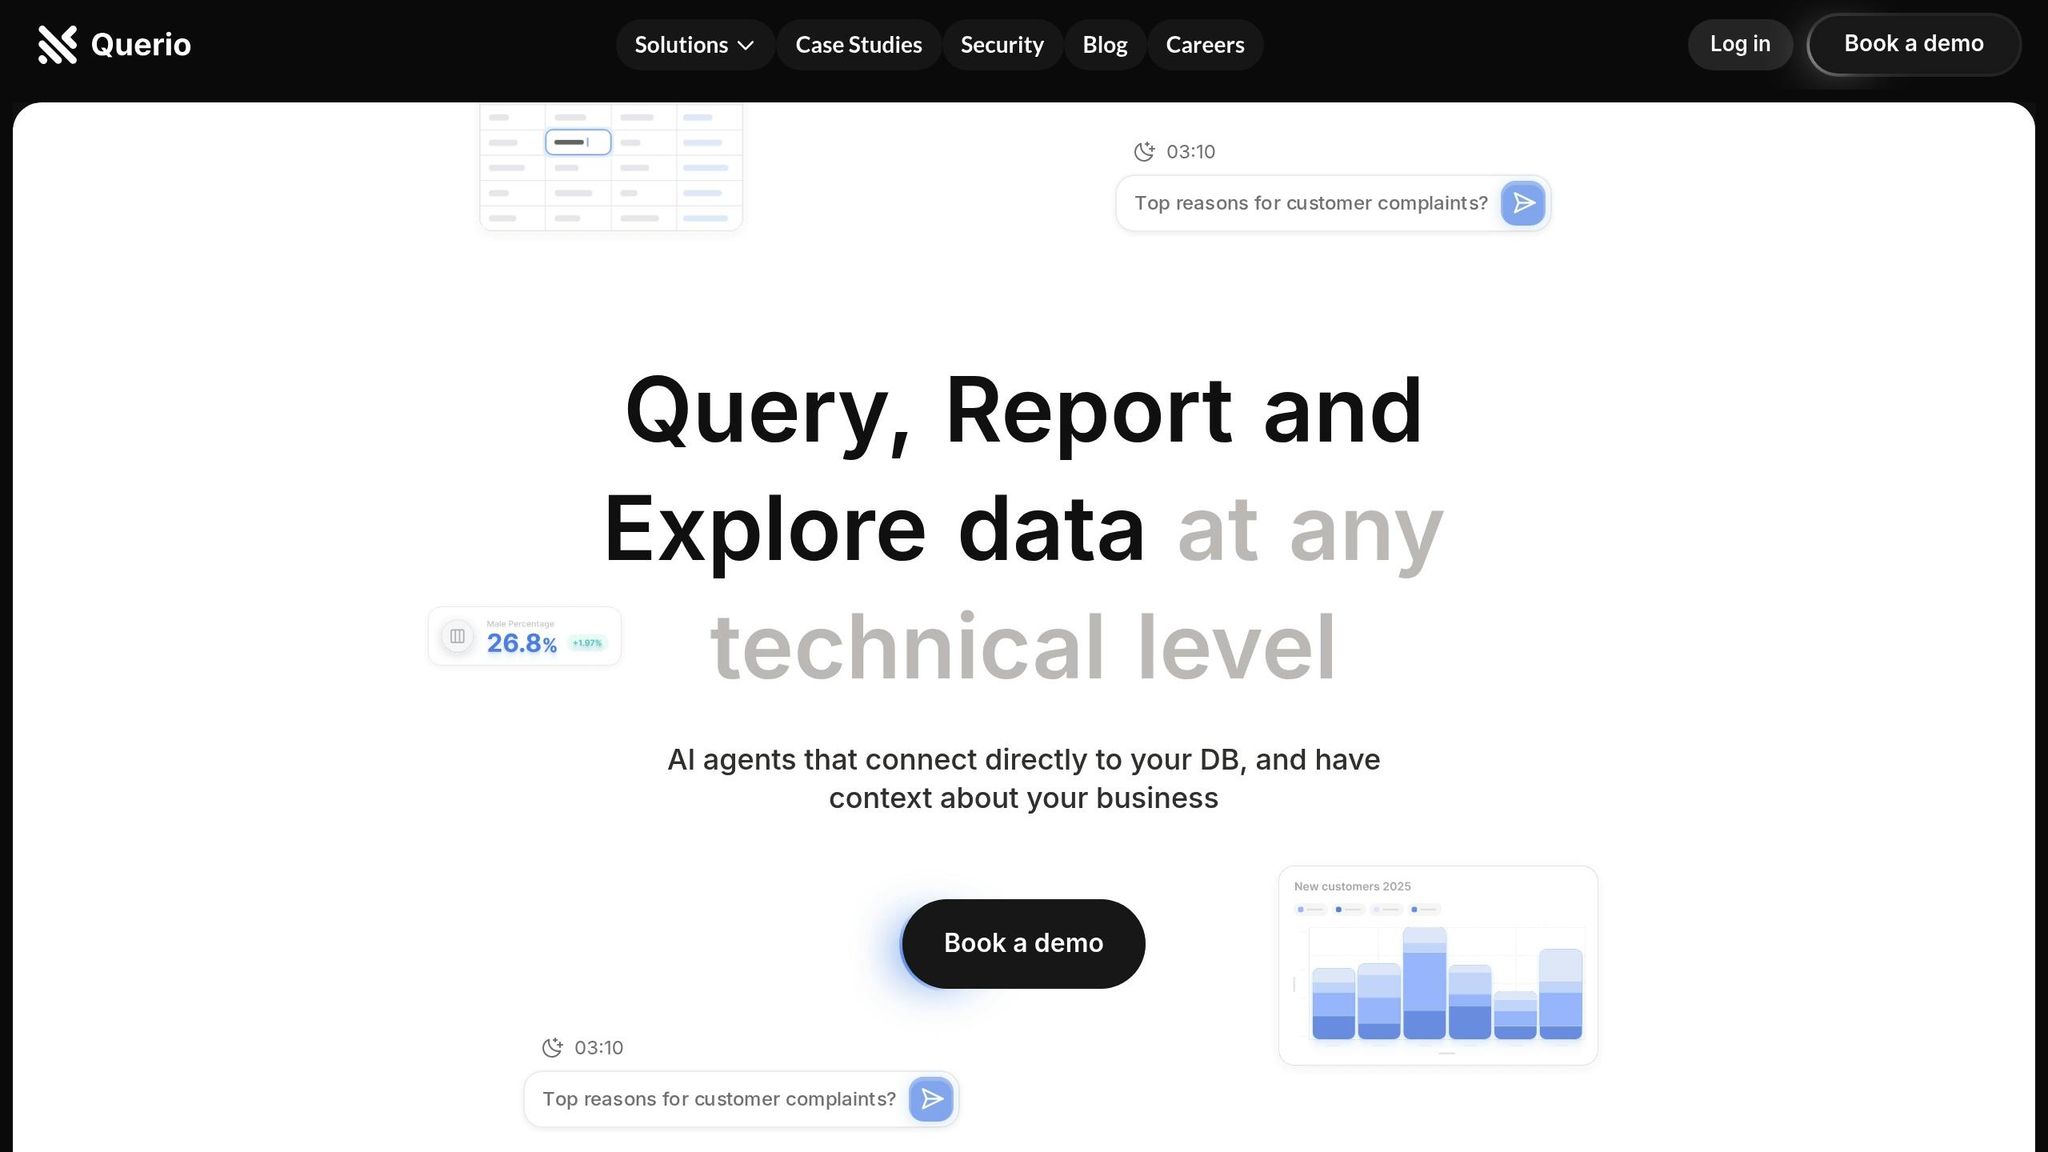
Querio builds on AI-driven pattern recognition and natural language querying to deliver a seamless, user-friendly platform for data insights. Unlike many tools that complicate the process with technical hurdles, Querio simplifies it. By automating data pipelines, offering intuitive interfaces, and promoting team collaboration, it transforms raw data into meaningful insights.
The results? A massive productivity boost. Users can complete reports 20 times faster and save up to 8 hours each week - a time savings that translates to $31,000 annually for product managers [22].
"Querio stands out as a revolutionary AI-powered Business Intelligence (BI) platform designed to bridge the gap between business and data teams." - NavTo.AI [23]
Dynamic Dashboards for Business Insights
Querio’s dashboards are designed to make life easier for businesses. They offer real-time tracking of essential features of modern BI tools like key performance indicators (KPIs), customizable views, and even auto-suggestions for visualizations. This means users can dive deep into their data without needing extra technical help. The platform’s auto-detection and suggestion tools simplify chart creation by identifying relevant data columns based on user input [21].
Companies using Querio have reported 100% accuracy in their data reporting, along with noticeable cost savings thanks to streamlined dashboard creation [23]. Managers can quickly investigate trends or anomalies by drilling down into specific data points, eliminating the need for additional tech support.
Feature | Business Impact | Time Savings |
|---|---|---|
AI-Powered Queries | Instant insights | 20x faster reporting |
Dynamic Dashboards | Real-time tracking | Up to 8 hours weekly |
Automated Pipelines | Streamlined ETL | Weeks to minutes |
Cross-Database Access | Unified data | Immediate integration |
These dashboards complement earlier visualization efforts by delivering real-time, customizable insights. Once set up, they empower users to explore data further with natural language querying.
AI-Driven Querying with Natural Language
Querio takes data analysis to the next level with its natural language interface. This feature allows anyone on the team - whether they’re in marketing, sales, or operations - to query complex databases using everyday language. No SQL knowledge? No problem. Users can ask questions like, "What were our top-performing products last quarter?" or "Show me customer retention rates by region" and get results instantly [23].
The platform connects directly to major databases and uses AI to understand the context of business questions. This not only improves query accuracy but also speeds up processing. For organizations without dedicated data teams, this feature has been a game-changer. Teams can independently explore data and generate insights, cutting down on reliance on technical staff and speeding up decision-making [24].
Collaboration and Security Features
Querio also shines when it comes to teamwork. Shared workspaces and dashboard-sharing options allow cross-functional teams to collaborate on data projects, share findings, and maintain consistent reporting standards across departments [22].
The platform is designed to meet the needs of industries where data-driven decisions are critical, such as finance, healthcare, marketing, and retail. With role-based access controls and strong security protocols, Querio ensures sensitive data stays protected while still enabling broad access to insights across the organization [21].
"Querio empowers teams to explore data and generate insights seamlessly, without constant data team support." - PopularAiTools.ai [24]
Best Practices for Better Data Insight Generation
Once you've laid the groundwork for generating data insights, incorporating best practices can amplify their impact. Reliable insights stem from disciplined approaches that keep your analysis precise, impartial, and adaptable to your business's evolving needs.
Establish Feedback Loops for Continuous Improvement
Feedback loops are essential for turning static analysis into a dynamic process of ongoing refinement. A feedback loop involves collecting user input, analyzing it, implementing changes, and following up - essentially transforming raw feedback into actionable improvements [25].
The first step is setting clear goals. Whether you're aiming to lower customer churn, enhance user experience, or refine product features, having specific objectives ensures you gather the right kind of feedback. Tailor your feedback channels to your audience: use surveys for gauging general sentiment, support tickets for identifying technical issues, and community forums for understanding detailed user experiences.
Closing the loop is key to making feedback a two-way conversation. For example, Atlassian integrates customer feedback into their product roadmap, holding teams accountable for addressing top pain points in future sprints or releases [25]. Netflix goes a step further by using behavioral data - like viewing habits and preferences - to refine their recommendation algorithm. Through real-time feedback and A/B testing, they create a system where every user interaction drives improvement [26].
This iterative process not only enhances outcomes but also helps reduce bias in future analyses.
Reduce Bias in Data Analysis
Bias can creep into every stage of data analysis, from data collection to interpretation. While it's impossible to eliminate bias entirely, data scientists can take steps to recognize and minimize it [27].
Bias typically arises in three areas: the data itself, the analysts, and the analytics process. Early detection methods like cross-validation and exploratory analysis can help, but the real game-changer is fostering diverse teams and implementing structured procedures to identify bias.
Amazon's experience with an AI hiring tool in 2018 highlights the risks. The tool, trained on historical data, learned to exclude women from the pool of qualified candidates - demonstrating how unchecked biases in past data can perpetuate inequities [28].
"If the results tend to confirm our hypotheses, we don't question them any further. However, if the results don't confirm our hypotheses, we go out of our way to reevaluate the process, the data, or the algorithms, thinking we must have made a mistake." - Theresa Kushner, Partner at Business Data Leadership [27]
Key strategies include documenting methodologies, screening models for bias, embracing team diversity, and using synthetic datasets when necessary. By addressing bias proactively, you can ensure your system remains reliable and fair as it scales.
Plan for Scalability
Scalability is crucial for managing growing data volumes and user demands. A scalable system ensures that increasing data can be translated into actionable insights without disruption. Gartner predicts that by 2024, 75% of organizations will invest in scalability solutions to support digital transformation [29].
Research from SEMrush shows that businesses with scalable data infrastructures achieve revenue growth 2.5 times faster than those without [29]. Additionally, organizations leveraging cloud-based analytics have reported a 30% reduction in operational costs, according to Gartner [30].
"Scalability is at the heart of modern data platforms. These systems are designed to scale up or down dynamically to accommodate fluctuating data volumes and processing demands without disrupting ongoing operations." - Guy Holmes, founder and CEO of Tape Ark [30]
When planning for scalability, you’ll need to decide between vertical and horizontal scaling. Vertical scaling involves upgrading existing hardware, while horizontal scaling adds more machines. Horizontal scaling is often more flexible and cost-efficient, especially when paired with cloud-native designs like microservices and serverless computing [29].
Scaling Approach | On-Premises Storage | Cloud Storage |
|---|---|---|
Cost Structure | High upfront and maintenance costs | Subscription-based, usage-dependent |
Scalability Method | Vertical scaling (hardware upgrades) | Horizontal scaling (add more nodes) |
Performance | May suffer from network congestion | Generally consistent and high |
Best For | Smaller businesses with stable needs | Rapidly growing enterprises |
The secret to effective scalability lies in preparation. Regular performance reviews, clear metrics for scaling, and a flexible architecture are essential. Conducting scalability tests periodically can help you spot vulnerabilities before they become critical issues.
Conclusion: The Power of Data Insight for Business Success
Using data effectively has become the backbone of successful business strategies, reshaping how companies operate, compete, and grow. Businesses that make data-driven decisions consistently outperform their peers. For instance, data-driven companies are 58% more likely to exceed their revenue targets [32]. Additionally, organizations that utilize customer behavioral insights see 85% higher sales growth and over 25% better gross margins compared to their competitors [32]. Leaders of advanced insight-driven companies enjoy annual growth rates at least 20% higher than those just beginning to explore data capabilities [33].
But here’s the challenge: while over 70% of businesses collect data, fewer than 30% manage to turn that data into actionable strategies [31]. This gap highlights the pressing need for tools and systems that can seamlessly transform raw data into meaningful insights.
To bridge this gap, companies must adopt a multi-faceted approach. This means investing in robust data systems, assembling skilled teams, and ensuring proper governance to maintain data quality and reliability. More importantly, businesses need tools that simplify complex data and make it accessible for practical decision-making.
"The well-known proverb 'He who controls the information controls the world' becomes very helpful in the business context. The point is that data isn't an asset anymore - it's a source of competitive advantage." - Volodymyr Dudas, Forbes Councils Member [33]
This is where platforms like Querio come into play. Querio is changing the game by making data accessible to everyone within an organization. With features like natural language querying and dynamic dashboards, teams - regardless of technical expertise - can uncover actionable insights. This translates to quicker decisions, better collaboration, and the agility to adapt to market changes. Platforms like Querio enable businesses to align their technology with broader strategies, giving them a competitive edge.
The future belongs to businesses that can turn data into opportunities and challenges into growth. By adopting strategies such as building feedback loops and planning for scalability, companies can fully unlock the potential of their data. The real question is no longer whether to embrace data-driven decision-making, but how quickly your organization can adapt to leverage the advantages it offers. With the right tools and a clear vision, businesses can achieve transformative results and thrive in an increasingly competitive world.
FAQs
How can businesses guarantee accurate and reliable data insights?
To keep data insights accurate and dependable, businesses should prioritize regular data audits and leverage automated tools for validation and spotting errors. Consistently performing data cleansing and setting up solid data governance policies are key steps in maintaining high-quality data.
Providing employee training on best practices for data management and keeping clear, current documentation can further strengthen data reliability. On top of that, relying on trusted data sources and actively monitoring for anomalies ensures potential issues are caught and addressed before they affect critical decisions.
How does AI improve the process of turning data into actionable insights?
AI has become a game-changer in turning raw data into actionable insights by automating tasks like gathering, cleaning, and analyzing information. This not only speeds up the process but also helps businesses make decisions with greater accuracy and efficiency.
By using predictive analytics, companies can forecast trends and predict customer behavior, which allows them to adjust strategies ahead of time. On top of that, AI transforms complicated data into clear and intuitive visualizations, making it easier for decision-makers to grasp and act on the findings. These tools help businesses harness the power of their data to achieve smarter, more effective results.
What challenges do businesses face when turning raw data into actionable insights?
Transforming raw data into meaningful insights is no small feat for many businesses. One common hurdle is dealing with data silos - when information is scattered across different systems or departments. This fragmentation makes it tough to get a clear, unified view of the data, which is essential for spotting trends and patterns.
Another issue is poor data quality. Incomplete or inconsistent datasets can lead to unreliable conclusions, ultimately undermining decision-making processes. It’s like trying to build a sturdy house with faulty materials - no matter how good the design, the foundation is shaky.
Then there’s the shortage of skilled professionals. Even the most advanced tools can fall short if there’s no one with the expertise to use them effectively. Data analysis requires a mix of technical know-how and critical thinking, and without it, businesses may struggle to unlock the full potential of their data.
Finally, many organizations face the challenge of building trust in their data. If teams don’t believe in the accuracy or reliability of their data, it’s hard to make confident, informed decisions.
The solution? It starts with a solid strategy. Businesses need to focus on improving data governance, ensuring their data is clean and well-organized. Investing in the right tools and training can also empower teams to turn raw data into actionable insights. With the right approach, these challenges can be transformed into opportunities for growth and innovation.
Related Blog Posts


