Business Intelligence
15 Data Analysis Tools and When to Use Them
Explore 15 powerful data analysis tools that convert raw data into actionable insights, enhancing decision-making for businesses of all sizes.
Data analysis tools help businesses transform raw data into actionable insights. With increasing data complexity, these tools automate processes, provide predictive analytics, and deliver visualizations to support smarter decisions. From startups to enterprises, the right tool can optimize operations, improve customer experiences, and identify growth opportunities. Here’s a look at 15 popular tools, their features, and when to use them:
Querio: AI-powered natural-language queries for cross-departmental analytics. Ideal for teams needing live data insights without SQL expertise.
Tableau: Advanced visualizations and dashboards. Best for industries requiring detailed, interactive reports.
Power BI: Perfect for Microsoft-centric environments. Budget-friendly with seamless Office 365 integration.
Looker: Developer-focused with strong Google Cloud integration. Suited for advanced modeling and custom analytics.
Sisense: Embeds analytics into workflows. Great for teams needing real-time data and SQL flexibility.
Qlik Sense: Self-service analytics with a unique associative model. Useful for exploratory data analysis.
AWS QuickSight: Cloud-native BI for AWS users. Pay-per-session pricing makes it scalable and cost-effective.
Domo: Simplifies data preparation with drag-and-drop tools. Ideal for business users with limited technical skills.
GoodData: Focused on embedded analytics. Excellent for creating custom analytics solutions.
ThoughtSpot: AI-driven natural language search. Best for empowering non-technical users with large datasets.
IBM Cognos Analytics: Enterprise-grade reporting with AI support. Suitable for compliance-heavy industries.
SAP Analytics Cloud: Combines planning and analytics. Tailored for businesses using SAP systems.
Google Data Studio: Free, user-friendly dashboards. Perfect for small teams and digital marketers.
Alteryx: Workflow-based data preparation. Designed for non-technical teams needing advanced data blending.
RapidMiner: Machine learning and predictive analytics. Ideal for industries like manufacturing and customer analytics.
Quick Comparison
Tool | Best For | Key Feature | Starting Price |
|---|---|---|---|
Querio | Natural language queries | AI-powered insights | $14,000/year |
Tableau | Advanced visualizations | Interactive dashboards | $75/user/month |
Power BI | Microsoft ecosystem | Office 365 integration | $10/user/month |
Looker | Developer-centric analytics | Google Cloud integration | $5,000/month min. |
Sisense | Embedded analytics | SQL and real-time data | Custom pricing |
Qlik Sense | Self-service analysis | Associative data model | $30/user/month |
AWS QuickSight | AWS ecosystem | Pay-per-session pricing | $5/user/month |
Domo | Data preparation | Drag-and-drop tools | $83/user/month |
GoodData | Custom analytics | Embedded solutions | Custom pricing |
ThoughtSpot | AI search | Natural language queries | Custom pricing |
IBM Cognos | Enterprise reporting | AI-powered insights | $15/user/month |
SAP Analytics | SAP integration | Planning and analytics | $36/user/month |
Google Data Studio | Free dashboards | Google ecosystem | Free |
Alteryx | Workflow-based prep | Drag-and-drop workflows | $5,195/user/year |
RapidMiner | Predictive analytics | AutoML and ML tools | Free tier available |
Each tool has unique strengths. Choose based on your data sources, team expertise, and budget. For smaller teams, free or low-cost options like Google Data Studio or Power BI might work best. Larger enterprises may favor robust platforms like Tableau, IBM Cognos, or Looker. Always consider integration, scalability, and specific features when selecting the best fit for your needs.
The Best Data Analytics Tools for 2025: What to Learn Now
How to Choose the Right Data Analysis Tool
Picking the right data analysis tool is a critical decision that can shape how effectively your organization extracts insights from data. With so many options out there, each claiming to solve your analytics challenges, it’s essential to evaluate them carefully. Here are the key factors to consider:
Data Source Integration is the foundation of any good data analysis tool. The tool needs to connect seamlessly with your existing data infrastructure, avoiding unnecessary bottlenecks or complex migrations. Look for tools that integrate directly with databases like Snowflake, BigQuery, or PostgreSQL, as well as cloud storage systems. This ensures real-time insights without relying on duplicate data copies.
Scalability is another must-have, especially if your data or user base is expected to grow. Make sure the tool can handle increasing data volumes while offering cost-effective options for additional users. Scalability in both performance and licensing is essential for long-term success.
User Experience and Learning Curve play a big role in how quickly your team can adopt the tool. Tools with intuitive interfaces or AI-driven natural language features can reduce technical barriers, making it easier for everyone - regardless of skill level - to interact with the data.
Visualization and Dashboard Capabilities should align with your reporting needs. Whether you need polished executive reports, interactive dashboards, or embeddable visuals, choose a tool that delivers on the specific types of visualizations your organization requires.
AI and Advanced Analytics Features are becoming increasingly important. Tools that include predictive analytics, anomaly detection, or machine learning capabilities can help your team uncover insights faster and more effectively.
Compliance and Security Standards are critical, particularly for businesses in regulated industries. Ensure the tool meets standards like SOC 2 Type II, GDPR, or HIPAA, depending on your needs. Features like data encryption (both in transit and at rest) and detailed audit logs are non-negotiable for maintaining security.
Pricing Structure and Total Cost of Ownership go beyond just the subscription fee. Take a close look at the hidden costs of traditional BI platforms, including charges for additional users, data sources, queries, and premium features. Don’t forget to factor in implementation, training, and ongoing maintenance when calculating the total cost.
Governance and Data Management features help ensure data quality and consistency across your organization. A good tool will offer robust governance capabilities, such as defining metrics, managing permissions, and tracking data lineage.
Performance and Reliability are key to user satisfaction. Look for tools with fast query response times, reliable uptime (aim for a 99.9% SLA), and the ability to perform well under heavy usage.
To make the best choice, involve cross-functional teams - including IT, finance, and marketing - to ensure the tool meets diverse needs across your organization. Before fully committing, run a pilot with a subset of your data and select users to evaluate its performance and usability. This hands-on testing will help you make an informed decision.
1. Querio
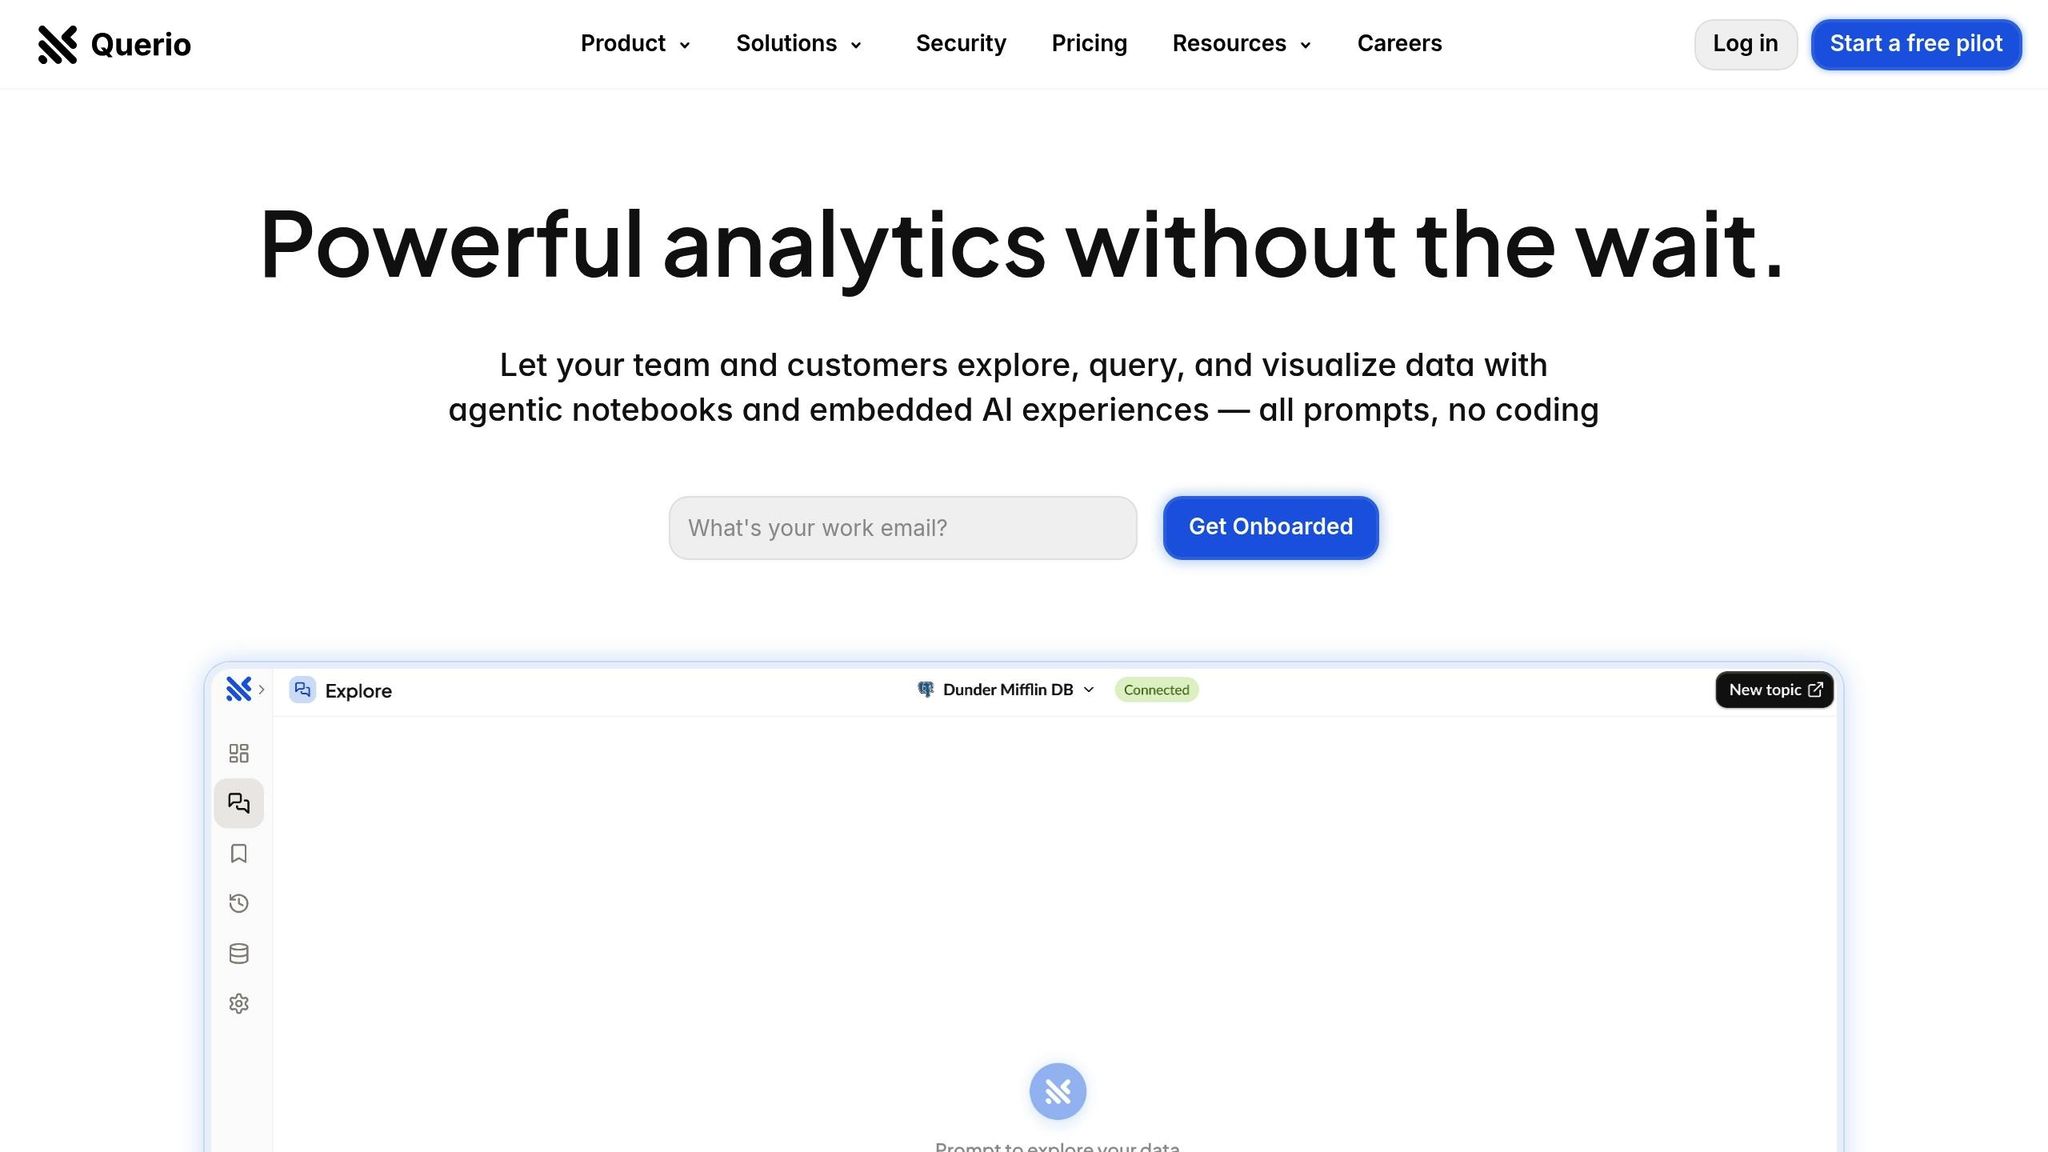
Querio is an AI-powered business intelligence platform designed to make data analysis accessible to everyone in your organization. Whether you're in product management, finance, or marketing, Querio lets you ask questions in plain English and get clear, accurate visualizations of live warehouse data in seconds.
Key Features and Strengths
Querio stands out by using AI to handle natural-language queries. Instead of writing SQL, users can simply ask questions like, "What was our revenue growth last quarter?" The platform translates these questions into SQL behind the scenes and quickly generates charts and visualizations.
With direct connections to data warehouses, Querio ensures you're always working with the most up-to-date information. It integrates seamlessly with platforms like Snowflake, BigQuery, and PostgreSQL using read-only, encrypted credentials, so there's no need to create data copies.
Another standout feature is its context layer, which allows technical teams to define relationships between tables, set business metrics, and create a shared glossary. This ensures consistent data interpretation across the organization, empowering non-technical users to explore data confidently.
Querio also offers unlimited viewer access, making it a cost-effective solution for teams looking to share insights widely. While only paid licenses are needed for users building queries and dashboards, everyone else in the company can view and interact with the results for free.
These features make Querio a versatile tool for various departments.
Best Use Cases
Querio shines in cross-departmental analytics. Product teams can dive into user engagement metrics, finance teams can track revenue trends, and marketing teams can measure campaign performance - all using a single, unified dataset with consistent definitions.
The platform is particularly useful for executive reporting and KPI tracking. Its drag-and-drop dashboard builder makes it easy to create polished executive summaries and automated reports, keeping leadership informed without requiring additional tools.
For SaaS companies, Querio’s embedded analytics feature is a game-changer. It allows them to integrate data insights directly into their products, giving end users a smooth, natural-language querying experience without the need to build analytics infrastructure from scratch.
Querio’s integration capabilities further expand its practical applications.
Integration Capabilities
Querio provides tools for organizations that need to unify data from multiple sources. It offers data pipeline subscriptions at $10,000 annually for up to three pipelines. Its embedded analytics feature also enables technical teams to integrate data insights directly into existing workflows and applications effortlessly.
Pricing and Scalability
Querio uses a straightforward, usage-based pricing model starting at $14,000 per year for the core platform. This base plan includes one database connection, 4,000 AI prompts per month, and unlimited viewer users. Additional database connections cost $4,000 each annually, and the dashboard add-on is available for an extra $6,000 per year.
For enterprises with stricter data governance needs, Querio offers self-hosted deployment options at a 50% premium on recurring fees, with a minimum annual commitment of $60,000. Monthly billing is also available at a 10% increase over the annual rate.
Querio is SOC 2 Type II compliant and guarantees 99.9% uptime under its SLA, ensuring a reliable and secure experience for enterprise users.
2. Tableau
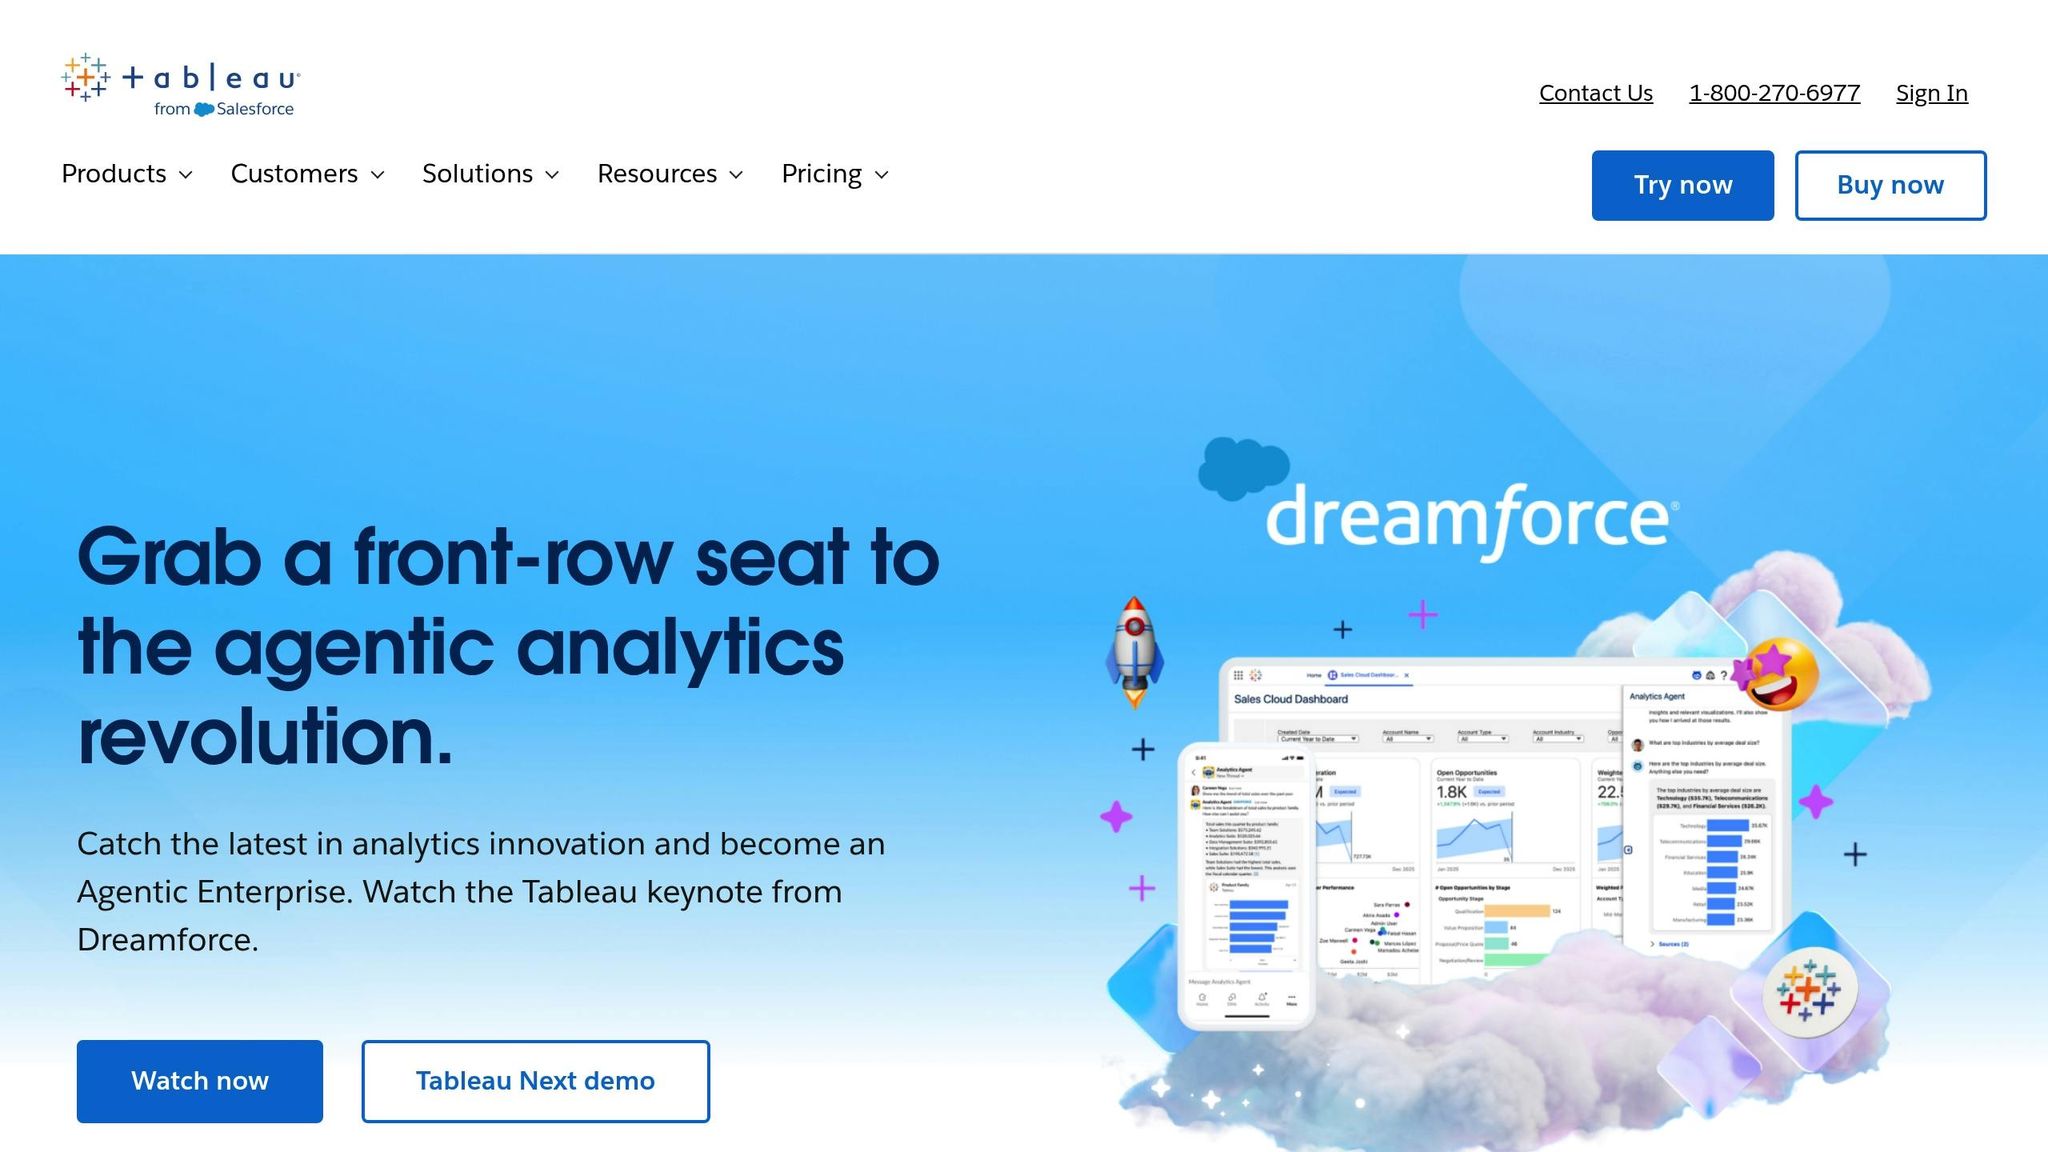
Tableau has firmly established itself as a top-tier tool for advanced visual analytics, making it a favorite among organizations that rely on data-driven decisions. With its intuitive drag-and-drop interface and impressive charting capabilities, Tableau simplifies the process of turning raw data into impactful visual narratives.
Key Features and Strengths
Tableau's visual query language allows users to effortlessly create complex visualizations by dragging fields onto a canvas. The platform even suggests the most suitable chart types, making it easier to uncover insights. Its in-memory engine, Hyper, processes millions of rows in seconds, ensuring swift performance even with large datasets.
One standout feature is Tableau's data blending capability, which enables users to merge data from multiple sources in real time, providing a unified view across different systems. For advanced analytics, Tableau supports built-in descriptive, predictive, and prescriptive analytics tools like forecasting, regression, and clustering, while also integrating with R and Python for custom analysis. Data scientists can even incorporate machine learning models directly into Tableau dashboards.
Another unique feature, Story Points, lets users craft step-by-step presentations to make complex insights more digestible for executives. This combination of power and usability makes Tableau versatile across a range of industries.
Best Use Cases
Tableau excels in environments where visual clarity and impact are critical. For example:
Enterprise Reporting: Financial services use Tableau for risk analysis and regulatory reporting, while retail businesses rely on its geospatial tools to evaluate store performance and plan expansions.
Sales and Marketing Analytics: Teams can build dynamic dashboards to monitor campaigns, customer segmentation, and revenue attribution. Its seamless integration with CRM systems like Salesforce is particularly valuable for sales operations.
Executive Dashboards: Tableau's polished visuals and interactive filtering make it ideal for high-level reporting. Executives can access key metrics on the go, thanks to its mobile-friendly design.
Data Exploration and Discovery: Analysts can quickly switch between different views of a dataset, making Tableau an excellent tool for ad-hoc analysis and testing new hypotheses.
Integration Capabilities
Tableau's integration options are robust and diverse. It connects to over 75 data sources, including major cloud platforms like Amazon Web Services, Microsoft Azure, and Google Cloud Platform. It also works seamlessly with enterprise databases such as Oracle, SQL Server, and SAP HANA, as well as cloud-based tools like Salesforce and Google Analytics.
For custom workflows, Tableau's REST API allows organizations to automate tasks like managing users, refreshing data, and deploying dashboards. Additionally, Tableau's embedding capabilities enable companies to incorporate visualizations directly into their own applications or portals.
For businesses with strict data governance policies, Tableau Bridge is a game-changer. It ensures secure connections between Tableau Cloud and on-premises data sources, making it easier to work with sensitive data without compromising security.
Pricing and Scalability
Tableau operates on a per-user licensing model, offering three main tiers:
Tableau Viewer: $15 per user per month, designed for basic dashboard viewing.
Tableau Explorer: $42 per user per month, which includes limited content creation.
Tableau Creator: $75 per user per month, providing full authoring capabilities.
For larger deployments, Tableau Server offers advanced administrative features, enhanced security, and dedicated support, though it requires a minimum commitment. Organizations with significant user bases can negotiate volume discounts to reduce per-user costs.
Tableau scales effortlessly, whether you're a small team or an enterprise with thousands of users. Tableau Cloud handles all infrastructure management, while Tableau Server offers complete control over deployment. Both options support high availability configurations and can manage thousands of concurrent users.
For automating data preparation, Tableau Prep Conductor is available at an additional $5 per user per month, streamlining workflows and saving time for teams.
3. Power BI
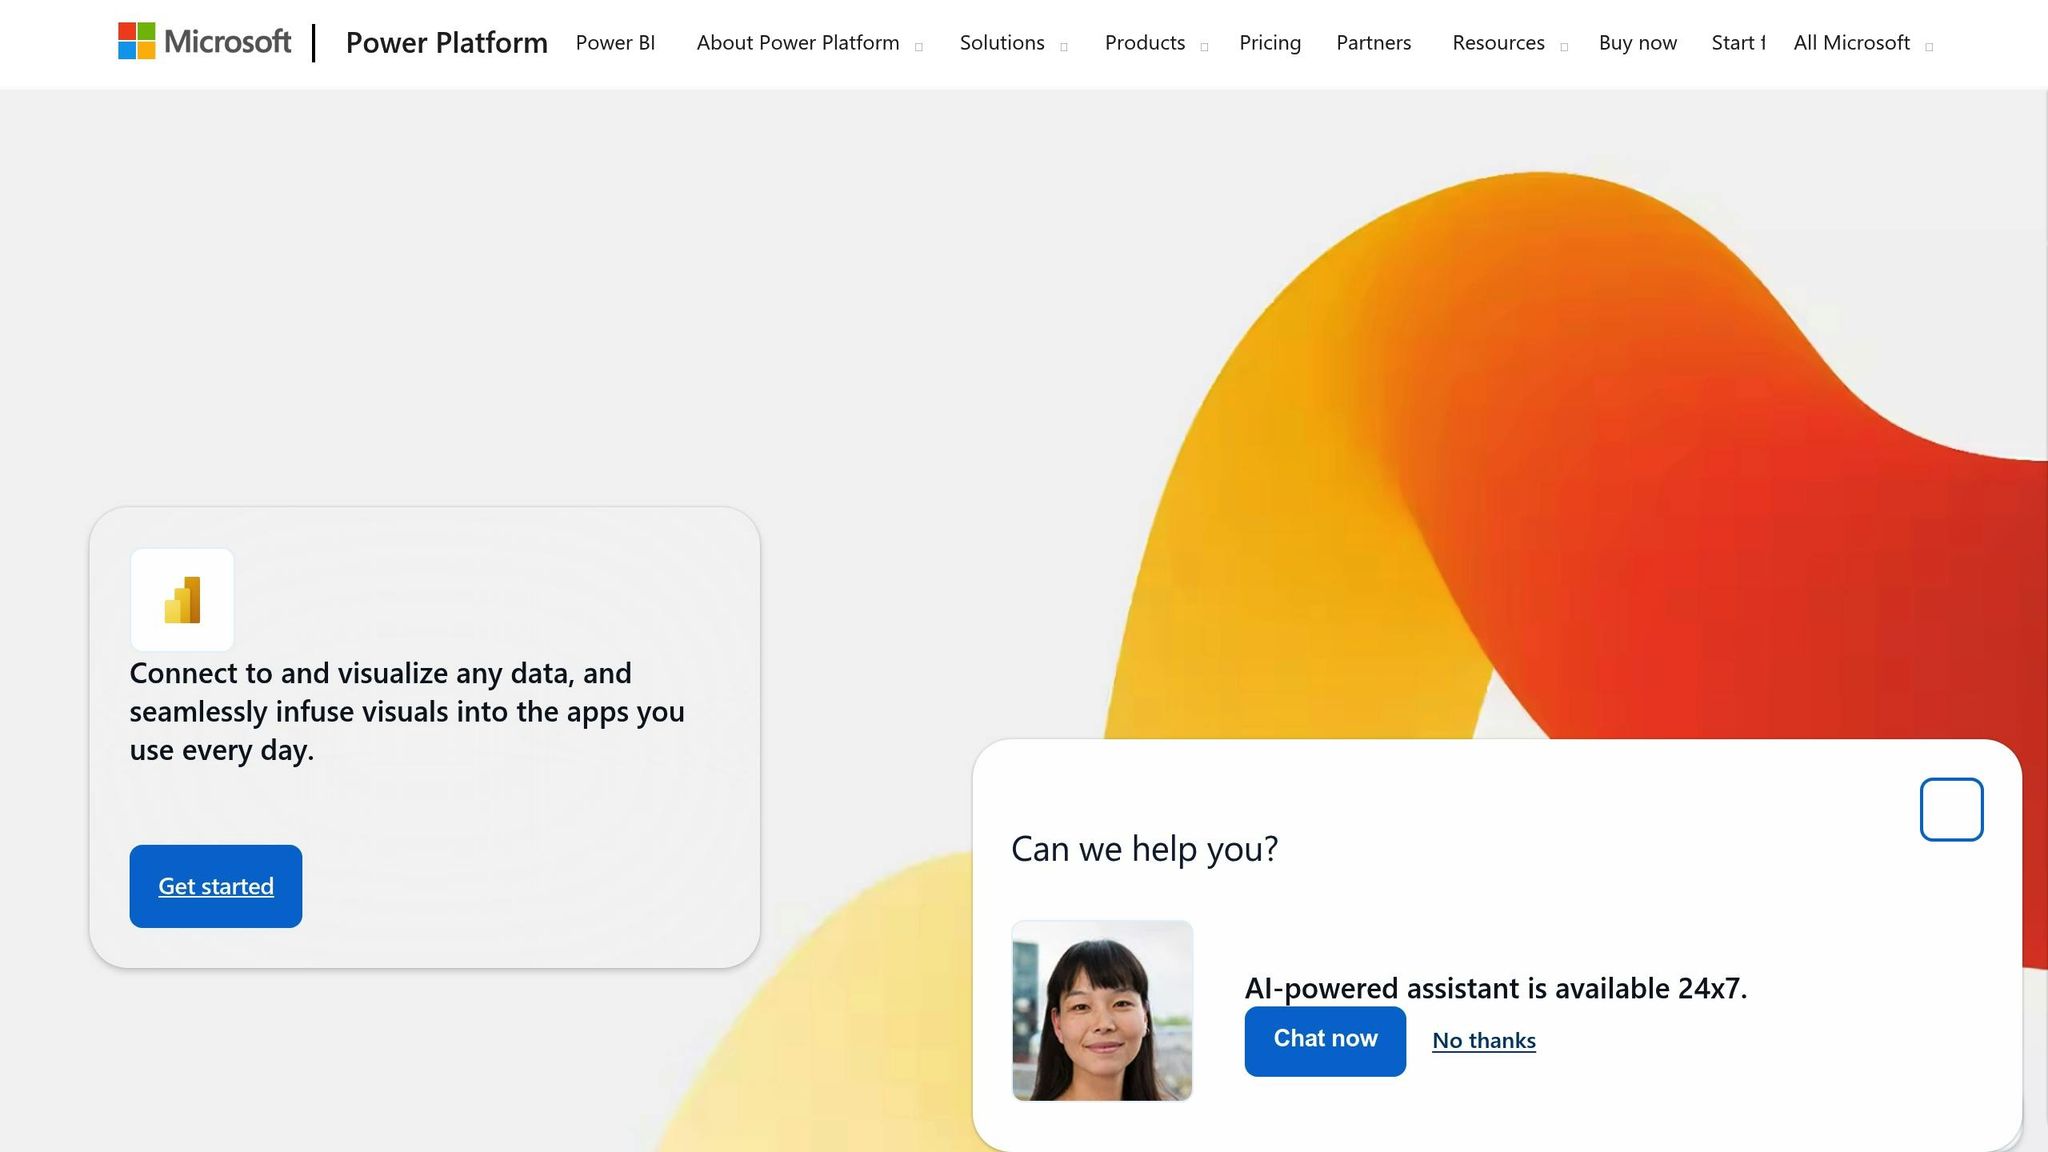
Microsoft's Power BI stands out as a go-to solution for organizations deeply embedded in the Microsoft ecosystem. It provides a platform for business intelligence that makes powerful analytics accessible to users without requiring advanced technical skills. Its seamless integration with Microsoft tools positions it as an essential part of enterprise analytics today. Let’s dive into how Power BI’s features make data analysis more approachable and effective.
Key Features and Strengths
One of Power BI’s standout features is its natural language query tool, known as Q&A. This allows users to type questions in plain English, like “show me sales by region last quarter,” and instantly receive visualized results. This capability empowers non-technical team members to explore and interpret data on their own.
The Power Query engine simplifies complex data transformations through an intuitive interface. Users can clean, reshape, and merge data from multiple sources - all without writing a single line of code. For those needing more advanced calculations, Power BI’s DAX (Data Analysis Expressions) language provides the tools to create custom measures and perform intricate time-based analyses.
For organizations requiring advanced functionality, Power BI Premium introduces features like dataflows for reusable data preparation, AI insights to detect trends and anomalies, and composite models that blend imported data with DirectQuery sources for greater flexibility. Additionally, paginated reports ensure pixel-perfect documents for enterprise-level reporting.
Best Use Cases
Power BI thrives in environments where Microsoft tools are already part of the workflow. Here are some key scenarios where it shines:
Financial Reporting: Finance teams often rely on Power BI’s seamless integration with Excel. Traditional spreadsheet processes can be transformed into automated dashboards, with real-time data updates from workbooks stored in SharePoint or OneDrive.
Sales Analytics: Sales teams benefit from Power BI’s integration with Dynamics 365 and Microsoft’s CRM tools. Managers can embed reports directly into Dynamics interfaces, offering context-specific insights without leaving the platform. Mobile apps ensure sales teams in the field always have access to up-to-date metrics.
IT Security and Data Access: Power BI’s row-level security and compliance feature restricts data access based on roles, ensuring sensitive information is only visible to authorized users. This is particularly useful for multi-tenant setups where different departments or business units need tailored data views.
Manufacturing and Operations: Real-time streaming capabilities make Power BI ideal for monitoring production metrics and equipment performance. It can process thousands of events per second, making it a powerful tool for IoT applications and operational dashboards.
Integration Capabilities
Power BI’s strength lies in its seamless integration with Microsoft’s ecosystem. It connects effortlessly to Azure SQL Database, Azure Data Lake, and Azure Synapse Analytics, among others. Through the Power Platform, users can trigger automated workflows in Power Automate or embed Power BI visuals in Power Apps.
Collaboration is made easy with Microsoft Teams. Teams channels can host Power BI reports, enabling discussions and decision-making directly within the app. Similarly, reports can be embedded into SharePoint, making them accessible through company portals or intranets.
For organizations using non-Microsoft tools, Power BI supports over 100 data sources, including Salesforce, Google Analytics, Oracle, and SAP. Its REST APIs allow for custom integrations and automated deployments. With Power BI Embedded, companies can incorporate analytics into their own applications, offering white-labeled solutions to their customers.
To connect securely to on-premises data sources, the on-premises data gateway bridges the gap, ensuring data governance and compliance while enabling hybrid analytics solutions. This flexibility is especially helpful for organizations transitioning to cloud-based analytics.
Pricing and Scalability
Power BI offers flexible pricing to meet the needs of different organizations:
Power BI Pro: Priced at $10 per user per month, this tier includes full authoring, sharing, and collaboration features, making it suitable for small to medium-sized businesses.
Power BI Premium Per User: At $20 per user per month, this plan adds advanced features like dataflows, AI capabilities, and support for larger datasets, catering to organizations with more demanding analytics needs.
Power BI Premium Per Capacity: Starting at $5,000 per month, this option is designed for enterprise-scale deployments, offering unlimited report viewing, datasets up to 400GB, and enhanced administrative controls.
Power BI’s scalability is another key advantage. It supports everything from individual users to thousands of concurrent users in enterprise deployments. Power BI Premium includes automatic scaling to handle fluctuating workloads, while Azure Analysis Services can provide even more scalability for organizations with complex analytics demands.
With Microsoft’s global infrastructure, Power BI ensures high availability and offers data residency options for compliance. Its Multi-Geo capabilities allow multinational companies to store data in specific regions while maintaining centralized management, making it a versatile choice for organizations of all sizes.
4. Looker
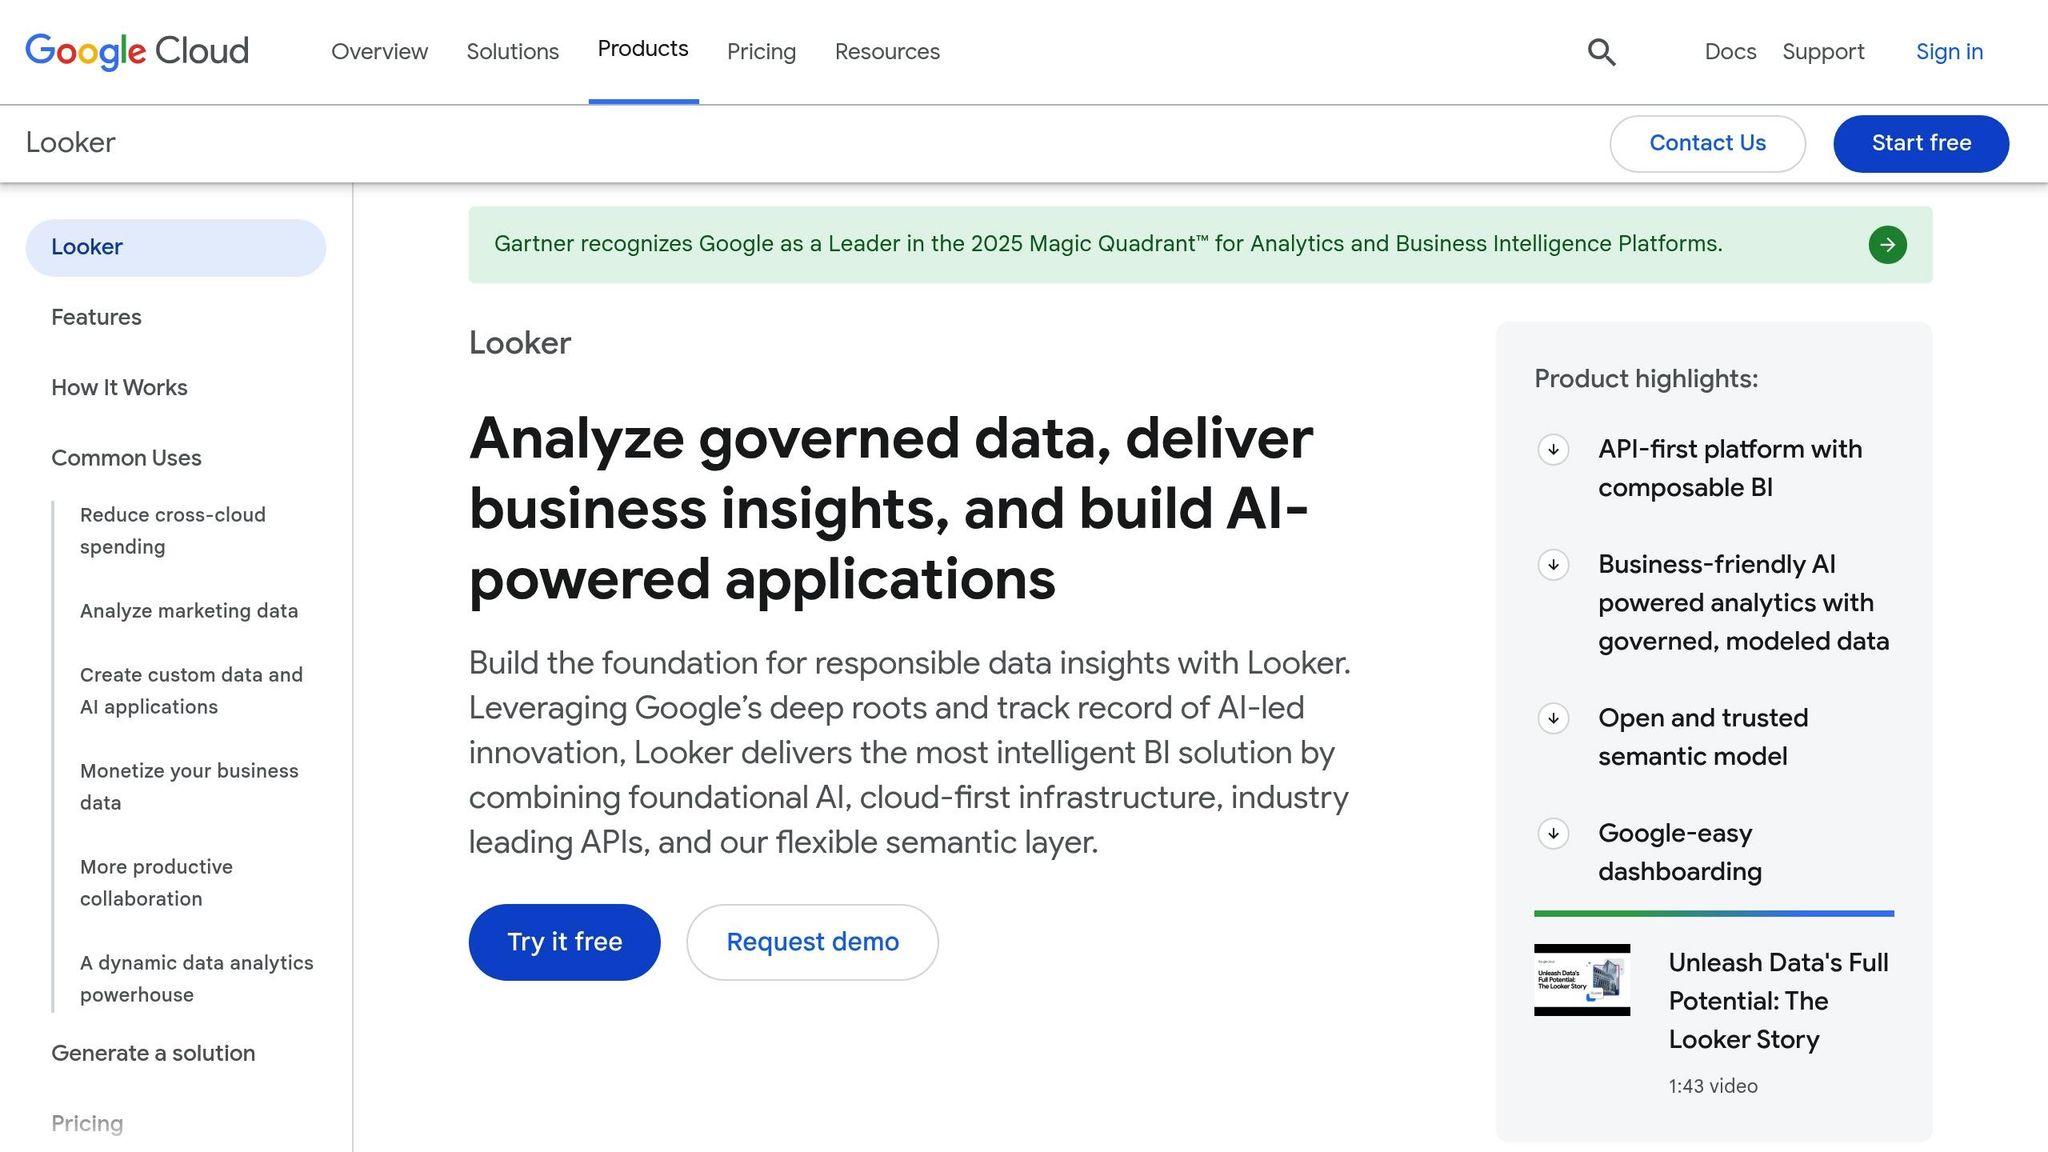
Looker is a cloud-based analytics platform designed to centralize business data and provide self-serve business intelligence through seamless connections to various data sources. As part of the Google Cloud ecosystem, it enables users to perform real-time analysis on large datasets, making it a powerful tool for handling complex data needs[1]. Its integration features further enhance its ability to manage large-scale data analysis efficiently using AI tools for custom dashboards[2].
Integration Capabilities
Looker’s strong connection to Google Cloud allows it to integrate effortlessly with Google BigQuery and other databases. This setup ensures streamlined access to data, enabling users to analyze large datasets directly within the platform. By eliminating the need for data transfers between systems, Looker simplifies workflows and boosts efficiency. This efficiency is particularly valuable when using AI analytics to predict future trends based on historical data.
5. Sisense
Sisense takes a different approach by embedding analytics directly into the tools and workflows that businesses rely on every day. Instead of isolating analytics within separate dashboards, Sisense integrates insights into the daily processes and applications teams already use, making data more accessible and actionable [3][4].
Key Features and Strengths
One standout feature of Sisense is its compatibility with multiple programming languages. Data teams can work with SQL, Python, or R within a single environment, providing flexibility for various technical needs [5]. To make things even easier, Sisense includes macros that simplify SQL exploration by offering shortcuts for complex queries. As Bala Parthasarathy, CEO and Co-founder of MoneyTap, puts it:
"You can write regular SQL, of course, but these macros make it easier to turn marketing guys and product people into basic SQL programmers." [5]
This combination of features makes Sisense a strong choice for real-time analytics, especially for teams with technical expertise.
Best Use Cases
Sisense is ideal for organizations with technical teams familiar with SQL who want to integrate analytics seamlessly into their workflows. The macro functionality bridges the gap between technical and non-technical users, empowering broader teams to access and use data effectively. It’s especially valuable in settings where real-time data integration is a priority.
Integration Capabilities
The platform allows businesses to embed analytics into both internal and customer-facing applications. This ensures that insights are available exactly where decisions are made, eliminating the need for users to toggle between separate analytics tools [3][4].
Pricing and Scalability
Sisense’s pricing starts at $21,000 per year [3]. It holds a solid 4.1-star rating on Gartner, based on 788 reviews, reflecting its dependability [4]. However, the basic "Data Discovery" tool may pose challenges for teams without SQL expertise and can encounter performance issues with lower reporting volumes [5].
6. Qlik Sense
Qlik Sense sets itself apart with its associative analytics engine, which allows users to explore data relationships in a way that traditional query-based tools just can't. Instead of sticking to a linear analysis path, users can click through data, with the platform automatically highlighting related information in green, unrelated data in gray, and potential connections in white. This approach makes uncovering hidden patterns and connections much easier for analysts.
Key Features and Strengths
At the heart of Qlik Sense is its associative model, which supports self-service analytics. This means business users can build interactive dashboards on their own without needing constant IT support. Its drag-and-drop interface is user-friendly, even for those without technical expertise. Plus, its smart visualizations automatically suggest the best chart types based on the data being analyzed, simplifying the process even further.
Another standout feature is its responsive design. Whether you're using a smartphone, tablet, or desktop, the platform offers full functionality without requiring separate mobile versions. This ensures a seamless experience across all devices.
Best Use Cases
Qlik Sense shines in situations where flexible, exploratory analysis is a priority. It’s particularly useful for organizations that don’t have predefined questions but need to dig into data to uncover insights. Industries like retail, healthcare, and financial services often use Qlik Sense to analyze customer behavior, identify operational inefficiencies, or track market trends.
The platform is also a strong fit for collaborative analytics environments. Teams can share insights, annotate findings, and build on each other's work within the same workspace.
For businesses dealing with complex data relationships, Qlik Sense proves invaluable. Manufacturing companies, for example, use it to trace quality issues across supply chains, while healthcare systems analyze patient journeys across multiple touchpoints to improve care delivery.
Integration Capabilities
Qlik Sense connects to over 100 data sources, including popular cloud platforms like Amazon Web Services, Microsoft Azure, and Google Cloud Platform. It supports both structured and unstructured data, pulling from databases, spreadsheets, web services, and even big data sources.
The platform also provides REST APIs, making custom integrations possible. This is especially helpful for software companies looking to embed Qlik Sense visualizations directly into their applications, adding analytics features seamlessly.
Pricing and Scalability
Qlik Sense uses a user-based pricing model, starting at around $30 per user per month for professional licenses. These licenses come in different tiers, such as analyzer and professional user types. Professional users have full access to creation and collaboration features, while analyzer licenses are more focused on viewing and interacting with dashboards.
For larger organizations, Qlik Sense scales effortlessly thanks to its multi-cloud architecture. It can handle datasets ranging from thousands to billions of rows, with features like associative caching that speed up repeat queries on the same data.
The platform’s in-memory processing ensures consistent performance, keeping frequently accessed data readily available for quick analysis, even at scale.
7. AWS QuickSight
AWS QuickSight is a cloud-based business intelligence tools comparison designed to work effortlessly within the AWS ecosystem. It connects directly to various AWS data sources, making it an excellent option for organizations heavily relying on AWS services.
Best Use Cases
QuickSight shines for businesses that are deeply integrated with AWS services like Amazon Redshift, RDS, or S3. It streamlines essential data analysis and reporting features, which can be a game-changer for companies managing complex data workflows, similar to how SMBs approach BI tool selection. Here are a few examples of how it’s used in practice:
Integration Capabilities
QuickSight’s ability to integrate with AWS services enables powerful automation across industries. For instance, a healthcare facilities company in October 2023 used QuickSight alongside Amazon EventBridge to automate dashboard deployment. Updates to a development dashboard triggered AWS Lambda functions, which deployed changes to production while simultaneously backing up assets to Amazon S3 [6].
Another example comes from 2025, when a real estate company utilized QuickSight’s Pixel-perfect Reports in combination with AWS Step Functions and Amazon EventBridge Scheduler. This setup automated the creation of state-specific business intelligence reports, stored them in S3, and sent notifications through Amazon SNS - saving significant time and effort [7].
QuickSight also provides REST APIs for connecting with external systems. Companies like Oomnitza have used these APIs to simplify user management tasks, making it easier to provision and manage access to analytics resources efficiently.
8. Domo
Domo stands out as a tool designed to make data preparation easier. With its drag-and-drop ETL feature, it simplifies the process of organizing and cleaning data. This approach is especially helpful for business users who don’t have a deep technical background but need to work with data efficiently [1].
9. GoodData
GoodData stands out as a developer-focused platform designed for creating custom analytics solutions. Unlike tools that prioritize pre-built interfaces, GoodData emphasizes flexibility and integration, making it a go-to choice for embedding analytics directly into applications using a scalable analytics architecture to drive revenue.
Key Features and Strengths
GoodData’s Analytics as Code (AaC) approach allows developers to manage and deploy analytics through code. This provides unparalleled control over how analytics are built and maintained, offering an alternative to the limitations of traditional business intelligence tools.
The platform caters to a wide audience, from non-technical users to seasoned developers. Business users can take advantage of its no-code, user-friendly interface, while developers have the freedom to implement custom solutions using full-code options. Its headless BI architecture removes front-end restrictions, enabling organizations to design unique user experiences tailored to their needs.
For companies aiming to monetize their data, GoodData provides tools to build and sell custom analytics products. These solutions can serve both internal decision-making and external customer-facing applications, making it an excellent choice for organizations seeking flexible and revenue-generating analytics.
Best Use Cases
GoodData shines in scenarios where traditional BI platforms may not suffice. Its Analytics as Code model is particularly beneficial for organizations with strong development teams that want programmatic control over their analytics setup. Additionally, it excels in embedded analytics tools projects, allowing businesses to seamlessly incorporate data insights into their existing applications.
Unlike platforms that focus heavily on no-code solutions, GoodData empowers developers to create highly customized analytics experiences. For companies looking to scale their data products, it provides the tools to transform internal analytics into customer-facing offerings, opening up new revenue opportunities.
Integration Capabilities
GoodData’s integration capabilities are widely praised on platforms like G2 and TrustRadius. It offers extensive API and SDK support, making it easy to build custom solutions and connect with existing systems. This flexibility ensures that organizations can seamlessly integrate GoodData into their existing workflows and infrastructure.
Pricing and Scalability
GoodData provides a free trial for companies to explore its features, along with the option to request a personalized demo. Its scalable governance and security measures are designed to support large-scale data operations, making it a strong choice for enterprises managing analytics across multiple departments or customer groups.
10. ThoughtSpot
ThoughtSpot presents itself as an AI-driven analytics platform designed to bridge the gap between technical data teams and business users. By leveraging AI-powered natural language search, it enables users to interact with data in a more intuitive way. Its high ratings on Gartner Peer Insights reflect its strong performance in enterprise settings [4]. Let’s dive into its key features, practical applications, integrations, and pricing.
Key Features and Strengths
One of the standout aspects of ThoughtSpot is its search-based BI tools using natural language. Instead of constructing complex queries, users can simply type questions in plain English, making data exploration accessible to everyone in an organization - not just the technical experts.
Its AI tool, SpotIQ, automatically uncovers insights and highlights patterns that might otherwise go unnoticed [8]. ThoughtSpot also excels in integrating diverse data sources, effectively breaking down data silos [8]. While its interface is user-friendly for non-technical users, it also supports SQL for those who need advanced analytical capabilities [8].
"ThoughtSpot is the Agentic Analytics Platform company for the enterprise. With natural language and AI, ThoughtSpot empowers everyone in an organization to ask data questions, get answers, and take action. Code-first for data teams and code-free for business users, ThoughtSpot is intuitive enough for anyone to use, yet built to handle large, complex cloud data at scale." [4]
These features make it highly effective for enterprise-level analytics.
Best Use Cases
ThoughtSpot is ideal for organizations looking to empower business users to access insights independently. By enabling natural language queries, it eliminates the bottleneck of relying solely on IT teams for data analysis. This self-service approach is particularly valuable for businesses managing large datasets and complex cloud environments, as it combines ease of use with the ability to handle advanced analytics when needed [4].
Integration Capabilities
Designed to work seamlessly across large enterprises, ThoughtSpot integrates with various data sources, ensuring smooth data flow and removing barriers between siloed datasets [8]. This makes it a versatile tool for businesses with diverse analytics needs.
Pricing and Scalability
ThoughtSpot offers pricing options to fit different business sizes and needs. For small teams exploring its capabilities, the ThoughtSpot for Teams plan is available at $95 per month [8]. For larger organizations, Enterprise Plans start at approximately $25,000 per year for basic configurations, with custom pricing available for more tailored solutions [8]. The platform is built to scale, accommodating large datasets and multiple user groups, making it a reliable choice for businesses planning to grow their analytics operations.
11. IBM Cognos Analytics
IBM Cognos Analytics is a business intelligence platform designed to meet the needs of large enterprises. It combines traditional reporting tools with AI-driven insights, making it a powerful solution for analyzing complex organizational data. This mix of classic and modern analytics tools allows businesses to handle diverse data challenges effectively.
Key Features and Strengths
One standout feature of IBM Cognos Analytics is its AI-powered assistant, which simplifies data exploration by automatically generating visualizations and uncovering key relationships in the data. Users can ask natural language questions like, "What were our sales trends last quarter?" and receive instant, visually rich answers through AI-driven self-serve analytics.
The platform also excels in delivering enterprise-grade reports that meet compliance standards while supporting both self-service business intelligence and advanced data modeling. Its automated data preparation feature cleans and organizes data effortlessly, saving analysts significant time. Additionally, it offers intuitive drag-and-drop dashboard creation, predictive analytics, and what-if modeling to help forecast trends and evaluate potential outcomes.
Best Use Cases
IBM Cognos Analytics is particularly well-suited for large organizations with diverse reporting needs across multiple departments. It shines in industries like healthcare, finance, and government, where strict compliance and data security are critical. The platform’s ability to facilitate standardized reporting across global operations and manage complex data governance requirements makes it a strong choice for enterprises with strict data policies. Whether a company needs basic reporting or advanced predictive analytics, IBM Cognos Analytics provides a comprehensive solution.
Integration Capabilities
Beyond its core features, IBM Cognos Analytics integrates seamlessly with IBM's broader ecosystem, including IBM Cloud, Watson, and various database tools. It also connects to widely used data sources like Oracle, SQL Server, Salesforce, and major cloud platforms. The platform supports hybrid cloud setups, enabling businesses to maintain on-premises data while leveraging cloud-based analytics. Additionally, its REST APIs allow for custom integrations with existing business applications, making it a flexible option for complex IT environments.
Pricing and Scalability
IBM Cognos Analytics follows a user-based pricing model with multiple tiers to accommodate different functionality needs. For larger enterprise deployments, custom pricing options are available. The platform is designed to scale efficiently, supporting anywhere from a few hundred to thousands of users, with both cloud and on-premises deployment options to fit varying organizational requirements.
12. SAP Analytics Cloud

SAP Analytics Cloud is a comprehensive business intelligence platform that combines analytics, planning, and predictive tools into part of a modern analytics stack. Designed for organizations already invested in the SAP ecosystem, this cloud-based platform offers powerful insights by integrating seamlessly with SAP applications and data sources. This tight integration allows businesses to dive deep into their data, enabling more informed decision-making and efficient planning.
Key Features and Strengths
With built-in machine learning, SAP Analytics Cloud identifies anomalies and trends, providing actionable insights with ease. Its collaborative tools for planning and budgeting allow teams across departments to work together in real time, ensuring financial models and operational forecasts are consistently aligned. The platform's predictive analytics engine uses historical data to project future trends, while its smart discovery features create visual data stories that highlight key business drivers in an easy-to-understand format.
Best Use Cases
This platform is particularly effective for mid- to large-sized enterprises already using SAP ERP or SuccessFactors. It excels in financial consolidation, reporting, and ensuring regulatory compliance. Additionally, it’s ideal for annual budgeting, quarterly forecasting, and scenario modeling. Companies aiming to improve their supply chain operations can also leverage the platform to analyze procurement patterns, manage inventory, and forecast demand - all within a unified system.
Integration Capabilities
One of SAP Analytics Cloud's standout features is its native integration with key SAP systems like SAP S/4HANA, SAP BW, and SAP HANA, enabling real-time analytics. Beyond SAP, it supports connections with Microsoft Excel, SQL databases, and cloud data warehouses through REST APIs. The platform also integrates with collaboration tools like Microsoft Teams, making it easier for teams to share insights and coordinate planning efforts.
Pricing and Scalability
SAP Analytics Cloud operates on a subscription model, offering flexible tiers to suit varying business requirements. The platform is designed to scale effectively, accommodating everything from small teams to large enterprises. For pricing details, businesses should reach out to SAP or an authorized partner.
13. Google Data Studio

Google Data Studio is a free tool for transforming raw data into interactive dashboards and reports. Part of Google's business tools suite, it provides an easy way for organizations to visualize their data without needing a big budget. Its standout feature is its straightforward design and seamless integration with Google services, making it especially appealing for small to medium-sized businesses already using tools like Google Workspace or Google Analytics.
Key Features and Benefits
Google Data Studio makes creating dashboards simple with its KPI dashboard layout and drag-and-drop interface. It also supports real-time collaboration, allowing multiple users to edit reports simultaneously. The platform offers a variety of visualization options, including charts, tables, geo maps, and scorecards that update automatically as the data changes.
For those looking for a starting point, the template gallery includes pre-built report formats tailored for tasks like monitoring social media performance, analyzing e-commerce data, and tracking marketing campaigns. Additionally, users can create custom metrics and calculations without modifying the original data, offering flexibility for more tailored insights.
Practical Applications
Google Data Studio is a go-to tool for digital marketing teams tracking the performance of campaigns across different channels. Marketing agencies often rely on it to build client-facing dashboards that combine data from Google Ads, website analytics, and even platforms like Facebook Ads through third-party connectors. Small retail businesses can use it to keep an eye on online sales trends, inventory, and customer behaviors.
Educational institutions also benefit, using the tool to create dashboards for student performance, attendance, and budget tracking. Nonprofits find it helpful for presenting donor impact reports and tracking fundraising progress. These use cases are made even more powerful by the platform's strong integration capabilities.
Integration Options
Google Data Studio connects seamlessly with over 20 Google services, such as Google Analytics, Google Ads, YouTube Analytics, and Google Sheets. Once accounts are authenticated, the connections are automatic, requiring no technical expertise. Beyond Google's tools, the platform supports connections to SQL databases and CSV files. For other data sources, Community Connectors built by third-party developers expand integration options to platforms like Facebook Ads, Salesforce, HubSpot, Mailchimp, and Shopify. It also integrates with BigQuery, allowing users to analyze large datasets stored in Google's cloud data warehouse using warehouse-native data analysis tools. These integrations make it an excellent choice for teams already using Google's ecosystem.
Pricing and Limitations
Google Data Studio is entirely free for individuals and small teams, with no limits on the number of reports or dashboards you can create. The only costs come from the underlying data services, such as BigQuery usage fees.
While the tool works well for small to medium-sized organizations, it does have its boundaries. For example, individual charts are limited to 100,000 rows of data, and there are restrictions on the number of data sources per report. Larger organizations with more complex needs, such as advanced security features or extensive customization, might find these limitations challenging as their data grows in complexity.
14. Alteryx
Alteryx is a user-friendly analytics platform designed to help businesses build complex data workflows through a simple drag-and-drop interface. This makes it possible for non-technical teams to handle workflows on their own, without needing to rely heavily on IT support.
Jasper Flour summed it up well:
"If you have data engineers who write Python, use Airflow or Prefect. If you need business users to build workflows without IT, use Mammoth or Alteryx." – Jasper Flour [9]
15. RapidMiner
RapidMiner is a data science platform that blends machine learning, predictive analytics, and data preparation into a single, user-friendly environment. With its visual workflow designer, it enables users to create sophisticated analytics models without needing advanced coding skills. This approach makes it especially appealing to business analysts and domain experts.
Key Features and Strengths
RapidMiner's visual workflow system allows users to design complex data science processes by simply dragging and dropping operators. The platform includes over 1,500 built-in algorithms and functions, covering everything from standard statistical methods to advanced machine learning techniques like deep learning and ensemble models.
One standout feature is its automated machine learning (AutoML) capabilities. AutoML can automatically identify the best algorithms and fine-tune parameters for specific datasets, saving time and simplifying the process for users who may not have a deep background in data science.
Its data preparation tools address common challenges like missing values, outliers, and data transformations. RapidMiner is also highly versatile, connecting to a wide range of data sources, including traditional databases, cloud storage, and streaming data feeds.
Best Use Cases
RapidMiner is particularly effective in predictive maintenance for manufacturing and industrial applications. By analyzing sensor data, companies can predict equipment failures before they happen, minimizing downtime and cutting maintenance costs.
Another popular area is customer analytics, where businesses use RapidMiner to build models for churn prediction, customer segmentation, and lifetime value analysis. Its ability to process both structured and unstructured data makes it ideal for combining customer feedback with transaction data.
Academic institutions and research organizations often rely on RapidMiner for experimental design and hypothesis testing. Its statistical tools and visualization features support detailed research processes.
Integration Capabilities
RapidMiner integrates smoothly with widely-used AI business intelligence tools for non-technical users and can send results directly to reporting platforms. It also supports REST APIs, enabling businesses to embed predictive models into their existing applications and workflows.
The platform connects with major databases like Oracle, SQL Server, MySQL, and cloud systems such as Amazon Redshift and Google BigQuery. For big data projects, it works with Hadoop ecosystems and Apache Spark.
Additionally, RapidMiner offers Python and R integration, allowing data scientists to use custom scripts and specialized libraries while managing the overall workflow visually.
Pricing and Scalability
RapidMiner uses a tiered pricing structure, starting with a free version that supports up to 10,000 data rows and basic features. Professional licenses begin at several thousand dollars per year, with enterprise pricing tailored to the number of users and processing needs.
For flexibility, cloud deployment options provide scalable resources, allowing the platform to handle datasets ranging from thousands to millions of records. The system adjusts processing power based on workload, making it a cost-effective option for businesses with varying needs.
For organizations prioritizing control and security, enterprise installations can be deployed on-premises or in private cloud environments. These setups allow companies to meet strict compliance requirements while maintaining the ability to scale as their data processing demands grow.
Tool Comparison Table
Below is a summary of key features and pricing for the tools discussed earlier. This table is designed to make it easier to compare options and identify the right solution for your business.
Tool | Best For | Key Strengths | Data Sources | Starting Price (USD) | Enterprise Features |
|---|---|---|---|---|---|
Querio | AI-powered natural language queries | No SQL needed, live connections, unlimited viewers | Snowflake, BigQuery, Postgres | $14,000/year | |
Tableau | Advanced data visualization | Interactive dashboards, wide range of chart types | 80+ connectors (databases, cloud) | $75/user/month | Row-level security, enterprise governance |
Power BI | Microsoft ecosystem integration | Seamless Office 365 integration, budget-friendly | Azure, SQL Server, Excel, SharePoint | $10/user/month | Active Directory integration, compliance |
Looker | Developer-centric analytics | LookML modeling, Git version control | Google Cloud, databases, APIs | $5,000/month minimum | Advanced governance, API-first approach |
Sisense | Complex data simplification | AI insights, handles large datasets | 100+ connectors, real-time streaming | Custom pricing | White-label options, advanced security |
Qlik Sense | Self-service analytics | Associative data model, drag-and-drop tools | On-premise and cloud sources | $30/user/month | Multi-cloud deployment, enterprise security |
AWS QuickSight | Cloud-native analytics | Serverless setup, pay-per-session pricing | Native AWS integration, S3, Redshift | $5/user/month | Machine learning insights, embedding |
Domo | Real-time business intelligence | Cloud-native, mobile-friendly design | 1,000+ connectors, real-time data | $83/user/month | Advanced collaboration, governance |
GoodData | Embedded analytics | White-label solutions, developer-friendly APIs | Cloud and on-premise sources | Custom pricing | Multi-tenant architecture, compliance |
ThoughtSpot | Search-driven analytics | Google-like search, natural language capabilities | Cloud warehouses, databases | Custom pricing | Governance controls, scalability |
IBM Cognos Analytics | Enterprise reporting | AI automation, robust reporting | IBM ecosystem, databases, cloud | $15/user/month | Enterprise-grade security, compliance |
SAP Analytics Cloud | SAP ecosystem integration | Combines planning and analytics | SAP systems, third-party sources | $36/user/month | SAP HANA integration, enterprise features |
Google Data Studio | Budget-conscious teams | Free tier, integrates with Google ecosystem | Google services, databases, files | Free (paid features vary) | Basic sharing and collaboration |
Alteryx | Data preparation and blending | Visual workflow design, advanced prep tools | 80+ data sources, APIs | $5,195/user/year | Server deployment, advanced governance |
RapidMiner | Machine learning and predictive analytics | AutoML, 1,500+ algorithms | Databases, cloud, streaming data | Free tier available | Enterprise deployment, Python/R integration |
This table highlights the unique strengths of each tool, helping you align their capabilities with your specific requirements.
For enterprise users, tools like Querio, Tableau, Power BI, and IBM Cognos Analytics offer scalable solutions with robust certifications. On the other hand, mid-market companies may find tools like Querio's natural language queries, Tableau's visualization features, or Power BI's seamless Microsoft integration ideal for natural language analytics and self-service dashboards without heavy IT involvement.
Conclusion
Selecting the best business analytics softwares is all about aligning its features with your specific data requirements and future growth plans. The 15 tools we’ve covered each bring their own strengths to the table, designed to support informed, data-driven decisions. To make the right choice, focus on four key factors: functionality, scalability, integration, and cost.
As outlined earlier, it’s essential to assess your business needs, technical expertise, data management priorities, and growth goals. For smaller businesses with limited resources, tools that are easy to use and budget-friendly might be the best fit. On the other hand, larger organizations managing complex or sensitive data may need enterprise-level platforms with advanced security and performance capabilities. Whatever you choose, the tool should work seamlessly with your current systems, handle increasing data and user demands, and adapt to advancements like AI-powered insights and predictive analytics. You can also compare top AI tools for data analysis to see which features best align with your team's technical skills. Modern AI-powered data analysis tools further streamline this process by providing real-time insights and automated cleaning.
FAQs
How can I choose the right data analysis tool for my organization’s needs and budget?
When choosing a data analysis tool, it’s essential to start with a clear understanding of your organization’s needs. Think about the type of data you handle, your team’s technical abilities, and the goals you want to achieve with business intelligence. Key considerations include user-friendliness, scalability, and collaboration capabilities, along with how seamlessly the tool integrates with your current systems.
Budget is another critical factor. Look for a tool that delivers the features you need while staying within your financial constraints. Additionally, prioritize options that offer robust data security and dependable customer support to ensure a smooth implementation process and ongoing reliability. The right tool should align with your organization’s specific goals and enable your team to make confident, informed decisions based on data.
How do AI-driven natural language query tools like Querio differ from traditional SQL-based analytics platforms?
AI-powered tools like Querio make it easier for anyone to analyze data by using plain, everyday language. Instead of crafting complicated SQL queries, users can simply type their questions in English and get immediate insights. This approach eliminates the need for advanced technical skills and helps speed up decision-making.
On the flip side, traditional SQL-based analytics platforms demand a strong grasp of SQL syntax and database structures. While these platforms offer a high degree of customization and power, they can be challenging and time-intensive for those without a technical background.
Querio stands out by prioritizing ease of use and accessibility through natural language processing, whereas traditional SQL platforms cater to advanced users who value flexibility and control.
How can I choose a data analysis tool that works with my current systems and supports future growth?
When choosing a tool, make sure it works seamlessly with your current data sources and formats, like SQL, NoSQL, or cloud platforms. Tools that offer APIs, connectors, and data pipelines can simplify integration and ensure everything runs smoothly.
If scalability is a priority, focus on solutions built to manage large datasets and accommodate increasing demands. Cloud-based tools, in particular, often provide the flexibility and capacity to grow alongside your needs. It's also important to regularly evaluate whether the tool aligns with changes in your infrastructure while meeting security and compliance standards to maintain proper data governance.
Related Blog Posts


