Business Intelligence
Business Analytics Tools: The Complete Guide for Data Teams (2026)
Build a warehouse-centered analytics stack with shared metrics, semantic layers, live queries, inspectable SQL, and governance.

Most data teams do not need one tool. They need a stack that keeps metrics the same across BI, SQL, notebooks, governance, and AI. If two analysts can calculate monthly active users and get two different answers, the main issue is not reporting speed. It is metric logic.
I’d boil this guide down to one idea: put your warehouse at the center, define metrics once, and let every tool read from that same logic. For most 100–500 person B2B SaaS teams, that means using a warehouse like Snowflake, BigQuery, Redshift, or Postgres, plus dbt for models, a semantic layer for SaaS for shared metrics, BI for repeat reporting, notebooks for deep analysis, and AI only when it shows the SQL or Python behind the answer.
Here’s the short version:
- BI tools like Looker, Tableau, Power BI, and ThoughtSpot are best for repeat KPI reporting.
- SQL editors are best for analyst-led ad hoc work on live warehouse data.
- Notebooks like Hex, Jupyter, and Deepnote help with SQL + Python analysis.
- Semantic layers like dbt Semantic Layer, LookML, Cube, and Power BI semantic models keep metric logic in one place.
- Governance controls handle access, audit trails, and compliance checks like SOC 2 Type II.
- AI assistants help business users get self-serve answers, but only work well when they use shared metric logic instead of raw schema alone.
A few practical checks matter more than a long feature list:
- Live warehouse queries instead of CSV exports or stale copies
- Inspectable code so analysts can review and edit SQL or Python
- Role-based access and SSO for access control
- Shared metric definitions across dashboards, notebooks, and AI answers
About 70% to 80% of analytics work in many SaaS teams still starts with repeat questions: pipeline, retention, revenue, usage, and active users. That is why metric drift becomes expensive fast. One number mismatch can spread across finance, product, and GTM in a single week.
Quick comparison
| Category | Best for | Main risk without shared logic |
|---|---|---|
| BI & dashboarding | Repeat reports and exec dashboards | Slow follow-up analysis |
| SQL editors | Direct warehouse analysis | Different people define metrics differently |
| Notebooks | Mixed SQL/Python work | Logic gets buried in cells |
| Semantic layers | Shared metric rules | Setup takes upfront work |
| Governance & security | Access control and audit trails | Data access can get messy |
| AI assistants | AI for self-serve analytics | Answers can drift from team metrics |
If I were choosing a 2026 stack, I’d ask three questions first: Who needs answers, how often do definitions change, and how much self-serve access does the business want? The rest of the guide helps map those answers to the right mix of tools.
The six categories of business analytics tools that matter in 2026
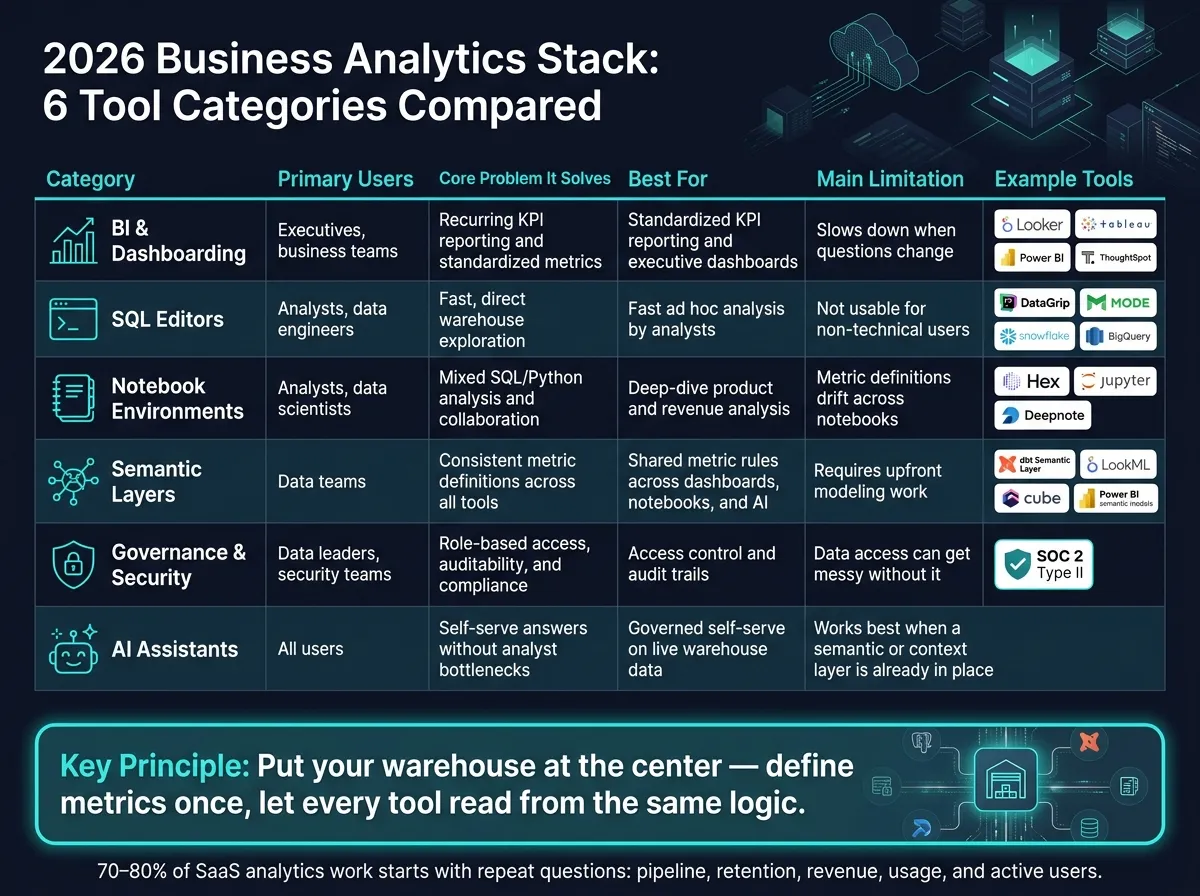
These six categories are the main options that turn warehouse data into decisions teams can trust.
BI, SQL, and notebooks: tools for reporting and analysis
For recurring reporting, BI tools are usually the first layer business teams interact with. BI and dashboarding platforms like Looker, Tableau, Power BI, and ThoughtSpot are built for recurring KPI reporting. They’re where executive dashboards, board-level metrics, and standardized reports live. Their focus is consistency and trust, not fast exploration, so ad hoc questions can take more time to answer.
SQL editors are for analysts who need direct warehouse access. They connect straight to Snowflake, BigQuery, Redshift, or Postgres and let analysts work right in the warehouse. They’re great for fast investigation. But on their own, they don’t offer much governance or reuse.
When SQL by itself starts to feel limiting, notebooks step in. Notebook environments like Hex, Jupyter, and Deepnote sit between raw SQL and deeper analysis. They combine SQL and Python for cleaning data, running calculations, and building interactive analysis, all without leaving the warehouse.
Semantic layers, governance, and AI assistants
Semantic layers help fix metric drift by defining joins, filters, and metric logic once, then exposing those definitions to every downstream tool. Tools like the dbt Semantic Layer, LookML, Cube, and Power BI semantic models help keep metrics consistent across dashboards, notebooks, and AI-generated answers.
Governance and security features manage access, track activity, and support compliance. They enforce role-based access and help make sure sensitive data is only visible to the right people.
AI assistants help ease the analyst bottleneck by letting non-technical users ask questions in plain language and get answers based on live warehouse data. The big test is simple: is the assistant grounded in shared business logic - metrics, joins, and terminology - or only in schema? When it uses governed context, the output is far more consistent and useful.
| Category | Primary users | Core problem it solves |
|---|---|---|
| BI & dashboarding | Executives, business teams | Recurring KPI reporting and standardized metrics |
| SQL editors | Analysts, data engineers | Fast, direct warehouse exploration |
| Notebook environments | Analysts, data scientists | Mixed SQL/Python analysis and collaboration |
| Semantic layers | Data teams | Consistent metric definitions across all tools |
| Governance & security | Data leaders, security teams | Role-based access, auditability, and compliance |
| AI assistants | All users | Self-serve answers without analyst bottlenecks |
The next section compares the leading tools in each category and where each fits best.
How the main tool categories compare for data teams
Most data teams don’t get what they need from a single platform. In practice, they use a mix. The big decision is simpler than it sounds: where does metric logic live, and who needs to query it?
BI and dashboarding platforms: Looker, Tableau, Power BI, ThoughtSpot
Looker, Tableau, Power BI, and ThoughtSpot are best for standardized KPI reporting. They work well when teams want the same numbers, shown the same way, on a regular basis.
The friction shows up when the question changes. If someone wants to dig into a new angle, test a one-off idea, or ask a follow-up that wasn’t built into the dashboard, these tools tend to slow things down.
SQL editors and notebook tools: native warehouse query editors, DataGrip, Mode, Jupyter, Hex, Deepnote
Tools like DataGrip, Mode, and native query editors in Snowflake, BigQuery, Redshift, and Postgres give analysts fast ad hoc access to live warehouse data. That makes them useful when someone needs to move fast and answer a question directly in SQL.
The tradeoff is usability for non-technical users. SQL editors need someone who can write queries. And even then, consistency can still break down. Two analysts can define "monthly active users" differently and end up with two different numbers.
Notebook environments like Hex, Jupyter, and Deepnote add Python on top of SQL. That makes them a strong match for product analysis, cohort modeling, or revenue attribution, where teams often need code, iteration, and room to test ideas.
The hard part is governance. In notebooks, logic lives inside cells. Over time, definitions drift, copies spread, and people stop trusting whether two analyses are using the same rules.
Exploration only helps if stable logic can move out of notebooks and into a governed layer.
Semantic and AI-native analytics layers: dbt Semantic Layer, LookML, Cube, Querio
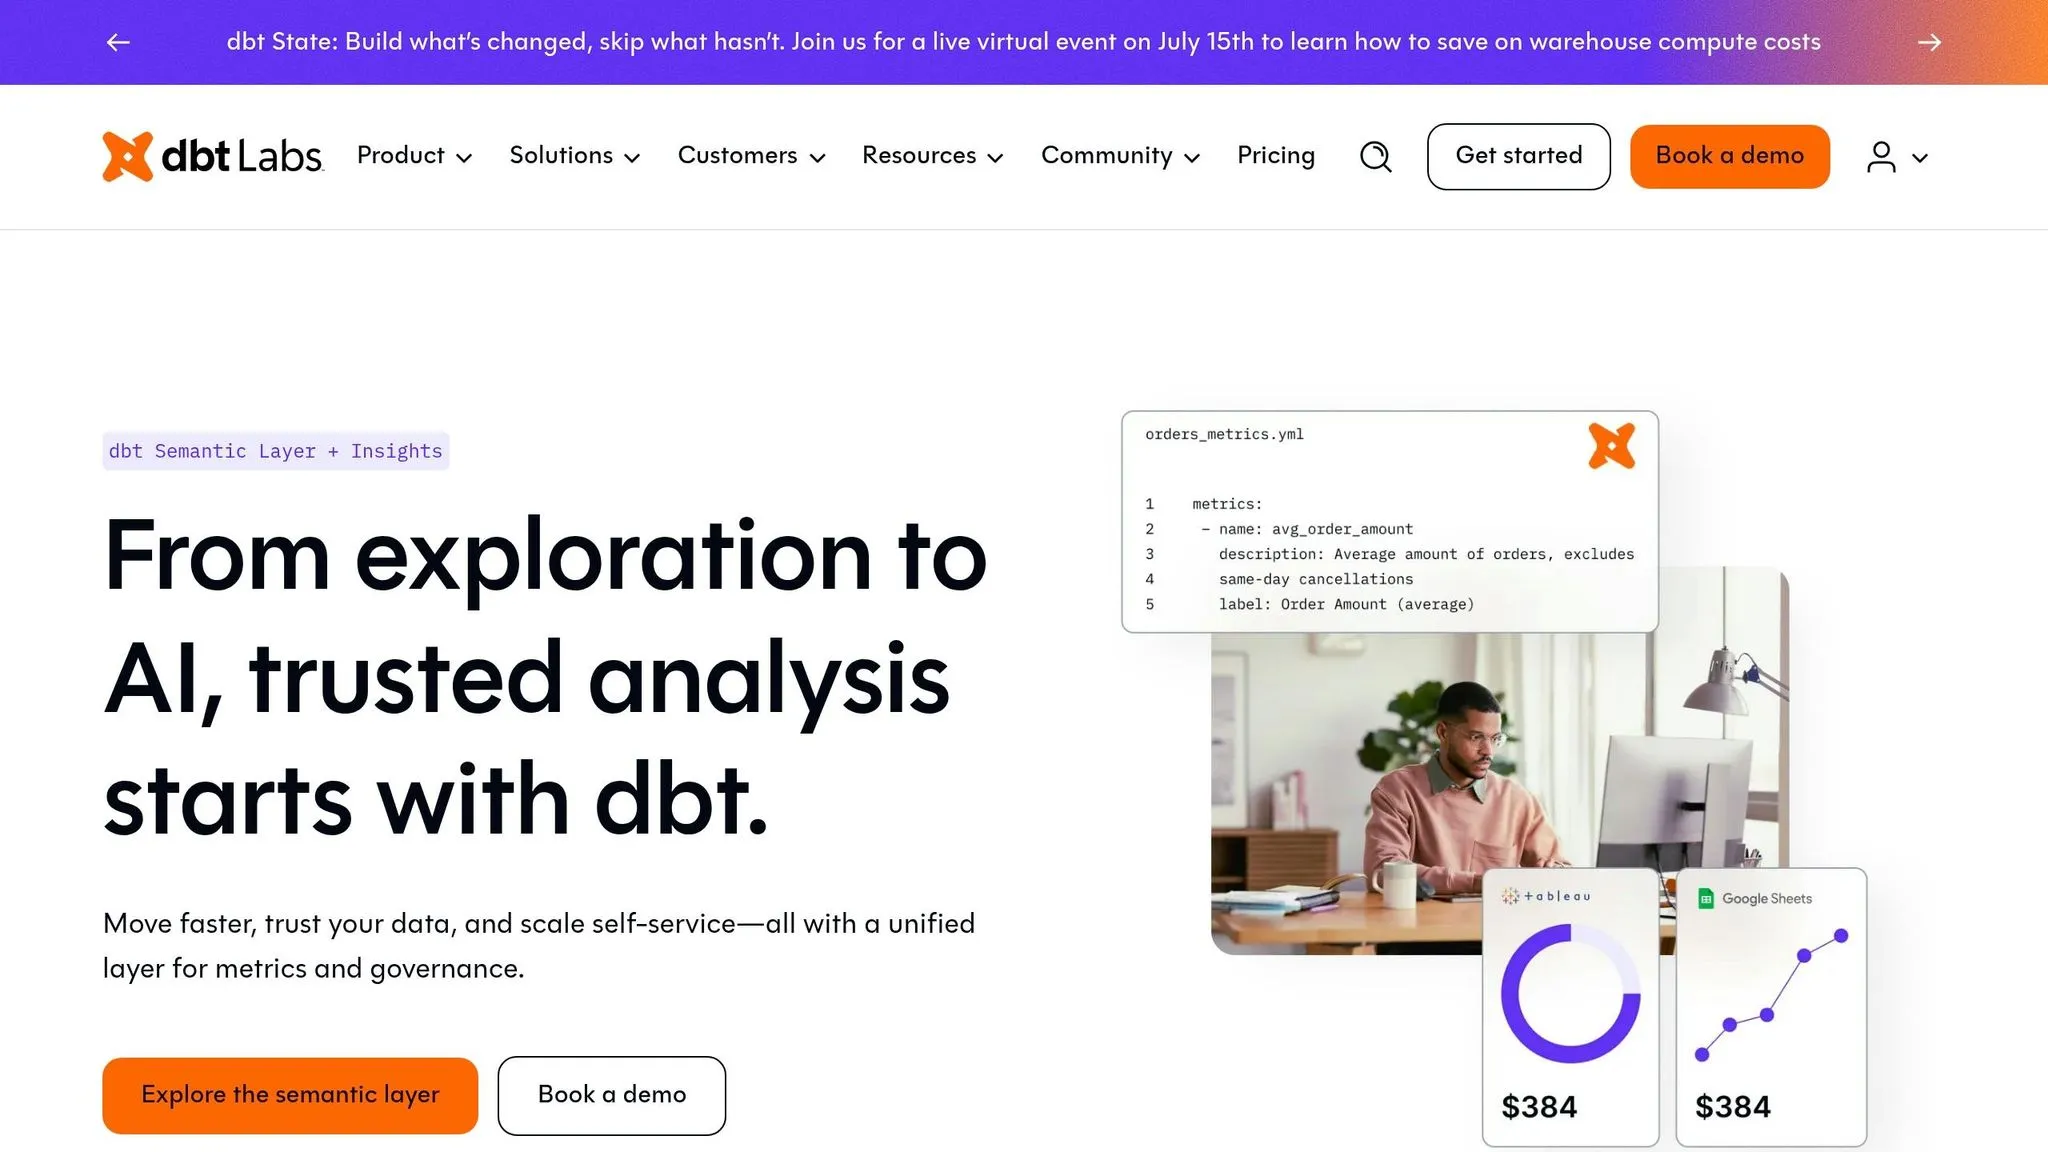
The semantic layer is where metric consistency lives. Code-first tools like the dbt Semantic Layer let analytics engineers define joins, metrics, and business terminology once in version-controlled files. That works well when the data team has time to model things up front.
Once that shared logic is in place, it can feed dashboards, notebooks, and AI-generated answers with the same definitions behind each one.
Querio fits teams that want governed, warehouse-native self-serve analytics with live answers users can inspect and edit. It combines governed context, editable SQL/Python, and live warehouse answers in a reactive notebook environment. That means non-technical stakeholders can get reliable answers without waiting in an analyst queue.
The matrix below shows the main tradeoffs at a glance.
| Category | Best for | Main limitation |
|---|---|---|
| BI & dashboarding | Standardized KPI reporting and executive dashboards | Slows down when questions change |
| SQL editors & native warehouse UIs | Fast ad hoc analysis by analysts | Not usable for non-technical users |
| Notebook environments | Deep-dive product and revenue analysis | Metric definitions drift across notebooks |
| Semantic layers | Consistent metric definitions across all tools | Requires upfront modeling work |
| AI-native analytics | Governed self-serve on live warehouse data | Works best when a semantic or context layer is already in place |
How to choose the right business analytics stack for your team
Match tools to team maturity, warehouse setup, and governance needs
Start with three honest questions: Who needs answers? How often do metric definitions change? How much self-serve access does the business expect?
If your team already works in Snowflake, BigQuery, Redshift, or Postgres, access usually isn't the hard part. Governance is. That's why it helps to map your team first and pick the stack second.
| Team profile | Primary need | Key capability to prioritize |
|---|---|---|
| SQL-heavy analyst team | Fast ad hoc analysis | Warehouse-native SQL editor, notebook environment |
| Mixed-skill team with rising self-serve demand | Self-serve without metric drift | Governed semantic layer + AI-assisted querying |
| Multi-team reporting (product, finance, GTM) | Consistent numbers across reports | Shared metric definitions, SSO, row-level access control |
| Compliance-heavy SaaS team | Auditability and access control | SOC 2 Type II, role-based permissions, inspectable SQL |
One of the fastest ways to find the right stack is to check whether your current setup can produce the same metric twice. Ask two analysts to calculate "monthly active users" on their own.
If they come back with different numbers, you likely don't have a tool problem. You have a metric definition problem.
Stack patterns for common SaaS scenarios
Analyst-centric teams that spend most of their time in SQL often pair a notebook environment with a dbt project for transformation. That setup can work well for a while. Then the one-off questions pile up, and analyst bandwidth becomes the bottleneck.
Teams with many non-technical stakeholders need a different setup. The main risk here is consistency. If the system answering questions isn't tied to shared metric logic, you get polished-looking answers that don't match the dashboard. That's where tools with a governed semantic layer and AI-generated, inspectable SQL come in. Querio connects to the live warehouse, generates inspectable SQL and Python, and keeps metric logic governed. This matters most when non-technical teams need self-serve access without going off the rails.
Teams standardizing across product, finance, and GTM reporting need one source of truth for metrics. That could be the dbt, LookML, and other semantic layers. The point is simple: define core metrics once, then reuse them across dashboards, notebooks, and AI queries. Querio can work alongside current dbt workflows and use the shared semantic layer to keep AI-generated answers aligned with what's already modeled upstream.
What to test before rolling out a new tool
Before you commit, run a short proof of concept. You don't need a huge pilot. A few focused checks can tell you a lot.
- Live data, no exports. Make sure the tool queries your warehouse directly. If it depends on a CSV export or a synced copy of the data, you're already dealing with stale information.
- Inspectable SQL and Python. Any AI-generated answer should show the code behind it. Analysts should be able to read it, edit it, and override it. If the logic stays hidden, trust gets shaky fast.
- Safe self-serve for business users. Ask a non-technical stakeholder to answer three recurring questions. If they can do it on their own, and the answers match what analysts would produce, that's a good sign.
- Centralized logic the data team controls. Check whether the tool works with your current dbt models or semantic layer, and whether metric definitions live in one governed layer.
For compliance-heavy SaaS teams, also verify SSO, role-based access controls, and SOC 2 Type II before production use.
Conclusion: Build a warehouse-native analytics stack that balances speed and trust
In 2026, the best analytics stacks are modular. The warehouse remains the center of the setup, and each layer above it should do one clear job. What matters most is fit, not a long feature list.
The tension is still speed versus trust. Fast answers built on shaky metrics and semantic layers don't help for long. They usually create confusion, extra cleanup, and more back-and-forth than anyone wants. So the final decision should come down to fit, governance, and analyst bandwidth.
A 20-person data team and a 300-person SaaS org rarely need the same stack. The right tools depend on who needs answers, how closely metrics need to match across teams, and how much analyst time you can spare.
That leads to three nonnegotiables: live warehouse connections, inspectable code, and centralized metric logic.
FAQs
How do I know if we need a semantic layer?
You likely need a semantic layer when your team keeps running into mixed metric definitions across reports, or when AI-driven data workflows need high-accuracy, deterministic output.
A semantic layer gives you a single source of truth for shared business logic like revenue or retention. That means definitions stay consistent across tools and across teams.
Schema-first exploration is fine for fast ad hoc analysis. But once things start to scale, most teams need governed, standardized definitions instead.
What should a first analytics stack look like?
For a 100–500-employee SaaS company, the first analytics stack should center on an ELT setup built around a cloud data warehouse like Snowflake, BigQuery, or Redshift.
Here’s the basic idea: pull data in from your SaaS tools with automated connectors, then handle transformations inside the warehouse with dbt. That gives your team version-controlled, testable models instead of a mess of one-off SQL queries.
As the team grows, add a governed semantic layer so everyone works from the same metric definitions. That matters more than most teams expect. Without it, “revenue,” “active users,” or “pipeline” can mean slightly different things depending on who built the report.
It also helps to choose tools with live warehouse connections and inspectable SQL. That way, self-serve reporting is easier to trust, and AI-driven analysis has a cleaner foundation to work from.
How can we safely test an AI analytics tool?
Start with five business questions that sound simple but can mean different things. A good tool shouldn't jump to one answer and hope for the best. It should ask follow-up questions or show a few possible meanings so your team doesn't run with the wrong number.
Then use a simple verification ladder:
- Curiosity: Use the tool for early ideas and rough checks.
- Verification: Compare answers against known reports or source data.
- Spot-checking: Review a sample of outputs to see if the logic holds up.
- Delegation: Hand off low-risk work once the tool has earned trust.
- Embedded use: Put it into day-to-day workflows after you've checked it from a few angles.
Give extra weight to tools with transparent SQL and a governed semantic layer. That makes it much easier for your team to inspect the logic, trace where numbers come from, and keep metric definitions aligned across the business.